. 2019 Aug 2;294(31):11840-11852.
doi: 10.1074/jbc.RA119.008512. Epub 2019 Jun 14.

Mitosis-related phosphorylation of the eukaryotic translation suppressor 4E-BP1 and its interaction with eukaryotic translation initiation factor 4E (eIF4E)

Affiliations

Mitosis-related phosphorylation of the eukaryotic translation suppressor 4E-BP1 and its interaction with eukaryotic translation initiation factor 4E (eIF4E)

Rui Sun et al. J Biol Chem. .

Erratum in

Abstract

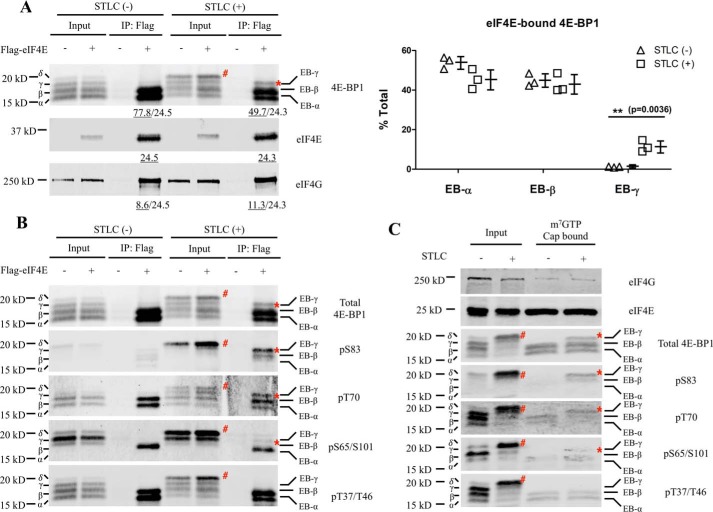
Eukaryotic translation initiation factor 4E (eIF4E)-binding protein 1 (4E-BP1) inhibits cap-dependent translation in eukaryotes by competing with eIF4G for an interaction with eIF4E. Phosphorylation at Ser-83 of 4E-BP1 occurs during mitosis through the activity of cyclin-dependent kinase 1 (CDK1)/cyclin B rather than through canonical mTOR kinase activity. Here, we investigated the interaction of eIF4E with 4E-BP1 or eIF4G during interphase and mitosis. We observed that 4E-BP1 and eIF4G bind eIF4E at similar levels during interphase and mitosis. The most highly phosphorylated mitotic 4E-BP1 isoform (δ) did not interact with eIF4E, whereas a distinct 4E-BP1 phospho-isoform, EB-γ, phosphorylated at Thr-70, Ser-83, and Ser-101, bound to eIF4E during mitosis. Two-dimensional gel electrophoretic analysis corroborated the identity of the phosphorylation marks on the eIF4E-bound 4E-BP1 isoforms and uncovered a population of phosphorylated 4E-BP1 molecules lacking Thr-37/Thr-46-priming phosphorylation. Moreover, proximity ligation assays for phospho-4E-BP1 and eIF4E revealed different in situ interactions during interphase and mitosis. The eIF4E:eIF4G interaction was not inhibited but rather increased in mitotic cells, consistent with active translation initiation during mitosis. Phosphodefective substitution of 4E-BP1 at Ser-83 did not change global translation or individual mRNA translation profiles as measured by single-cell nascent protein synthesis and eIF4G RNA immunoprecipitation sequencing. Mitotic 5'-terminal oligopyrimidine RNA translation was active and, unlike interphase translation, resistant to mTOR inhibition. Our findings reveal the phosphorylation profiles of 4E-BP1 isoforms and their interactions with eIF4E throughout the cell cycle and indicate that 4E-BP1 does not specifically inhibit translation initiation during mitosis.

Keywords: PHAS-I; cell cycle; cyclin-dependent kinase 1 (CDK1); eukaryotic translation initiation; eukaryotic translation initiation factor 4E (eIF4E); eukaryotic translation initiation factor 4E-binding protein 1 (EIF4EBP1); eukaryotic translation initiation factor 4G (eIF4G); mammalian target of rapamycin (mTOR); mitosis; protein phosphorylation.


Conflict of interest statement

The authors declare that they have no conflicts of interest with the contents of this article

Figures

Figure 1.
Figure 1.
Cell cycle–dependent differences in phospho-4E-BP1 binding to eIF4E. A, FLAG-tagged eIF4E plasmids were transfected into HeLa cells. Transfected cells were split into two groups, 1) asynchronous and 2) synchronized at mitosis, by STLC treatment (5 μm; 16 h). Cell lysates were immunoprecipitated with anti-FLAG antibodies followed by immunoblotting with corresponding antibodies. The intensities of immunoprecipitated bands were quantitated (underlined values). The ratio of each eIF4E-bound 4E-BP1 band in total was calculated (right panel). Results are presented as mean ± S.D. Error bars represent S.D. The p value was calculated by t test with **, p < 0.01. At least three biological replicates were performed. Data shown here is a representative result. The immunoprecipitated 4E-BP1 and eIF4G levels are normalized to immunoprecipitated eIF4E band intensities. B, the membrane from A was stripped and reprobed with different phosphospecific 4E-BP1 antibodies. Total 4E-BP1 immunoblotting from A is shown for comparison. C, HeLa cells were split into asynchronous cells and STLC-treated (5 μm; 16 h) mitosis-enriched cells. Cell lysates were incubated with m7GTP cap pulldown beads. Cap-bound proteins were detected by immunoblotting with the designated antibodies. The 4E-BP1 EB-γ isoform is indicated by *, and the 4E-BP1 δ isoform is indicated by #. EB-γ and γ are two different and distinct 4E-BP1 phospho-isoforms.
Figure 2.
Figure 2.
Phosphodefective substitution of 4E-BP1 at Ser-83 eliminates the EB-γ isoform. WT 4E-BP1 (A) or 4E-BP1S83A mutant (B) was stably expressed in HeLa-4E-BP1–knockout (KO) cells. No endogenous 4E-BP1 is present in HeLa-4E-BP1–knockout cells (right). The eIF4E-transfected WT 4E-BP1 or 4E-BP1S83A mutant cells were then divided into asynchronous (Async.) cells and STLC-treated (5 μm; 16 h) mitosis-enriched cells. Cell lysates were immunoprecipitated with anti-HA antibodies followed by immunoblotting with the designated antibodies. The intensity of eIF4E-bound band was quantitated and annotated (underlined values). The immunoprecipitated 4E-BP1 and eIF4G level are normalized by immunoprecipitated eIF4E band intensity. C, WT 4E-BP1 or 4E-BP1S83A mutant was stably expressed in HeLa-4E-BP1–knockout cells. Cells were then divided into asynchronous cells and STLC-treated (5 μm; 16 h) mitosis-enriched cells. Cell lysates were incubated with m7GTP cap pulldown beads. Cap-bound proteins were detected by immunoblotting with the designated antibodies. 4E-BP1 EB-γ isoform is indicated by *, and 4E-BP1 δ isoform is indicated by #.
Figure 3.
Figure 3.
Phospho-4E-BP1 isoforms identified in mitosis. Cell lysates collected from asynchronous and mTOR inhibitor PP242-treated (5 μm; 4 h) HEK 293 cells (A) or STLC-arrested (5 μm; 16 h) HEK 293 cells treated with or without mTOR inhibitor PP242 (5 μm; 4 h) (B) were subjected to 2D-gel electrophoresis (isoelectric focusing at pH 3–6) followed by immunoblotting with different phosphospecific and total 4E-BP1 antibodies. Blue circles indicate canonical phospho-isoforms (20, 37), red circles indicate PP242-resistant isoforms of 4E-BP1 in mitosis, dashed-line circles indicate additional isoforms with weaker signals, and NP indicates nonphosphorylated 4E-BP1.
Figure 4.
Figure 4.
Two-dimensional profile of eIF4E-bound 4E-BP1 isoforms. A, HA-tagged eIF4E expression plasmids were transfected into HEK 293 cells. Transfected cells were divided into two groups, 1) asynchronous and 2) synchronized at mitosis, by STLC treatment (5 μm; 16 h). Cell lysates were immunoprecipitated for eIF4E with anti-HA antibodies. Cell lysates (Input) or immunoprecipitated elutes (IP) were subjected to 1D- and 2D-gel electrophoresis (isoelectric focusing at pH 3–6) followed by immunoblotting with total 4E-BP1 and p-4E-BP1T37/T46 antibodies. B, FLAG-tagged eIF4E plasmids were transfected into HeLa cells. Transfected cells were synchronized at mitosis with STLC (5 μm; 16 h). Cell lysates were immunoprecipitated with anti-FLAG antibodies. Cell lysates (Input) or immunoprecipitated elutes (IP) were subjected to 2D-gel electrophoresis (isoelectric focusing at pH 3–6) followed by immunoblotting with different phosphospecific and total 4E-BP1 antibodies. Blue circles indicate canonical phosphorylated 4E-BP1 isoforms (20, 37), red circles indicate PP242-resistant isoforms of 4E-BP1 in mitosis, dashed-line circles indicate isoforms with weaker signals, filled circles indicate eIF4E-bound 4E-BP1 isoforms, and NP indicates nonphosphorylated 4E-BP1. The 4E-BP1 EB-γ isoform is indicated by *.
Figure 5.
Figure 5.
Mitotic 4E-BP1:eIF4E and eIF4G:eIF4E interactions in vivo. HeLa cells were synchronized at the G2/M boundary with CDK1 inhibitor RO3306 treatment (10 μm; 16 h) and then released into mitosis by removing RO3306. After 60 min, cells were fixed and permeabilized. A, PLAs were performed using mouse eIF4E and rabbit phosphospecific or total 4E-BP1 antibodies. Cell nuclei were stained with DAPI (blue). PLA signal was obtained from rolling circle amplification (red). Images were captured by fluorescence microscope (40×). B, PLAs were performed using mouse eIF4E and rabbit eIF4G or eEF2 antibodies. Images were captured by fluorescence microscope (40×). White arrows indicate mitotic cells; yellow arrows indicate interphase cells. PLA signals were quantitated using ImageJ (particle counting). Results are presented as mean ± S.D. Error bars represent S.D. The p value was calculated by t test. NS indicates that the difference is not significant. ***, p < 0.001.
Figure 6.
Figure 6.
Phosphodefective substitution of 4E-BP1 at Ser-83 does not change global translation. A, illustration of the mitotic Click-iT labeling assay. WT 4E-BP1 or 4E-BP1S83A mutant HeLa cells were synchronized at the G2/M boundary with CDK1 inhibitor RO3306 treatment (10 μm; 16 h) and then released into mitosis by removing RO3306. After incubating with methionine-depleted medium for 15 min, cells were treated with HPG (50 μm) for 30 min. Cycloheximide (CHX; 100 μg/ml) was added at the same time to block new protein synthesis, functioning as the negative control. Cells were collected and fixed for subsequent staining. B, flow cytometry analysis of HPG incorporation (new protein synthesis). Cells were labeled with Alexa Fluor 488 azide using Click-iT HPG kits and stained with p-H3S10 antibody to label the mitotic cell population.
Figure 7.
Figure 7.
Active mitotic 5′-TOP translation in HeLa cells. A, HeLa cells were synchronized at the G2/M boundary with CDK1 inhibitor RO3306 treatment (10 μm; 16 h) and mTOR inhibitor PP242 treatment (5 μm; 1 h) and then released into mitosis by removing RO3306 (keeping PP242 in the medium). After incubating for 30 min, mitotic cells were collected by mitotic shake-off and lysed immediately for eIF4G RIP-Seq. The remaining cells were collected as postmitotic cells 3 h later and lysed for eIF4G RIP. The scatterplots summarize eIF4G RIP-Seq results for 5′-TOP genes. The x axis and y axis represent the abundance of transcripts in the input and eIF4G immunoprecipitated (IP) RNA, respectively. log2 cpm indicates log-transformed counts per million reads. The black line is the regression line for 5′-TOP gene dots (n = 80) based on the linear model. R2 indicates the fitness of the linear model. p and d (effect size based on F value) values for different comparisons (right) are calculated by Chow test (the null hypothesis asserts no difference in coefficients of linear models). B, eIF4G RIP-Seq was performed on mitotic shake-off–collected WT 4E-BP1 or 4E-BP1S83A mutant HeLa cells. Results for 5′-TOP genes are presented. C, -fold change (IP/input) values of 5′-TOP gene transcripts between WT 4E-BP1 and 4E-BP1S83A mutant HeLa cells are highly correlated. r indicates the Pearson correlation coefficient, and ρ indicates the Spearman rank correlation coefficient. The averaged result for three independent biological experiments is presented.

Similar articles

Cited by

References

    1. Hu C., Pang S., Kong X., Velleca M., and Lawrence J. C. Jr. (1994) Molecular cloning and tissue distribution of PHAS-I, an intracellular target for insulin and growth factors. Proc. Natl. Acad. Sci. U.S.A. 91, 3730–3734 10.1073/pnas.91.9.3730 - DOI - PMC - PubMed
    1. Pause A., Belsham G. J., Gingras A. C., Donzé O., Lin T. A., Lawrence J. C. Jr., and Sonenberg N. (1994) Insulin-dependent stimulation of protein synthesis by phosphorylation of a regulator of 5′-cap function. Nature 371, 762–767 10.1038/371762a0 - DOI - PubMed
    1. Lin T. A., Kong X., Haystead T. A., Pause A., Belsham G., Sonenberg N., and Lawrence J. C. Jr. (1994) PHAS-I as a link between mitogen-activated protein kinase and translation initiation. Science 266, 653–656 10.1126/science.7939721 - DOI - PubMed
    1. Grifo J. A., Tahara S. M., Morgan M. A., Shatkin A. J., and Merrick W. C. (1983) New initiation factor activity required for globin mRNA translation. J. Biol. Chem. 258, 5804–5810 - PubMed
    1. Haghighat A., and Sonenberg N. (1997) eIF4G dramatically enhances the binding of eIF4E to the mRNA 5′-cap structure. J. Biol. Chem. 272, 21677–21680 10.1074/jbc.272.35.21677 - DOI - PubMed

Publication types

MeSH terms