. 2019 Aug 2;294(31):11892-11909.
doi: 10.1074/jbc.RA118.005511. Epub 2019 Jun 14.

The neuropeptide GsMTx4 inhibits a mechanosensitive BK channel through the voltage-dependent modification specific to mechano-gating

Affiliations

The neuropeptide GsMTx4 inhibits a mechanosensitive BK channel through the voltage-dependent modification specific to mechano-gating

Hui Li et al. J Biol Chem. .

Abstract

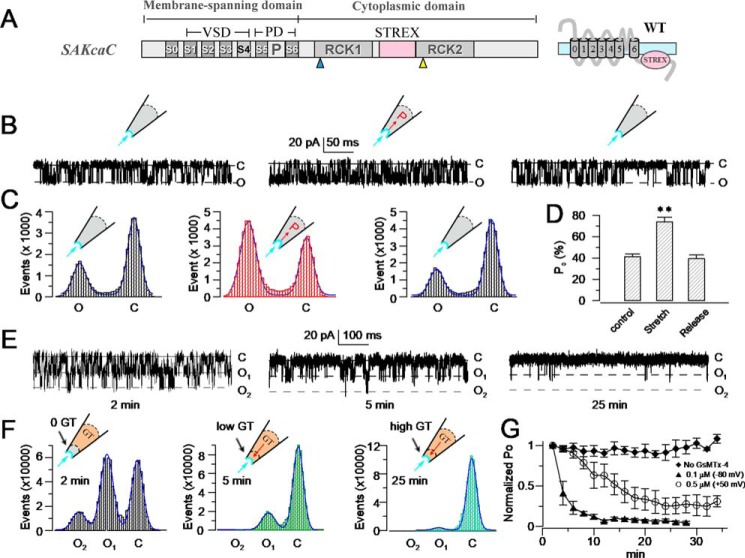
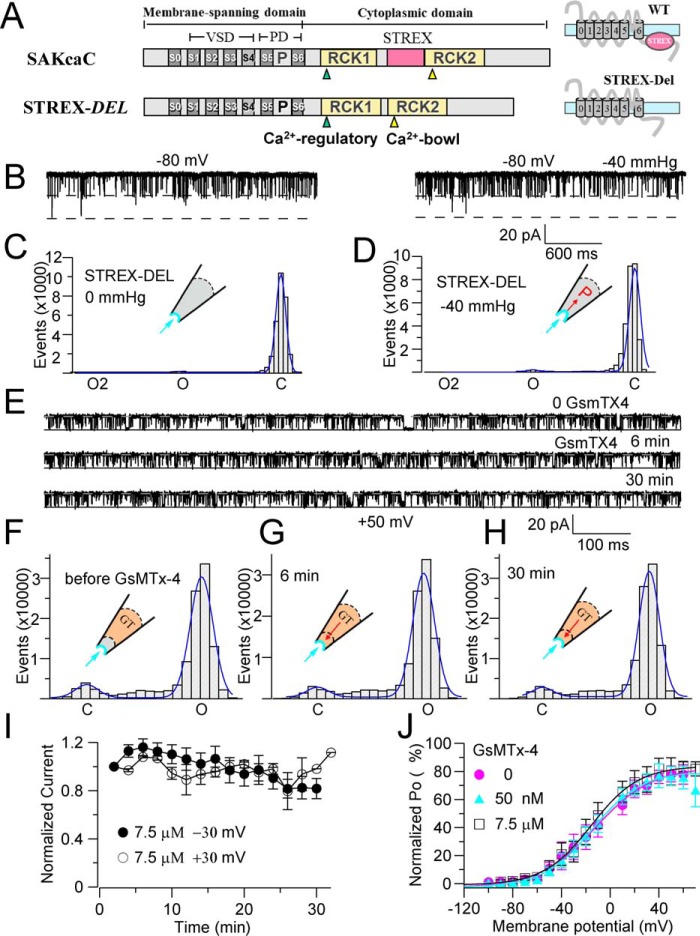
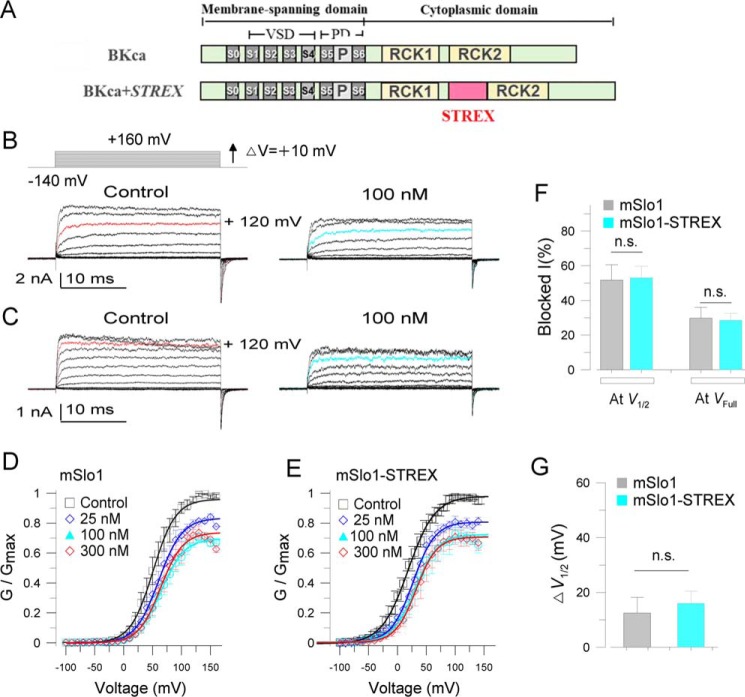
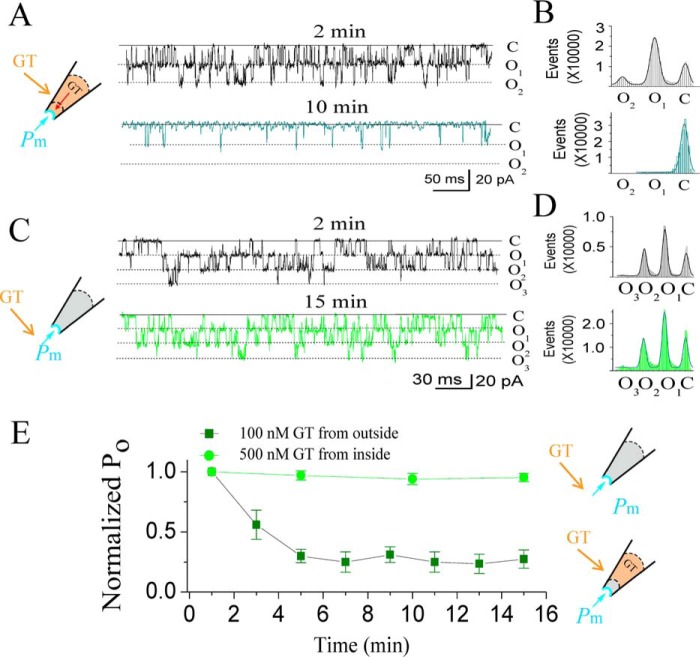
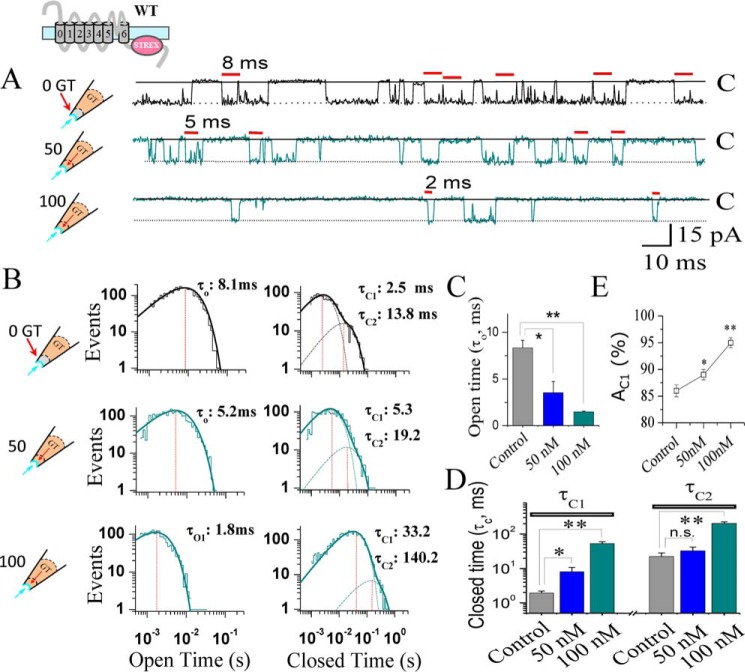
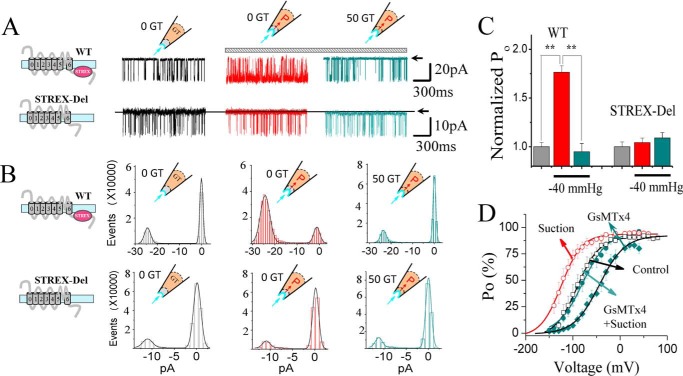
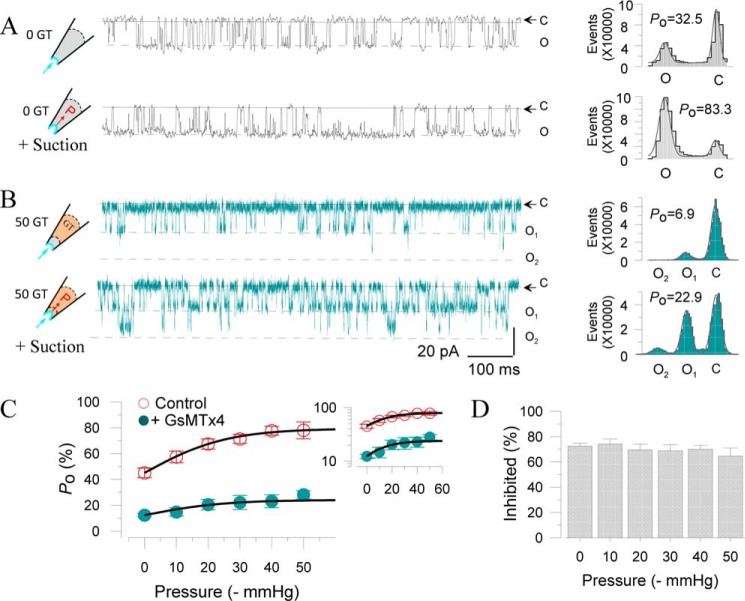
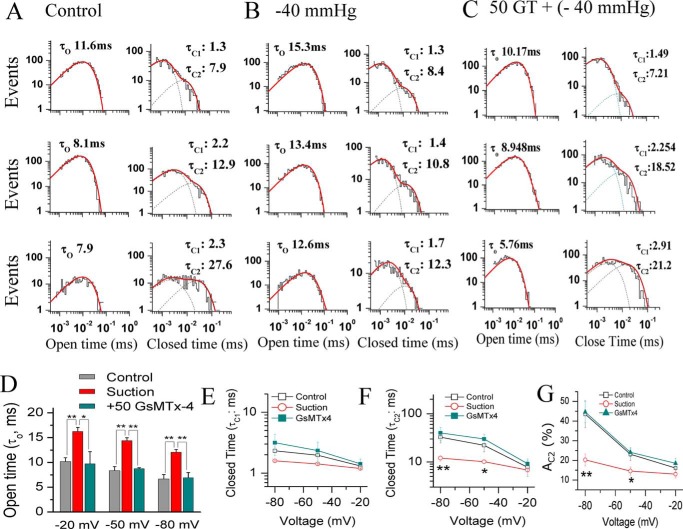
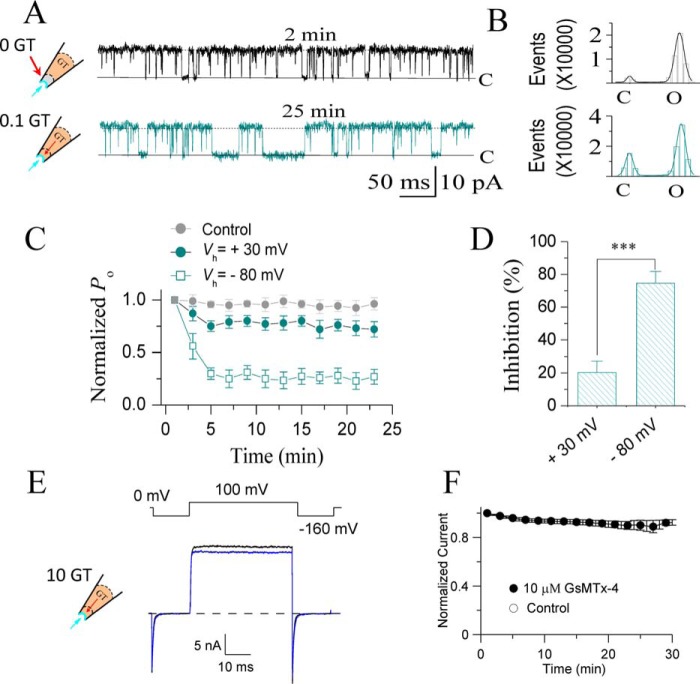
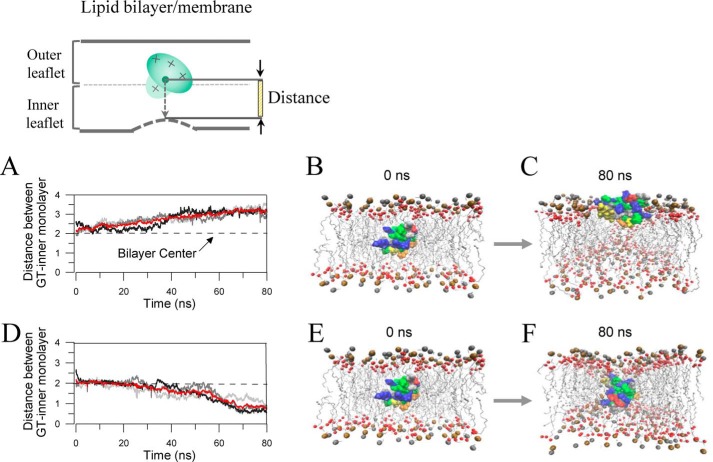
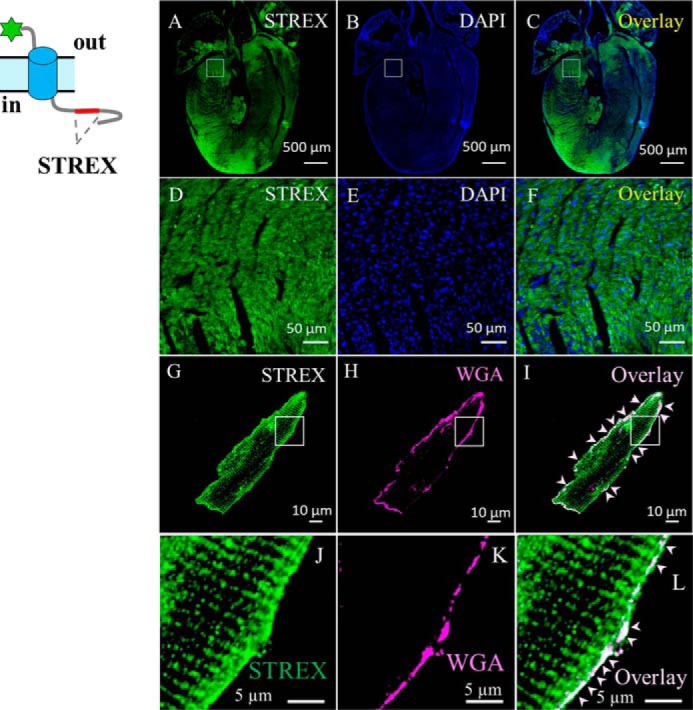
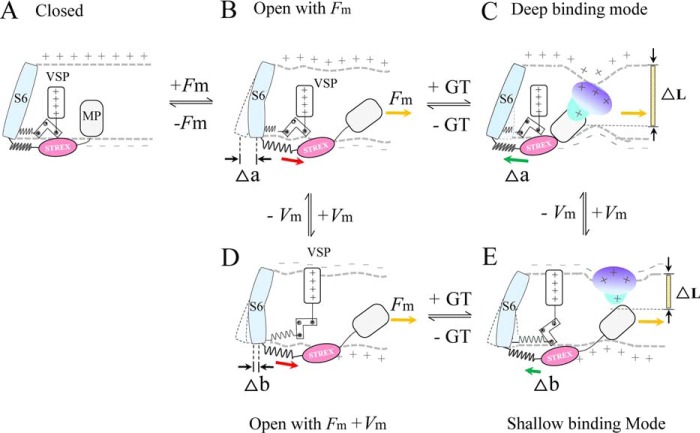
The cardiac mechanosensitive BK (Slo1) channels are gated by Ca2+, voltage, and membrane stretch. The neuropeptide GsMTx4 is a selective inhibitor of mechanosensitive (MS) channels. It has been reported to suppress stretch-induced cardiac fibrillation in the heart, but the mechanism underlying the specificity and even the targeting channel(s) in the heart remain elusive. Here, we report that GsMTx4 inhibits a stretch-activated BK channel (SAKcaC) in the heart through a modulation specific to mechano-gating. We show that membrane stretching increases while GsMTx4 decreases the open probability (Po) of SAKcaC. These effects were mostly abolished by the deletion of the STREX axis-regulated (STREX) exon located between RCK1 and RCK2 domains in BK channels. Single-channel kinetics analysis revealed that membrane stretch activates SAKcaC by prolonging the open-time duration (τO) and shortening the closed-time constant (τC). In contrast, GsMTx4 reversed the effects of membrane stretch, suggesting that GsMTx4 inhibits SAKcaC activity by interfering with mechano-gating of the channel. Moreover, GsMTx4 exerted stronger efficacy on SAKcaC under membrane-hyperpolarized/resting conditions. Molecular dynamics simulation study revealed that GsMTx4 appeared to have the ability to penetrate deeply within the bilayer, thus generating strong membrane deformation under the hyperpolarizing/resting conditions. Immunostaining results indicate that BK variants containing STREX are also expressed in mouse ventricular cardiomyocytes. Our results provide common mechanisms of peptide actions on MS channels and may give clues to therapeutic suppression of cardiac arrhythmias caused by excitatory currents through MS channels under hyper-mechanical stress in the heart.

Keywords: BK channel; arrhythmias; biophysics; gating; heart; inhibition mechanism; ion channel; kinetics; lipid–peptide interaction; mechanosensitive channel; molecular dynamics; patch clamp; peptides; single channel kinetics; structural model.


Conflict of interest statement

The authors declare that they have no conflicts of interest with the contents of this article

Figures

Figure 1.
Figure 1.
GsMTx4 inhibits SAKcaC from extracellular side of the cell membrane. A, schematic of SAKCaC. The transmembrane domain (S0–S6) contains a VSD (S1–S4) and a PD (P5–P6). The cytoplasmic domain contains two RCK (RCK1 and RCK2) domains and an extra exon STREX (pink) located between the RCK1 and RCK2 domains. B, sample traces illustrating the mechanosensitivity of SAKcaC. Left, before suction; middle, during suction (−40 mm Hg); right, after suction releasing. C, total histogram events of channel open (O) and closed (C) states corresponding to B were fitted to Gaussian functions. D, statistical comparison of Po for control (before suction), suction (−40 mm Hg), and release (without suction) conditions on the cell membrane (n ≥6). Data show that Po was significantly increased with −40 mm Hg suction (p < 0.01) and was reversed by release. E, typical single channel current traces showing the inhibitory effect of GsMTx4 on SAKcaC at the time points indicated; 100 nm GsMTx4 was back-filled in the pipette. F, total histogram events of single channel open (O) and closed (C) from E were fitted by Gaussian functions. G, time courses of normalized open probability (Po/Po (control)) for control (without GsMTx4) and during GsMTx4 diffusion to the patch membranes. The GsMTx4 concentrations used were 0.1 μm (Vm = −80 mV) and 0.5 μm (Vm +50 mV) as indicated (n = 4–8). Symbols: C beside traces indicates the channel closed levels; O1 and O2 represent the levels of two channels opening. Time points in E, F, and G were measured from the onset of backfilling (see “Experimental procedures”). SAKcaCs were recorded from chick ventricular myocytes. MPs in B and E were held at −80 mV. [Ca2+]i applied in the bath was 1 mm. **, p < 0.01.
Figure 2.
Figure 2.
STREX-deleted mutation (STREX-del) abolishes both the mechanical and GsMTx4 sensitivities of SAKcaC. A, linear map of STREX-del channel, in which the STREX-exon is deleted from wildtype (WT) SAKcaC. B, sample traces illustrating the loss of nearly all mechanosensitivity of the STRETX-del channel. Left, before suction; right, under suction (−40 mm Hg). MP was held at −80 mV. C and D, total histogram events of channel open (O) and closed (C) states corresponding to B were fitted to Gaussian functions. Each number in the y axis is times 1000. Po values are 1.9 (C) and 1.8 (D), respectively. E, sample traces showing the effect of GsMTx4 on the STREX-del channel at the time points indicated following backfilling. 7.5 μm GsMTx4 was applied in the pipette. Time was measured from the onset of backfilling. MP was held at +50 mV. F–H, total amplitude histogram events of channel open (O) and closed (C) states corresponding to E were fitted to Gaussian functions, showing the time-dependent effect of GsMTx4. Po values are 0.90, 0.92, and 0.93, respectively. I, time courses for the changes in the normalized Po during diffusion of GsMTx4 (7.5 μm) to the patch membrane following backfilling at −30 and +30 mV, respectively (n = 4–6). J, PoV relationships for STREX-del channels with 0 and 50 nm and 7.5 μm GsMTx4 back-filled in the pipette. The solid lines are fittings to the standard Boltzmann function: Po = Po (max)/{1 + exp(−(VmV½)/K)}, where V½ represents the voltage required for half of the maximum channel opening, and K represents the slope factor. Data show that even a saturation concentration of GsMTx4 had no effect on STREX-del mutation channel in the range of voltages examined. STREX-del mutation currents were recorded from the CHO-expressing system.
Figure 3.
Figure 3.
STREX insert does not alter the effects of voltage-sensor toxin (VsTx3) on BK channels. A, linear map for mSlo1 + STREX (mSlo1–STREX) chimeric channel, in which the STREX-exon was inserted between the RCK1 and RCK2 domains in the BK (mSlo1) C terminus. B and C, sample current traces for mSlo1 (A) and mSlo1–STREX chimera (C) channels, showing the effects of 100 nm VsTx3. The inset at top left shows the voltage protocol used for current recordings. For clarity, the currents shown are at the voltages with a 20-mV increase from −140 to +160 mV. For easy comparison, the red-colored traces on the left set highlight the currents activated at +120 mV, and cyan-colored traces at right show those in the presence of 100 nm VsTx3 applied from the extracellular side of cell membrane. D and E, normalized G-V curves for mSlo1 (D) and mSlo1–STREX (E) channels at the concentrations of VsTx3 as indicated. The solid lines are fits to the Boltzmann equation (see “Experimental procedures”). The V½ obtained for mSlo1 is 54.1 ± 7.3 mV for control, 61.1 ± 9.2 mV for 25 nm, 66.5 ± 7.0 mV for 100 nm, and 64.9 ± 6.6 mV for 300 nm VsTx3 applied from the extracellular side. The V½ obtained for mSlo1–STREX chimera are 19.9 ± 3.5 mV for control, 33.5 ± 2.1 mV for 25 nm, 35.9 ± 7.2 mV for 100 nm, and 37.3 ± 6.8 mV for 300 nm VsTx3. F, summarized blocked currents (blocked I) for the effects of 100 nm VsTx3 on mSlo1 and mSlo1–STREX as indicated. The blocking effects were compared at the voltages near V½ (at +50 mV for mSlo1 and at +20 mV for chimera) or at 120 mV, where both channels were fully opened. Blocked I = (1 −IVsTx3/IControl) × 100%. G, comparisons of the effects of 100 nm VsTx3 on the voltage-dependent activation between mSlo1 and mSlo1–STREX. ΔV½ = V½(VsTx3)V½(Control). n.s., not significant. n = 4–7. mSlo1 and mSlo1–STREX currents were recorded from Xenopus oocytes with outside-out patch configuration. VsTx3 was applied from bath (the extracellular side of the cell membrane).
Figure 4.
Figure 4.
GsMTx4 does not show significant effect on SAKcaC when applied from the intracellular side of the channel. A, typical single channel current traces showing strong inhibition by 100 nm GsMTx4 on SAKcaCs applied from the extracellular side of the cell membrane. Traces were obtained at the time points as indicated following the onset of back-filling. The cartoon on the left shows the back-filled GsMTx4 (GT) in the pipette with the tension (Pm) automatically formed by the excised inside-out patch configuration. B, total amplitude histogram events of channels open (O1 and O2) and closed (C) states corresponding to A were fitted to Gaussian functions. Po values were 0.48 (upper panel) and 0.05 (lower panel), respectively. C, typical single channel current traces showing the effect of GsMTx4 from the intracellular side of the cell membrane on SAKcaCs. Traces were obtained at the time points as indicated following the onset of back-filling. The cartoon on the left represents that GT (GsMTx4) was directly applied from the bath under the tension (Pm) automatically formed by membrane deformation. GsMTx4 concentration applied from bath was 500 nm. D, total amplitude histogram events of channels open (O1, O2, and O3) and closed (C) states corresponding to C were fitted to Gaussian functions. Po values are 0.42 (upper panel) and 0.40 (lower panel), respectively. E, time courses of normalized Po (Po/Po(control)) during GsMTx4 diffusion to the patch membrane upon the onset of backfilling in the pipette (olive squares) or perfusion from bath (green squares). The time points were measured from the onset of back-filling from the extracellular side of the cell membrane (olive squares) or application from bath (green squares). GsMTx4 concentrations used were 100 nm (olive squares) for backfilling or 500 nm (green circles) applied from the bath (n = 6–8). GsMTx4 concentrations used were 100 nm in A and B and 500 nm in C and D, respectively. MPs were held at −80 mV in all experiments. SAKcaCs were recorded from the CHO-expressing system.
Figure 5.
Figure 5.
GsMTx4 inhibits SAKcaC activity through abbreviating the open-time and prolonging the closed-time constants in a dose-dependent manner. A, typical single channel current traces showing the detailed gating properties of SAKcaC modulated by GsMTx4. Red bars above indicate the most frequent opening durations for control with 0 nm (upper panel), 50 nm (middle panel), and 100 nm (lower panel) GT (GsMTx4) applied from the extracellular side of the cell membrane. B, histograms of SAKcaC open- (left) or closed (right)-times constants corresponding to A are presented. Dashed lines in the right panels represent the distributions of the closed-time components (τC1 and τC2) determined by the likelihood ratio test (see “Experimental procedures”). The vertical dashed lines indicate the peaks of one open- (τO, left) or two closed (τC1 and τC2, right)-time components. The open-time constants (τO) obtained were 8.1 ms for control (upper panel, left), 5.2 ms for 50 nm GsMTx4 (middle panel, left), and 1.8 ms for 100 nm GsMTx4 (lower panel, left). The two closed-time constants (τC1 and τC2) were 2.5 and 13.8 ms for control (upper panel, right), 5.3 and 19.2 ms for 50 GT (middle panel, right), and 33.2 and 140.2 ms for 100 nm GT (lower panel, right), respectively. C, statistical comparison of open-time constants (τO) at the different conditions as indicated. D, statistical comparison for the two closed-time constants, τC1 (left) and τC2 (right), at different conditions as indicated. E, summarized relative weight area (AC1 (%)) showing the percentage of the fast closed-time component (τC1): AC1 (%) = (AC1/(AC1+ AC2)) × 100%. Data for GsMTx4 effects were obtained 25 min later following the onset of back-filling when drugs were completely diffused to the cell membrane. MPs were held at −50 mV. Data points at each condition represent at least three determinations (n >3); *, p < 0.01; **, p < 0.001; n.s, not significant. SAKcaCs were recorded from isolated chick ventricular myocytes.
Figure 6.
Figure 6.
GsMTx4 inhibits SAKcaC activation induced by membrane stretch without changing voltage dependence. A, typical current traces showing the effects of membrane stretch (−40 mm Hg, middle panel) and 50 nm GT (with continuous membrane stretching at −40 mm Hg on the patch membrane, right) for SAKca (upper panel) and STREX-del mutant (lower panel) channels. MPs were held at −90 mV for SAKcaC and −40 mV for STREX-del, where Po values for both channels are similar, to minimize the effects of membrane potentials on channel activation. Data show that SAKcaC is activated by membrane stretch (−40 mm Hg) and inhibited by GT, whereas GT has no effect on the STREX-del mutant channel. B, total amplitude histogram events corresponding to A were fitted by Gaussian functions for SAKcaC (upper panel) and STREX-del mutation (lower panel) channels. The horizontal bar in A (above) represents the continuous negative pressure (−40 mm Hg) applied on the patch membrane. C, statistical comparison of normalized Po (Po/Po(control)) at the conditions indicated for SAKcaC wildtype (WT, left) or STREX-del mutation (right) channels. N >6; D, PoV relationships for SAKcaC under the conditions of control (□, n = 8), suction (○, −40 mm Hg n = 8), or GT + suction (●, 50 nm GT with a membrane stretch of −40 mm Hg, n = 6). For comparisons, the PoV relationship under the condition of 50 nm GT alone (without membrane stretch) is also shown (♦, 50 nm GT). The solid lines are fittings to the standard Boltzmann function: Po = Po (max)/{1 + exp(−(VmV½)/K)}, where V½ represents the voltage required for half of the maximum channel opening, and K represents the slope factor. The V½ and K−1 obtained were: −88.6 ± 0.9 mV and 22.7 ± 0.9 for control (n = 8), −122.8 ± 2.8 mV and 21.2 ± 1.0 for suction (−40 mm Hg), −81.4 ± 1.7 mV and 24.5 ± 1.5 for GT (with continuous suction), and 39.8 ± 1.9 mV and 22.3 ± 1.7 for GT only (without suction). **, p < 0.001. SAKcaCs was recorded from native chick ventricular myocytes. STREX-del channels were recorded from CHO-expressing system.
Figure 7.
Figure 7.
GsMTx4 does not control channel activation through changes in membrane tension. A, left, typical single channel current traces showing the effect of membrane stretch (−40 mm Hg) on SAKcaC current. Right, total amplitude histogram events of channels open (O) and closed (C) states corresponding to left were fitted by Gaussian functions. Po values were 32.5 (upper panel) and 83.3 (lower panel), respectively. B, same as in A (with −40 mm Hg) but with 50 nm GsMTx4 back-filled in the pipette. Po values were 6.9 (upper panel) and 22.9 (lower panel), respectively. C, Popressure (−mm Hg) relationships for SAKcaC in the absence (○) or presence of 50 nm GsMTx4 (●) applied from the extracellular side. The inset represents y axis in log scale. D, statistical comparison of the inhibited (%) by GsMTx4 on SAKcaC under different membrane pressures as indicated. Inhibited (%) = ((Po(control)Po GsMTx4))/Po(control)) × 100 (%) under different pressure conditions. Note: no significant difference was observed on the inhibited currents. SAKcaC was expressed in CHO cells. Single channel currents were obtained at −80 mV with 1 mm [Ca2+]i in the intracellular side. n = 4–8.
Figure 8.
Figure 8.
Changes in kinetic parameters of mechano-gating by suction are consistently antagonized by GsMTx4. A–C, histograms of SAKcaC open (left) or closed (right) times for control (A), suction (B, −40 mm Hg), and 50 nm GsMTx4 (with continuous suction of −40 mm Hg) are presented. The membrane potentials were held at −20 mV (upper panel), −50 mV (middle panel), and −80 mV (lower panel), respectively. Dashed lines at right in each panel represent the distributions of the closed-time components (τC1 and τC2) determined by the likelihood ratio test (see “Experimental procedures”). D, statistical comparison of the open-time constants (τO) among control, suction, and GsMTx4 with continuous suction at the voltages as indicated. E and F, statistical comparison of the closed-time constants τC1 (E) and τC2 (F) for control, suction, and GsMTx4 with continuous suction on the cell membrane. G, summarized relative weight area (AC1(%)) showing the percentage of the first closed component τC1. AC1 (%) = (AC1/(AC1 + AC2)) × 100%. The histograms in C were obtained from the single channel traces 25 min later following the back-filling when GsMTx4 was completely diffused to the patch membrane. Data points in D–G at each membrane potential represent at least three determinations. *, p < 0.05; **, p < 0.01. SAKcaCs were recorded from isolated chick ventricular myocytes.
Figure 9.
Figure 9.
Membrane depolarization reduced the inhibitory effect of GsMTx4 on SAKcaCs. A, typical single channel current traces showing the effect of 100 nm GsMTx4 on SAKcaC at a depolarized voltage (+30 mV). Traces were obtained at the time points as indicated following the onset of back-filling. The cartoons on the left show that GsMTx4 was applied from the pipette with tension (Pm) automatically formed by membrane deformation upon the excised inside-out patch-clamp configuration. B, total amplitude histogram events of channels open (O) and closed (C) states corresponding to A were fitted by Gaussian functions. Po values were 93.1 (upper panel) and 72.4 (lower panel), respectively. C, time courses of normalized Po (Po/Po (control)) during GsMTx4 diffusion to the patch membranes upon backfilling in the pipette. Vm was held at +30 mV or −80 mV as indicated. D, statistical comparison of the inhibition effects (%) for GsMTx4 between depolarized (+30 mV) versus hyperpolarized (−80 mV) potentials. E, macroscopic currents recorded for BK (mSlo1) channels in the absence (black) or presence (blue) of GsMTx4 back-filled in the pipette. F, time courses for normalized BK currents during GsMTx4 diffusion to the patch membranes. The extracellular GsMTx4 concentrations used were 100 nm for SAKcaC (A–D) and 10 μm for mSlo1 (E and F). [Ca2+]i was 1 mm for SAKcaC (A–D) and 300 μm for mSlo1 (E and F). The time points were measured from the onset of back-filling from the extracellular side of the cell membrane. n ≥6. ***, p < 0.001. SAKcaCs currents (A–D) were recorded from CHO-expressing system, and mSlo1 (E and F) was injected in Xenopus oocytes.
Figure 10.
Figure 10.
MD simulations revealed two lipid–peptide interaction modes corresponding to depolarized versus hyperpolarized/resting conditions. A, trajectories of the GsMTx4 com (center) under depolarized state. Each gray curve corresponds to an independent simulation, showing the distance between GsMTx4 com and the inner monolayer. The red curve represents the averaged position of GsMTx4 com to the inner monolayer from three independent runs. B and C, shallow peptide–lipid interaction mode under depolarized conditions. Snapshots were taken from representative trajectories at the indicated time points of the runs in A. D, same as in A, but under the hyperpolarized state. The red curve represents the averaged position of GsMTx4 com from three independent runs. E and F, deep peptide–lipid interaction mode under hyperpolarized state. Snapshots were taken from representative trajectories at the indicated time points of the runs in D. The initial position of GsMTx4 is the same as that under depolarized condition (as in B). The inset at top illustrates the method of the distance measurement between GsMTx4 com and inner monolayer measured in A and D. Ocher spheres represent phosphorus atoms, and the red represents carbonyl oxygen atoms; GsMTx4 is represented in surface structure. Basic residues (Arg and Lys) are blue, and acidic residues (Asp and Glu) are red. Trp residues are orange; Phe residues are yellow, and other hydrophobic residues (Ala, Cys, Ile, Leu, Met, Pro, and Val) are green. For clarity, water molecules and chloride ions are not shown.
Figure 11.
Figure 11.
BK variants containing STREX-exon are located at the plasma membrane of mouse cardiac myocytes. A and B, confocal images of mouse heart section labeled with anti-STREX (green, A), which is specific against STREX between RCK1 and RCK2 domains in the BK channel, or DAPI (blue, B); C, overlay of A and B. D–F, zoom-out of the squared regions in A–C, respectively. G and H, ventricular myocytes loaded with plasma membrane marker (WGA), fixed, permeabilized, and labeled with anti-STREX. I, overlay of G and H, showing location of BK variants containing STREX-exons in BK channels. J–L, amplification of the squared regions as indicated in G–I. Cartoon at left shows BK variant with the tag at the N terminus. For clarity, white arrows in I and L highlight the surface expression of BK variants containing STREX-exon in the BK C terminus.
Figure 12.
Figure 12.
Proposed SAKcaC gating modes modulated by membrane stretch and peptide GsMTx4 primarily based on the spring model proposed for BK and SAKcaCs (24, 33). A and B, membrane force (Fm) first pulls SAKcaC gate opening through STREX and MP (33). C, deep inhibition mode: under hyperpolarized/resting conditions, GsMTx4 was driven down (inward) along the electrochemical gradients upon partitioning into the lipid bilayer. It was placed at a deep position to interact with both inner and outer monolayers and induce strong membrane deformation as observed in the MD simulation. Thus, GsMTx4 has the ability to push STREX back strongly through MP, to close the channel gate firmly. D, membrane depolarization drives VSP upward, which generates pulling force to further open channel gate (from B). E, shallow inhibition mode: under the depolarization condition, GsMTx4 was driven back (move outward) by membrane potential. Alternatively, the outward electrostatic forces may also prevent the absorption of GsMTx4 from the extracellular side into the lipid bilayer. In either case, GsMTx4 interacts with the outer monolayer only, and induces weak membrane deformation as observed in the MD simulation. The SAKcaC gating mode is drawn based on BK gating mode (24, 27, 33, 35), in which VSP and STREX-exon are both connected to the channel gate.

Similar articles

Cited by

References

    1. Eyckmans J., Boudou T., Yu X., and Chen C. S. (2011) A hitchhiker's guide to mechanobiology. Dev. Cell 21, 35–47 10.1016/j.devcel.2011.06.015 - DOI - PMC - PubMed
    1. Tyler W. J. (2012) The mechanobiology of brain function. Nat. Rev. Neurosci. 13, 867–878 10.1038/nrn3383 - DOI - PubMed
    1. Gu Y., and Gu C. (2014) Physiological and pathological functions of mechanosensitive ion channels. Mol. Neurobiol. 50, 339–347 10.1007/s12035-014-8654-4 - DOI - PMC - PubMed
    1. Kocer A. (2015) Mechanisms of mechanosensing–mechanosensitive channels, function and re-engineering. Curr. Opin. Chem. Biol. 29, 120–127 10.1016/j.cbpa.2015.10.006 - DOI - PubMed
    1. He B. H., Christin M., Mouchbahani-Constance S., Davidova A., and Sharif-Naeini R. (2017) Mechanosensitive ion channels in articular nociceptors drive mechanical allodynia in osteoarthritis. Osteoarthritis Cartilage 25, 2091–2099 10.1016/j.joca.2017.08.012 - DOI - PubMed

Publication types

MeSH terms

Substances

Associated data

LinkOut - more resources