. 2019 Jun 14;10(1):2624.
doi: 10.1038/s41467-019-10206-z.

A global assessment of marine heatwaves and their drivers

Affiliations

A global assessment of marine heatwaves and their drivers

Neil J Holbrook et al. Nat Commun. .

Abstract

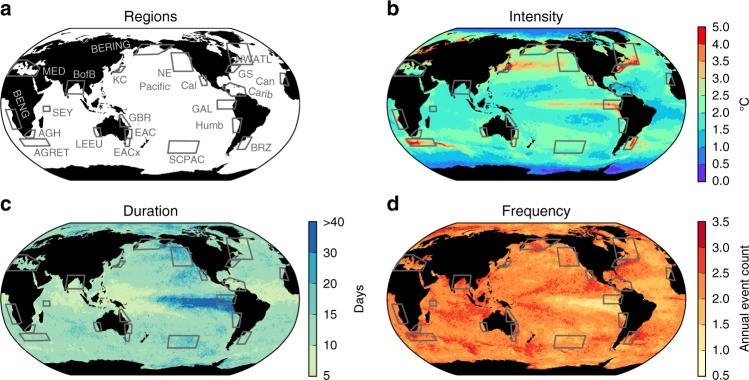
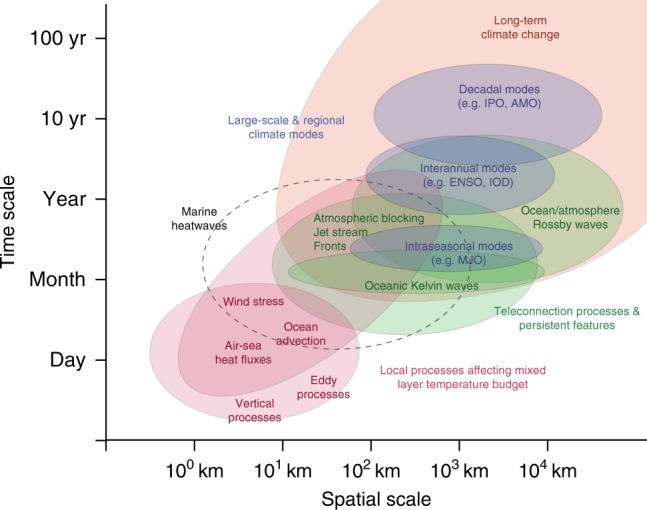
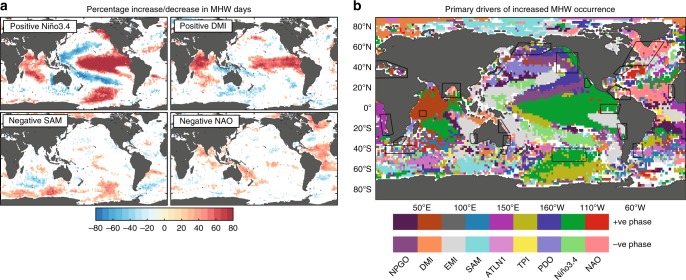
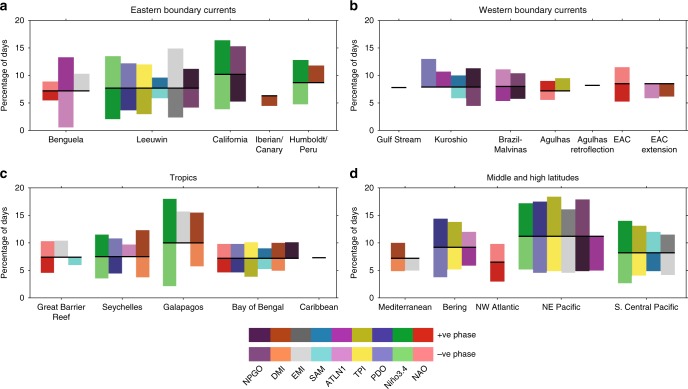
Marine heatwaves (MHWs) can cause devastating impacts to marine life. Despite the serious consequences of MHWs, our understanding of their drivers is largely based on isolated case studies rather than any systematic unifying assessment. Here we provide the first global assessment under a consistent framework by combining a confidence assessment of the historical refereed literature from 1950 to February 2016, together with the analysis of MHWs determined from daily satellite sea surface temperatures from 1982-2016, to identify the important local processes, large-scale climate modes and teleconnections that are associated with MHWs regionally. Clear patterns emerge, including coherent relationships between enhanced or suppressed MHW occurrences with the dominant climate modes across most regions of the globe - an important exception being western boundary current regions where reports of MHW events are few and ocean-climate relationships are complex. These results provide a global baseline for future MHW process and prediction studies.


Conflict of interest statement

The authors declare no competing interests.

Figures

Fig. 1
Fig. 1
Global MHW characteristics and case-study regions. 34-year (1982–2015) average properties of MHWs based on application of the MHW definition to daily sea surface temperatures from the NOAA OI SST V2 dataset across the globe. a A total of 22 case-study regions investigated. The spatial distribution of MHW properties (0.25° × 0.25° resolution) here includes b annual mean intensity (°C), c duration (days), and d frequency (event counts per year). The four ocean-climate zones are the tropical latitudes, middle and high latitudes, western boundary currents and their extensions (WBCs), and eastern boundary currents (EBCs). These case-study regions are listed as follows: tropical latitudes [Great Barrier Reef (GBR); Seychelles Islands (SEY); Galapagos Islands (GAL); Bay of Bengal (BofB); Caribbean Sea (Carib)], middle and high latitudes [Mediterranean Sea (MED); Bering Sea (BERING); northwest Atlantic (NWATL); northeast Pacific (NE Pacific); south central Pacific (SCPAC)], WBCs [Gulf Stream (GS); Kuroshio Current (KC); Brazil-Malvinas Confluence (BRZ); Agulhas Current (AGH); Agulhas Retroflection (AGRET); East Australian Current (EAC); East Australian Current Extension (EACx)], and EBCs [Benguela Current (BENG); Leeuwin Current (LEEU); Baja California (Cal); Iberian/Canary Current (Can); Humboldt/Peru Current (Humb)]
Fig. 2
Fig. 2
Space and time scales of characteristic MHW drivers. Schematic identifying the characteristic marine heatwave drivers and their relevant space and time scales. Included are drivers that force locally (through processes affecting the mixed layer temperature budget (red)), and those that act to modulate MHW occurrences from regional or remote sources (climate modes (blue)) via atmospheric and/or oceanic teleconnection processes (green). Each driver is mapped to their relevant time and spatial scales identified from a synthesis of information contained in the literature. The black dashed line outlines the typical scales for MHWs
Fig. 3
Fig. 3
Links between enhanced or suppressed MHW occurrences and climate modes. a The percentage of days in which MHWs increase or decrease during a phase of four climate modes. b Summary schematic showing the locations where climate modes (and phases) have the greatest significant impact on enhancing or suppressing the number of MHW days (see Methods). The percentage of enhancement or suppression for individual climate modes used to construct this schematic are shown in Supplementary Figs. 7–15. When there are no statistically significant relationships between known climate modes and MHW occurrences, the areas are shaded in white
Fig. 4
Fig. 4
Percentage change in MHW occurrences linked to climate mode phase. The percentage of days experiencing MHWs during positive or negative phases of a climate mode, for each case-study region. The black horizontal line indicates the median percentage over the full period irrespective of the phase of the modes. Values above (below) this bar indicate the climate mode phase enhances (suppresses) the likelihood of MHW occurrences. Values are only shown when significant at the 5% level (based on a Monte Carlo sampling, see Methods). The median deviates from 10% because the MHW definition includes a 5-day threshold and the climatological period used for calculation of MHWs (1982–2012) differs from the full length of the analyzed time series (1982–2016). Climate modes associated with the various indices are described in the Methods (“Climate indices as metrics for climate mode drivers”)

Comment in

References

    1. Garrabou J, et al. Mass mortality in Northwestern Mediterranean rocky benthic communities: effects of the 2003 heat wave. Glob. Chang. Biol. 2009;15:1090–1103.
    1. Wernberg T, et al. An extreme climatic event alters marine ecosystem structure in a global biodiversity hotspot. Nat. Clim. Chang. 2013;3:78–82. doi: 10.1038/nclimate1627. - DOI
    1. Pearce AF, Feng M. The rise and fall of the ‘marine heat wave’ off Western Australia during the summer of 2010/2011. J. Mar. Syst. 2013;111–112:139–156. doi: 10.1016/j.jmarsys.2012.10.009. - DOI
    1. Mills KE, et al. Fisheries management in a changing climate lessons from the 2012 ocean heat wave in the Northwest Atlantic. Oceanography. 2013;26:191–195. doi: 10.5670/oceanog.2013.27. - DOI
    1. Caputi N, et al. Management adaptation of invertebrate fisheries to an extreme marine heat wave event at a global warming hot spot. Ecol. Evol. 2016;6:3583–3593. doi: 10.1002/ece3.2137. - DOI - PMC - PubMed

Publication types