. 2019 Jun 14;10(1):2651.
doi: 10.1038/s41467-019-10546-w.

Convergent eusocial evolution is based on a shared reproductive groundplan plus lineage-specific plastic genes

Affiliations

Convergent eusocial evolution is based on a shared reproductive groundplan plus lineage-specific plastic genes

Michael R Warner et al. Nat Commun. .

Abstract

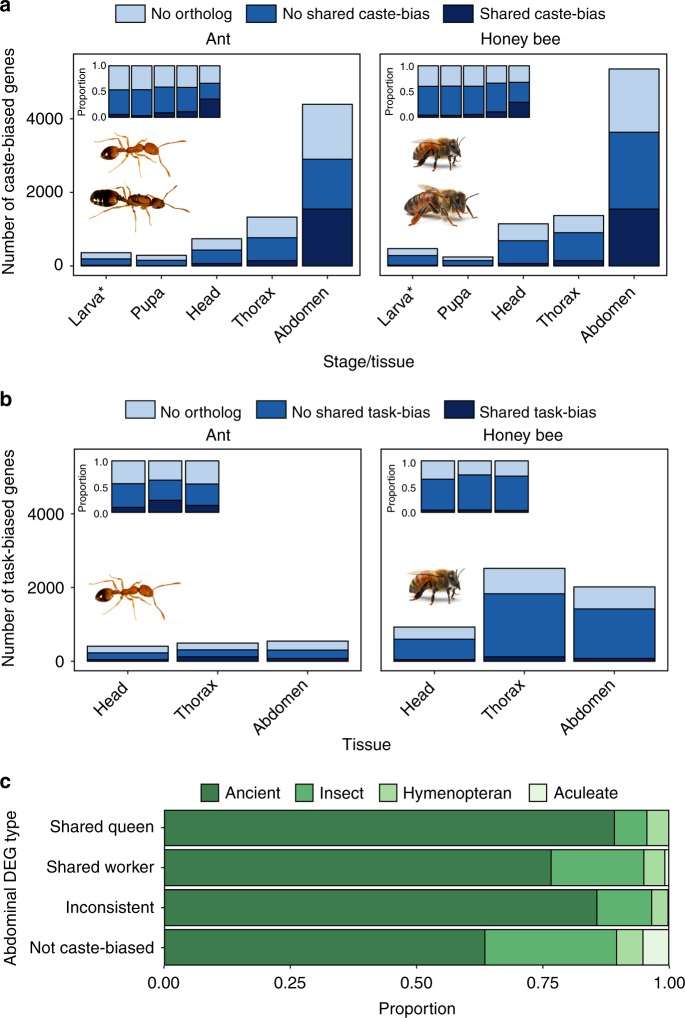
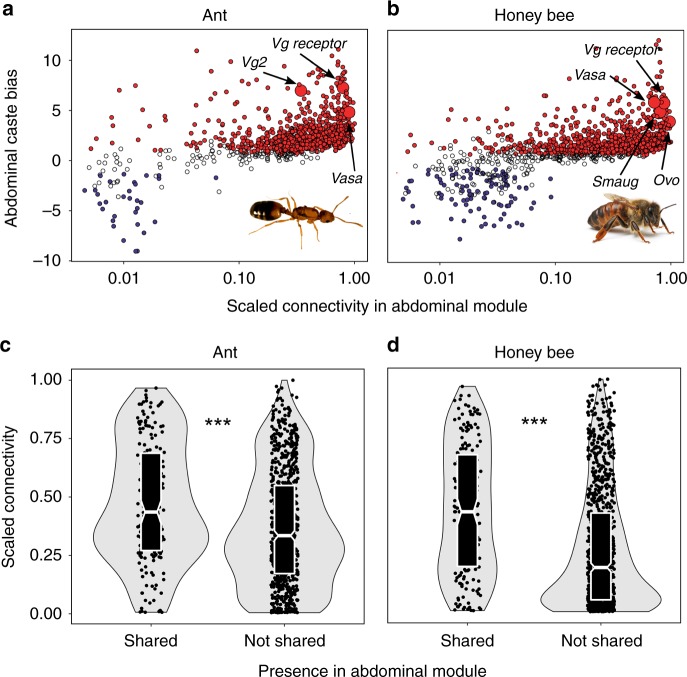
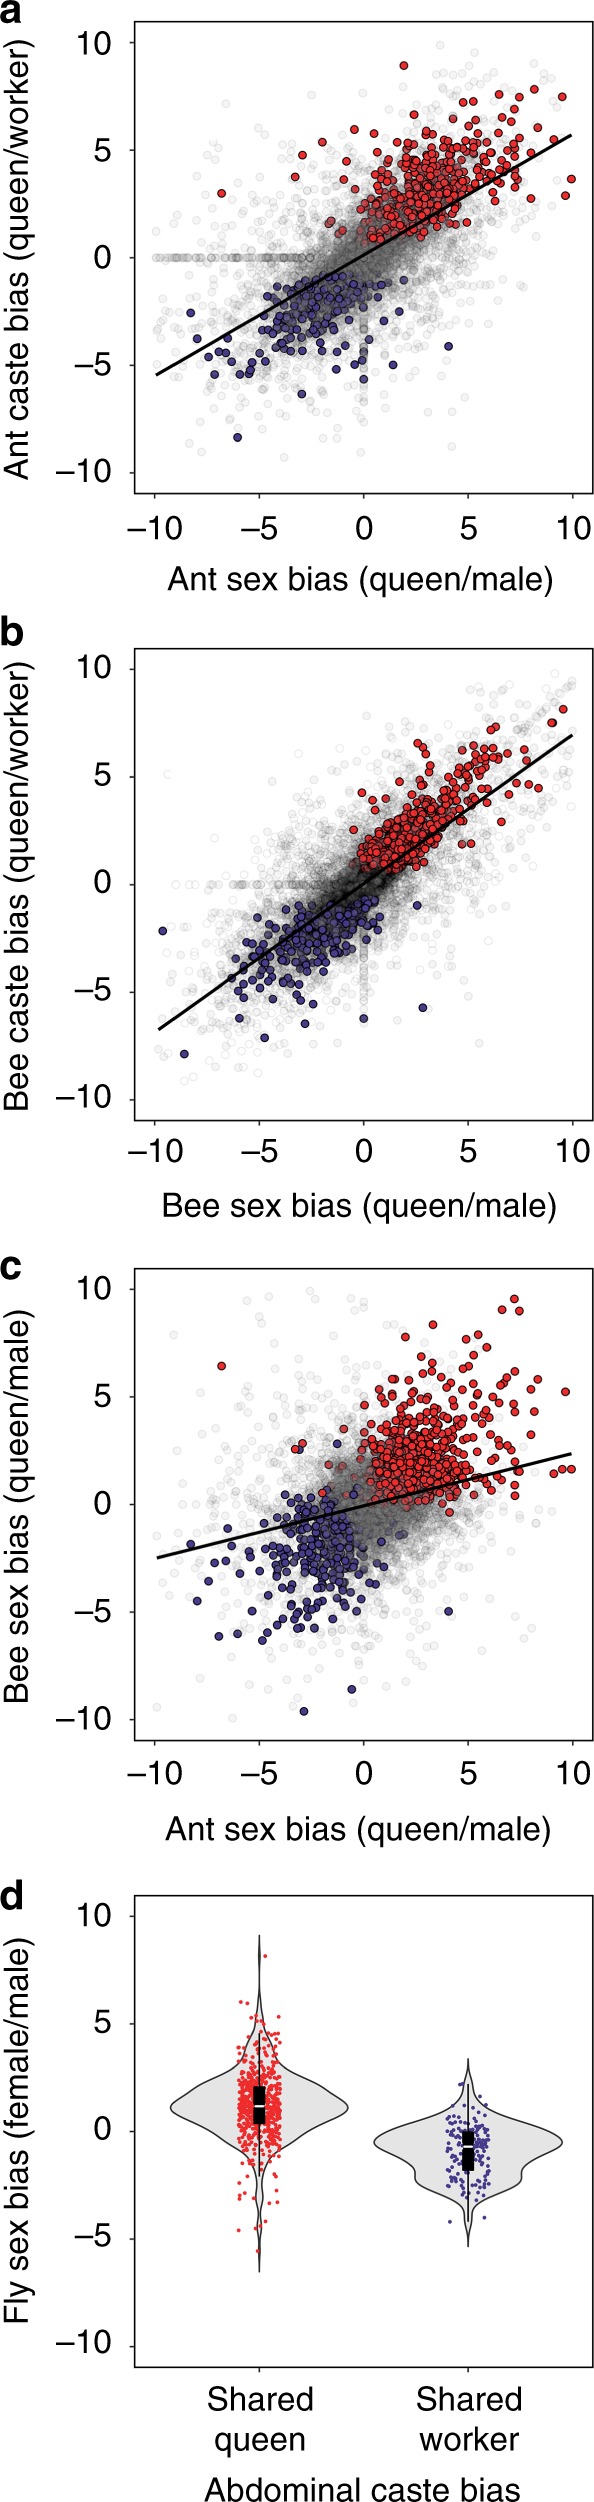
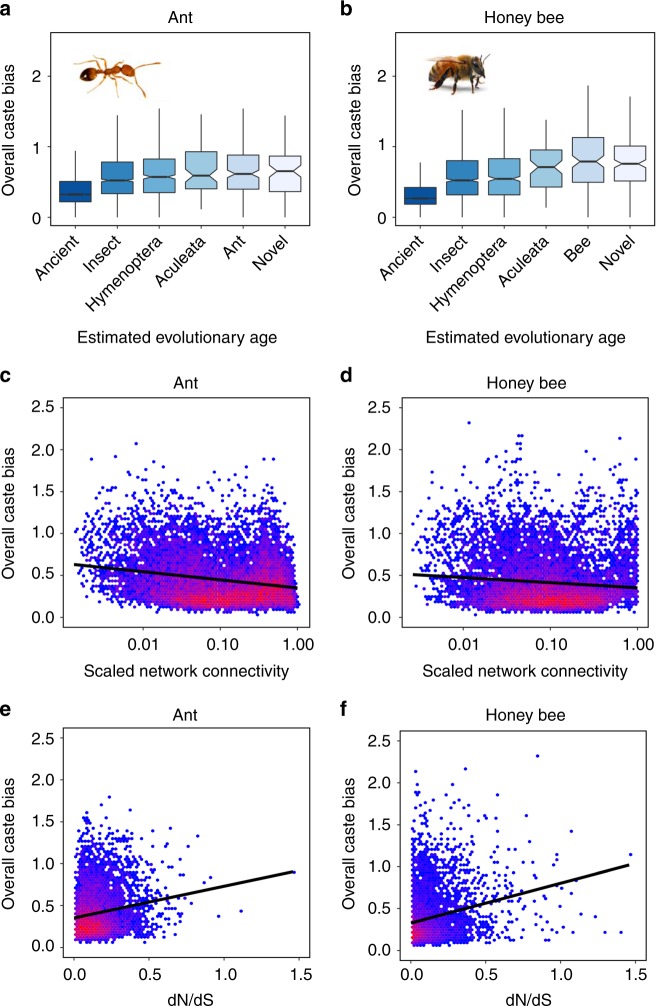
Eusociality has convergently evolved multiple times, but the genomic basis of caste-based division of labor and degree to which independent origins of eusociality have utilized common genes remain largely unknown. Here we characterize caste-specific transcriptomic profiles across development and adult body segments from pharaoh ants (Monomorium pharaonis) and honey bees (Apis mellifera), representing two independent origins of eusociality. We identify a substantial shared core of genes upregulated in the abdomens of queen ants and honey bees that also tends to be upregulated in mated female flies, suggesting that these genes are part of a conserved insect reproductive groundplan. Outside of this shared groundplan, few genes are differentially expressed in common. Instead, the majority of the thousands of caste-associated genes are plastically expressed, rapidly evolving, and relatively evolutionarily young. These results emphasize that the recruitment of both highly conserved and lineage-specific genes underlie the convergent evolution of novel traits such as eusociality.


Conflict of interest statement

The authors declare no competing interests.

Figures

Fig. 1
Fig. 1
Patterns of caste-biased expression in pharaoh ants and honey bees. The number of differentially expressed genes (FDR < 0.1) between (a) queens and workers and (b) nurses and foragers at each developmental stage or tissue in ants (left) and honey bees (right). “Head”, “thorax”, and “abdomen” refer to body segments of adults, while “pupa” and “larva” refer to whole bodies. “No ortholog” refers to genes for which no 1:1 ortholog exists (either due to apparent duplication or complete lack or orthology), “not shared caste/task bias” refers to genes for which 1:1 orthologs can be identified but are only differentially expressed in one species, and “shared caste/task” bias refers to genes for which 1:1 orthologs are differentially expressed in both species. Insets show the proportion of each category of gene out of all differentially expressed genes at that stage or tissue. c Proportion of abdominal DEGs by estimated evolutionary age (shading). “Shared queen/worker” indicates genes upregulated in queen or workers of both species. *: the category “larva” represents differential expression across larvae of all stages for which caste can be identified (second to fifth larval stage). Source data are provided as a Source Data file. Photos were taken by Luigi Pontieri (pharaoh ants) and Alex Wild (honey bees)
Fig. 2
Fig. 2
Genes with shared queen-biased expression are core network elements related to reproduction. Abdominal caste bias (log2 fold-change queen versus worker) is correlated with connectivity within the queen-abdomen module in (a) ants (Spearman correlation; rho = 0.536, P < 0.001) and (b) honey bees (Spearman correlation; rho = 0.617, P < 0.001). Genes upregulated in queens are in red, while genes upregulated in workers are in blue. Connectivity is proportional to the most highly connected gene in the module. Connectivity within the queen abdominal module is higher for genes found in the module for both species (shared) versus genes found in the module for only one species (not shared) in (c) ants and (d) honey bees. Middle line represents median values, outer edges of boxplot represent upper and lower quartiles, and whiskers represent a deviation of 1.5*(interquartile range) from the upper and lower quartiles. Source data are provided as a Source Data file. ***P < 0.001 (Wilcoxon test). Photos were taken by Luigi Pontieri (pharaoh ant) and Alex Wild (honey bee)
Fig. 3
Fig. 3
Caste bias is linked to sex bias. Abdominal caste bias (queen vs. worker log2 fold change) is correlated to abdominal sex bias (queen vs male log2 fold change) in a) M. pharaonis (Spearman correlation; rho = 0.715, P < 0.001) and b) A. mellifera (Spearman correlation; rho = 0.774, P < 0.001) and abdominal sex bias is correlated between the two species (Spearman correlation; rho = 0.280, P < 0.001) (c). Red indicates shared queen-biased abdominal DEGs, while blue indicates shared worker-biased abdominal DEGs. Gray indicates genes that did not exhibit shared expression patterns or were not differentially expressed. Lines in ac indicate the trendline of a linear model. d Shared queen-biased abdominal DEGs tend to be female biased in D. melanogaster, while shared worker-biased abdominal DEGs tend to be male biased in D. melanogaster (likely reflecting downregulation in females). Middle line represents median values, outer edges of boxplot represent upper and lower quartiles, and whiskers represent a deviation of 1.5*(interquartile range) from the upper and lower quartiles. Source data are provided as a Source Data file
Fig. 4
Fig. 4
Evolutionary and network features of caste-biased genes. Genes that exhibit more caste bias across tissues and developmental stages have younger estimated evolutionary ages (a, b) and tend to be loosely connected (c, d; Spearman correlation; ant: rho = −0.159, P < 0.001; honey bee: rho = −0.090, P < 0.001) and rapidly evolving (e, f; Spearman correlation; ant: rho = 0.157, P < 0.001; honey bee: rho = 0.240, P < 0.001). Overall caste bias combines queen/worker log2 fold-change values across all development stages and adult body segments. Connectivity is calculated using all samples and genes and scaled proportionally to the highest value. In a and b, middle line represents median values, outer edges of boxplot represent upper and lower quartiles, and whiskers represent a deviation of 1.5*(interquartile range) from the upper and lower quartiles. Source data are provided as a Source Data file. Photos were taken by Luigi Pontieri (pharaoh ant) and Alex Wild (honey bee)

Similar articles

Cited by

References

    1. Stern DL. The genetic causes of convergent evolution. Nat. Rev. Genet. 2013;14:751–764. doi: 10.1038/nrg3483. - DOI - PubMed
    1. Conte GL, Arnegard ME, Peichel CL, Schluter D. The probability of genetic parallelism and convergence in natural populations. Proc. Biol. Sci. 2012;279:5039–5047. doi: 10.1098/rspb.2012.2146. - DOI - PMC - PubMed
    1. Zhao L, Begun DJ. Genomics of parallel adaptation at two timescales in Drosophila. PLoS Genet. 2017;13:e1007016. doi: 10.1371/journal.pgen.1007016. - DOI - PMC - PubMed
    1. Shubin N, Tabin C, Carroll S. Deep homology and the origins of evolutionary novelty. Nature. 2009;457:818–823. doi: 10.1038/nature07891. - DOI - PubMed
    1. Wilson GA, et al. Orphans as taxonomically restricted and ecologically important genes. Microbiology. 2005;151:2499–2501. doi: 10.1099/mic.0.28146-0. - DOI - PubMed

Publication types