. 2019 Jun 14;10(1):2633.
doi: 10.1038/s41467-019-10603-4.

Long-range interactions between proximal and distal regulatory regions in maize

Affiliations

Long-range interactions between proximal and distal regulatory regions in maize

En Li et al. Nat Commun. .

Abstract

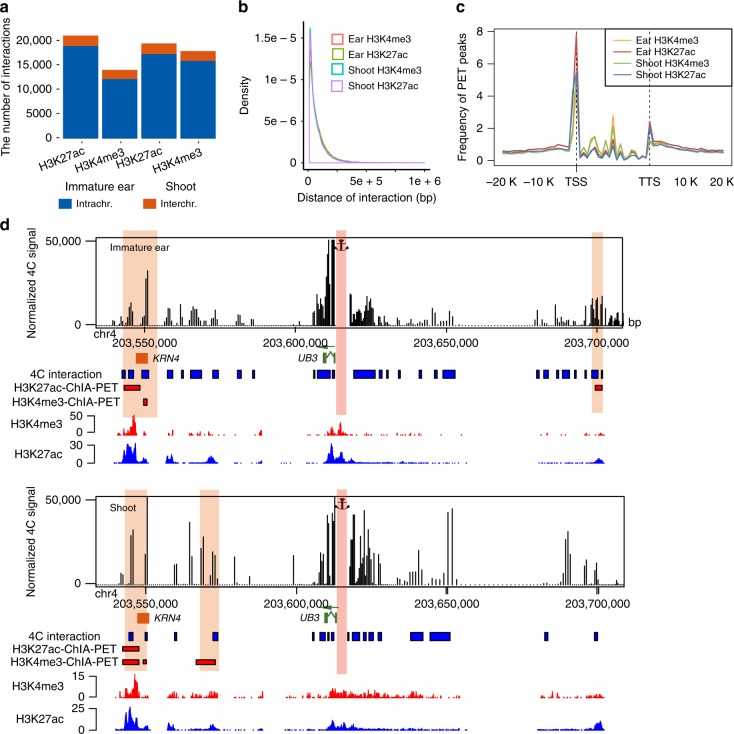
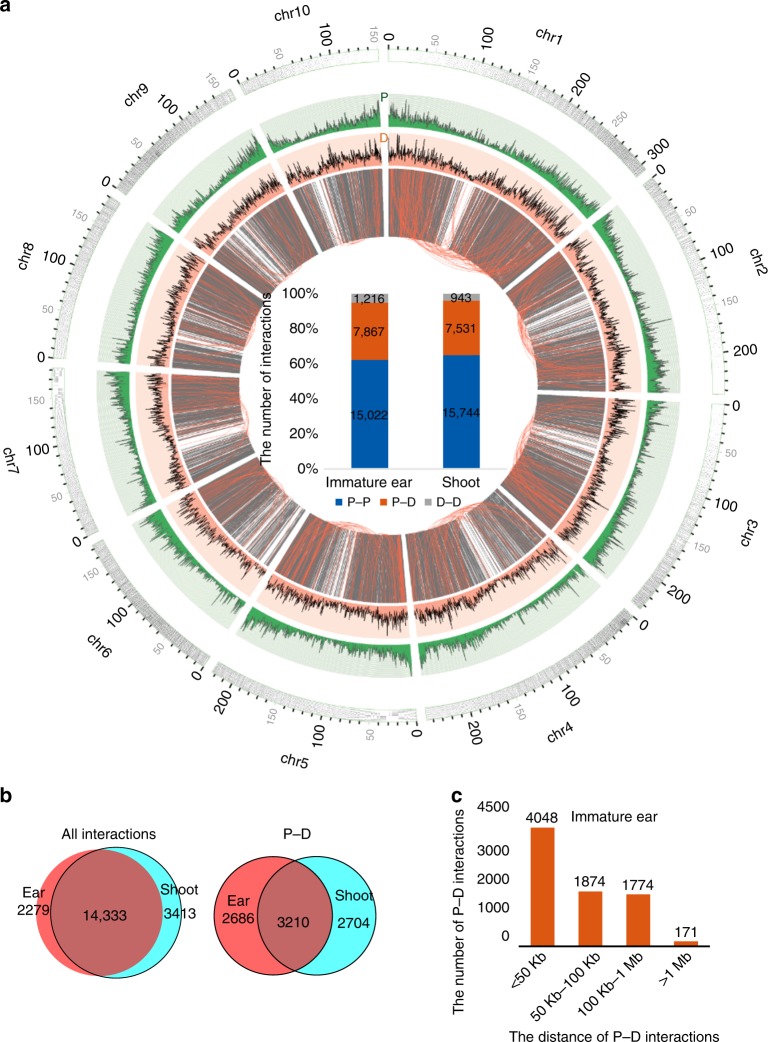
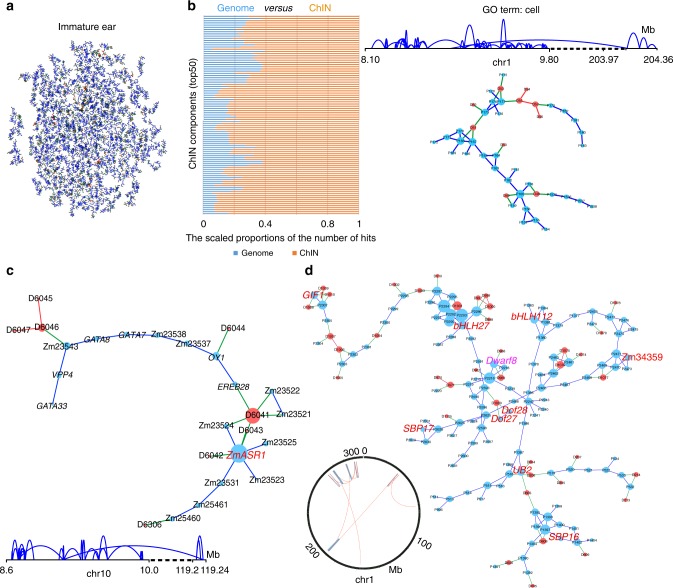
Long-range chromatin interactions are important for transcriptional regulation of genes, many of which are related to complex agronomics traits. However, the pattern of three-dimensional chromatin interactions remains unclear in plants. Here we report the generation of chromatin interaction analysis by paired-end tag sequencing (ChIA-PET) data and the construction of extensive H3K4me3- and H3K27ac-centered chromatin interaction maps in maize. Results show that the interacting patterns between proximal and distal regulatory regions of genes are highly complex and dynamic. Genes with chromatin interactions have higher expression levels than those without interactions. Genes with proximal-proximal interactions prefer to be transcriptionally coordinated. Tissue-specific proximal-distal interactions are associated with tissue-specific expression of genes. Interactions between proximal and distal regulatory regions further interweave into organized network communities that are enriched in specific biological functions. The high-resolution chromatin interaction maps will help to understand the transcription regulation of genes associated with complex agronomic traits of maize.


Conflict of interest statement

The authors declare no competing interests.

Figures

Fig. 1
Fig. 1
Identification of chromatin interactions in immature ear and shoot. a The number of intra-chromosomal interactions (intrachr.) and inter-chromosomal interactions (interchr.) identified in H3K27ac-mediated and H3K4me3-mediate chromatin interaction analysis by paired-end tag sequencing (ChIA-PET) in immature ear and shoot. b The density distribution of chromatin interactions along the distance in H3K27ac-mediated and H3K4me3-mediate ChIA-PET in immature ear and shoot. c The profile of PET peaks around gene body of H3K27ac-mediated and H3K4me3-mediate ChIA-PET in immature ear and shoot. d 4C validation for the promoter of UB3 as viewpoint in immature ear and shoot. The blue rectangles indicate the regions interacting with viewpoints in 4C experiments. The red rectangles indicate the regions interacting with viewpoints in ChIA-PET datasets. The orange rectangle represents the previously reported regulatory region (KRN4) of UB3. Source Data of Fig. 1d are provided as a Source Data file
Fig. 2
Fig. 2
Identification of distal regulatory regions (DRs) in immature ear and shoot. a The bar plots show the number of common and tissue-specific DRs in immature ear and shoot. b Violin plots for length of DRs in immature ear and shoot. c The profile of DNA methylation (CG context) around DR in immature ear and shoot. The DNA methylation level, (CG context) of DRs was significantly lower than that of their flanking regions. d The distribution of DRs in different genomic regions in two tissues
Fig. 3
Fig. 3
Annotation of chromatin interactions. a Circos map of the whole-genome chromatin interactions from chromosome 1 to chromosome 10 in immature ear, generated using the Circos software package (http://circos.ca/). Intra-chromosomal interactions are drawn in the innermost ring, followed by the distal regulatory region (DR) (dark orange) and gene density track (dark green). Chromatin interactions with distance longer than 1 Mb are highlighted by orange arcs. The histogram in center region of Circos map showed the number of proximal–proximal (P–P), proximal–distal (P–D), distal–distal (D–D) chromatin interactions in immature ear and shoot, respectively. b Venn diagram of the number of P associated with all intra-chromosomal interactions and P–D interactions in immature ear and shoot. c Summary of the number of P–D interaction with variable distances in immature ear
Fig. 4
Fig. 4
Chromatin interaction mode in immature ear. a The left panel is the summary bar chart showed the number of proximal paired-end tag (PET) peaks (P) (x axis) interacting with various numbers of distal PET peaks (D) (y axis) in immature ear. The corresponding right panel is an example of one promoter (TB1) interacting with seven D in immature ear. b The left panel is the summary bar chart showed the number of D (x axis) interacting with various number of P (y axis) in immature ear. The corresponding right panel is an example of one D interacted with five P in immature ear. The green rectangle represents the corresponding gene. The blue and orange rectangles indicate P and D, respectively. P was highlighted in dark green, and D was highlighted in yellow. Source Data of Fig. 4a, b are provided as a Source Data file
Fig. 5
Fig. 5
The association of chromatin interaction and gene expression. a The comparison of fragments per kilobase of transcript per million (FPKM) for genes interacting or not interacting with chromatin interactions (**p <2.2e − 16, two-sided t test). b Transcriptional status of genes with (w) or without (w/o) interactions. The bar plot shows the number of corresponding genes with the proportion labeled on the bar. ‘Inactive’ indicates gene with FPKM <1, ‘Active’ indicates gene with FPKM ≥1. ‘w’ represents genes with chromatin interactions; ‘w/o’ represents genes without chromatin interactions. c The comparison of expression correlation between gene pairs with proximal–proximal (P–P) interaction and controls in immature ear and shoot (immature ear: **p = 2.521e − 08, shoot: **p = 3.6e − 14, two-sided t test). d The comparison of Shannon entropy of gene interacting with genic D or intergenic D and gene with genic D in its gene body. (**p <2.2e − 16, two-sided t test). e The comparison of Shannon entropy of gene interacting with different number of intergenic D. Gene not interacting with intergenic D and enriched with H3K4me3/H3K27ac signal were as control (two-sided t test). In the box plot, the central rectangle spans the first quartile to the third quartile (the interquartile range). A segment inside the rectangle shows the median and whiskers above and below the box show the locations of the minimum and maximum. We used the collected RNA-sequencing (RNA-seq) dataset as reported, consisting of 53 different seeds and 25 non-seed samples in maize, and then measured the co-expression level of gene pairs and calculated Shannon entropy of each gene. Summary of the number of gene pairs or genes in this figure can be seen in Supplementary Table 5. Source Data of Fig. 5d, e are provided as a Source Data file
Fig. 6
Fig. 6
Tissue-specific chromatin interactions in immature ear and shoot. a The heat map of fragments per kilobase of transcript per million (FPKM) value (left panel) and chromatin interaction (right panel) of all genes in immature ear and shoot. b The heat map of chromatin interactions of immature ear-specific expressed genes (p = 0.006, two-sided t test), common genes, and shoot-specific expressed genes (p = 0.002, two-sided t test) in immature ear and shoot, respectively. c An example of immature ear-specific chromatin interaction. FEA4 gene (highlighted in dark green) interacted with a distantly located (∼17 kb) distal PET peaks (D) (highlighted in yellow) in immature ear. In contrast, the FEA4 gene in shoot was not expressed and had no interaction with that D. d An example of shoot-specific chromatin interaction. PSBS1 gene (highlighted in dark green) interacted with a distantly located (∼58 kb) D (highlighted in yellow) in shoot. In contrast, the PSBS1 gene in immature ear was not expressed and had no interaction with that D. The green rectangle represents the corresponding gene. The blue and orange rectangles indicate P and D, respectively
Fig. 7
Fig. 7
Functional communities of chromatin interactions in chromatin interaction network (ChINs). a All the ChINs identified in immature ear. Here only showed the ChINs with more than 30 nodes. b Enrichment of gene ontology (GO) terms in top 50 ChINs in immature ear and shoot. Only significant GO terms (false discovery rate (FDR) <0.05) are presented in the left panel. Enrichment of GO terms is represented as scaled proportions of the observed number of hits in a ChIN component (orange) vs. the expected number of hits in the genome (blue). The right panel showed a ChIN in immature ear, where all genes were enriched in cell function (GO term). c The ChIN for ZmASR1 (in red) in shoot. The arc map in left bottom showed the region span of all chromatin interactions in this ChIN on genome. d The ChIN for Dwarf8 (in pink), which regulates plant height and flowering time, in immature ear. There were other nine genes (GIF1, UB2, bHLH27, bHLH212, DOF27, DOF28, SBP16, SBP17, and Zm34359; in red) potentially associated with flowering in this ChIN. Circos map in the left bottom showed the region span of all chromatin interactions in this ChIN. Chromatin interactions with distance longer than 1 Mb are highlighted by orange arcs, others in blue. Ellipses in blue and red indicated proximal PET peaks (P) and distal PET peaks (D), respectively, in ChIA-PET datasets. P–P, P–D, and D–D interaction are presented in blue, green, and red edges in network. Source Data of Fig. 7d are provided as a Source Data file

Similar articles

Cited by

References

    1. Visel A, et al. ChIP-seq accurately predicts tissue-specific activity of enhancers. Nature. 2009;457:854–858. doi: 10.1038/nature07730. - DOI - PMC - PubMed
    1. Rada-Iglesias A, et al. A unique chromatin signature uncovers early developmental enhancers in humans. Nature. 2011;470:279–283. doi: 10.1038/nature09692. - DOI - PMC - PubMed
    1. Marand AP, Zhang T, Zhu B, Jiang J. Towards genome-wide prediction and characterization of enhancers in plants. Biochim. Biophys. Acta. 2017;1860:131–139. doi: 10.1016/j.bbagrm.2016.06.006. - DOI - PubMed
    1. Williamson I, et al. Anterior-posterior differences in HoxD chromatin topology in limb development. Development. 2012;139:3157–3167. doi: 10.1242/dev.081174. - DOI - PMC - PubMed
    1. Jin F, et al. A high-resolution map of the three-dimensional chromatin interactome in human cells. Nature. 2013;503:290–294. doi: 10.1038/nature12644. - DOI - PMC - PubMed

Publication types

MeSH terms