. 2019 Jun 14;10(1):2637.
doi: 10.1038/s41467-019-10683-2.

Orchestrated ensemble activities constitute a hippocampal memory engram

Affiliations

Orchestrated ensemble activities constitute a hippocampal memory engram

Khaled Ghandour et al. Nat Commun. .

Abstract

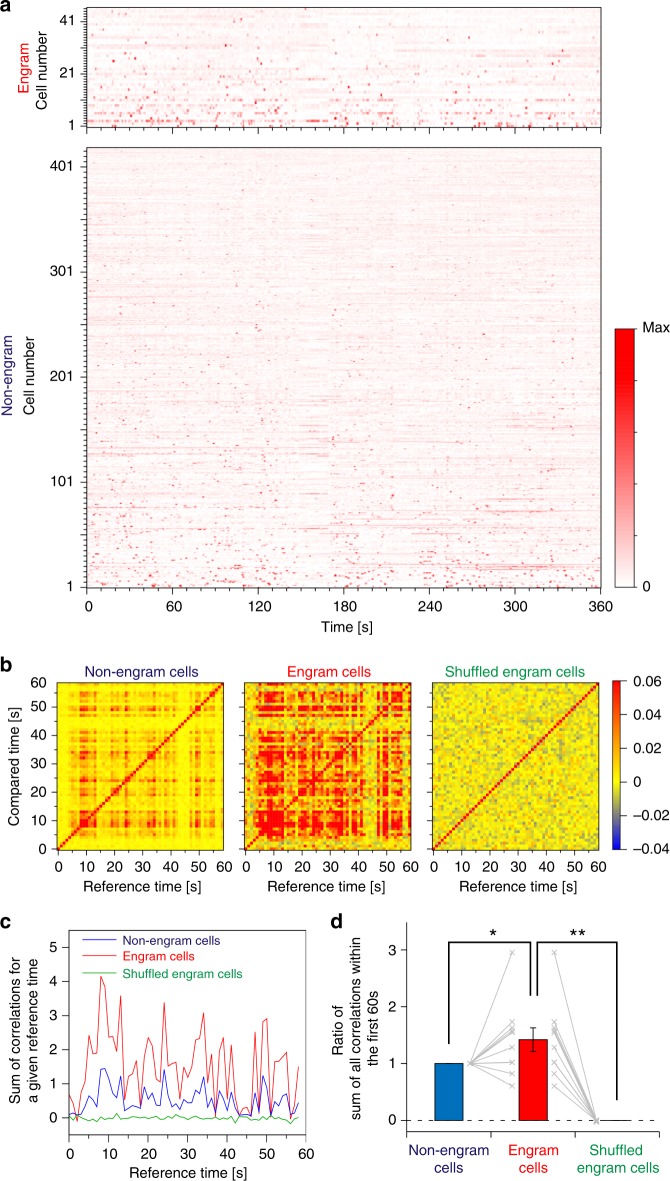
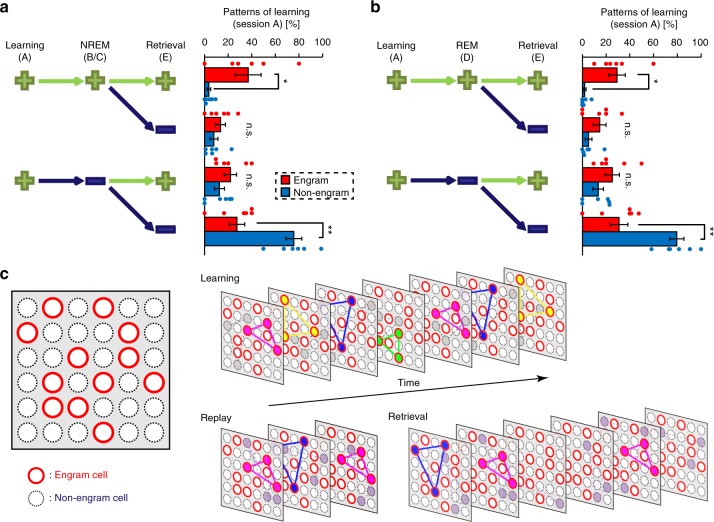
The brain stores and recalls memories through a set of neurons, termed engram cells. However, it is unclear how these cells are organized to constitute a corresponding memory trace. We established a unique imaging system that combines Ca2+ imaging and engram identification to extract the characteristics of engram activity by visualizing and discriminating between engram and non-engram cells. Here, we show that engram cells detected in the hippocampus display higher repetitive activity than non-engram cells during novel context learning. The total activity pattern of the engram cells during learning is stable across post-learning memory processing. Within a single engram population, we detected several sub-ensembles composed of neurons collectively activated during learning. Some sub-ensembles preferentially reappear during post-learning sleep, and these replayed sub-ensembles are more likely to be reactivated during retrieval. These results indicate that sub-ensembles represent distinct pieces of information, which are then orchestrated to constitute an entire memory.


Conflict of interest statement

Y.H. receives research funding from Fujitsu Laboratories Ltd. and Dwango. The other authors declare no competing interests.

Figures

Fig. 1
Fig. 1
Optogenetic activation of c-fos-Tet-tagged cells in CA1 induces recall of a contextual memory. a Schematic diagram showing the behavioural paradigm for labelling the engram corresponding to contextual information, but not shock information, using the context pre-exposure facilitation effect (CPFE) paradigm (see Methods). Blue and grey lines represent ON and OFF doxycycline (Dox), respectively. b Test 1 shows significantly higher levels of freezing in the paired channelrhodopsin-2 (ChR2) and enhanced yellow fluorescent protein (EYFP) groups (one-way analysis of variance (ANOVA), F(2,17) = 7.46915, p = 0.00561; Scheffe’s post-hoc test, *p < 0.05, **p < 0.01) than in the unpaired ChR2 group. This indicates that information about context A was associated with information about the shock only in the paired group. c Test 2 showed comparable freezing in all groups during the first 1–2 min (p > 0.82, one-way ANOVA) when the light was off. There was a significant increase in freezing in the ChR2 paired group, but not in the EYFP paired or ChR2 unpaired groups, upon 4 Hz light stimulation during the 3–4 min after onset of test 2 (two-way repeated-measures ANOVA, F(2,35) = 8.64192, p = 0.003186; Scheffe’s post-hoc test, *p < 0.05, **p < 0.01; paired t test, two-tailed (EYFP paired) t(5) = 0.38532, p = 0.71, (ChR2 paired) t(5) = −4.90136, p = 0.0044, (ChR2 unpaired) t(5) = −0.74587, p = 0.489, ##p < 0.01). d Representative image of EYFP/ChR2 expression in the CA1 of lentivirus (LV)-injected c-fos-tTA mice. Green and blue signals represent EYFP and 4′,6-diamidino-2-phenylindole (DAPI) nuclear staining, respectively (scale bar, 50 µm). e The percentage of cells labelled with EYFP/ChR2 per DAPI staining was comparable across the test group and control groups (one-way ANOVA, F(2,17) = 0.63404, p = 0.544). EYFP paired group, ChR2 paired group, and ChR2 unpaired group: n = 6 each. Data represent the mean ± s.e.m. n.s. not significant
Fig. 2
Fig. 2
In vivo Ca2+ imaging of engram cells identified with the photoconvertible protein, Kikume Green Red (KikGR). a Schematic diagram showing labelling and visualization of engram and non-engram cells in Thy1-G-CaMP7 × c-fos-tTA double transgenic mice injected with TRE-KikGR lentivirus (LV). b Experimental design for calcium imaging. Top: snapshot of KikGR (scale bar, 200 µm), before (1) and after (2) contextual exploration, and after photoconversion (3), and representative photographs of behaviour during contextual learning, sleep and retrieval. Bottom: Ca2+ imaging paradigm. Photoconversion by 365 nm light (dark purple arrow) and snapshot (pink arrow) before OFF doxycycline (Dox), then calcium imaging during contextual learning and sleep with OFF Dox, followed by a second snapshot and photoconversion after reinstatement of ON Dox, then a calcium imaging session during retrieval. c Schematic diagram showing the processing of the Ca2+ imaging for the entire movie. Step 1: binning, motion correction, and background removal for each session independently; Step 2: concatenation of all movies into one long movie; motion correction run on the entire movie using a single reference frame; Step 3: separation of the entire movie into single sessions; ∆F/F performed on each movie; Step 4: re-concatenation of the single movies and procession to auto-detection of Ca2+ signals. Mot Corr, motion correction. d Field of view (FOV) from a representative animal; white enclosed area is the area that showed KikGR expression and was incorporated in the analysis, with some representative engram and non-engram cells indicated in red and blue, respectively, together with their ID labels. e Regions of interest (ROI) of the labelled cells and their representative traces (extracted between the frames indicated) on days 1 and 2 for both engram cells (left) and non-engram cells (right). Arrowheads point to the time selected for evaluating the cell location. The number of frames is indicated under each ROI
Fig. 3
Fig. 3
Engram cells show characteristic activity during contextual learning. a Normalized calcium transients for all engram cells (top) and non-engram cells (bottom) during contextual exposure (displayed over time). b Typical overlap M (t, t’) between correlation matrices at two time points (see Methods) for non-engram (left), engram (middle) and shuffled engram (right) cells within the first 60 s of calcium imaging. c Temporal sum of overlaps Mtot(t) (see Methods) from a representative animal. d The average sum of overlaps in engram cells and shuffled engram cells, that is, the summation of Mtot(t) over time during the first 60 s of calcium imaging relative to the sum from non-engram cells. Statistical comparisons were conducted using the Wilcoxon’s signed-rank test, two-tailed. n = 10; (engram vs. non-engram) t(9) = 2.01, p = 0.037 (engram vs. shuffled engram) t(9) = 6.81, p = 0.000038; *p < 0.05, **p < 0.01. Data represent the mean ± s.e.m. across all animals
Fig. 4
Fig. 4
Total activity of engram cells is stable across memory processing. a Schematic diagram showing the calcium imaging paradigm. b Electroencephalogram (EEG) and electromyogram (EMG) recordings while the animal was awake and during non-rapid eye movement 1 (NREM1), NREM2, and rapid eye movement (REM) sleep are indicated by red, orange, yellow and green, respectively. c Population vector distance (PVD) across sessions with respect to the learning session (A) in engram and non-engram cells. n = 6, two-way repeated-measures analysis of variance (ANOVA), F(1, 5) = 23.40, p = 0.0047 (engram vs. non-engram). d Difference in PVD between engram and non-engram cells [n = 6; Bonferroni’s multiple comparisons test, p = 0.001 (Session B), p = 0.0043 (Session C), p = 0.0038 (Session D), p  ≤ 0.0001(Session E), p = 0.0017 (Session F)]. **p < 0.01, ****p < 0.0001. Data represent the mean ± s.e.m
Fig. 5
Fig. 5
Contextual information is constructed by several sub-ensembles within a single engram population. a Diagrammatic representation of non-negative matrix factorization (NMF) analysis; coloured bars indicate the relative activity of each neuron in the detected pattern (shown as the magnitude) (left), and the relative intensity of the synchronous activity of this pattern across time (right). b Example of two detected patterns, with the participating neurons in each pattern (top and middle left) and their overlay (bottom left), and the temporal pattern of the corresponding intensity of synchronous activity during the learning session (A) (top and middle right) and their overlay (bottom right). c Distribution map of detected engram cells. Green- and magenta-filled contours indicate neurons assigned to two different ensembles (corresponding to patterns #5 and #9, respectively), and yellow-filled contours denote cells shared between patterns (scale bar, 100 µm). d, e Representative matching scores (MS) for pattern similarity analysis in engram cells (d) and non-engram cells (e). f MS across sessions (with respect to session A) for engram and non-engram cells. n = 6, two-way repeated-measures analysis of variance (ANOVA), F 1, 5) = 16.53, p = 0.0097 (engram vs. non-engram). g Difference in MS between engram and non-engram cells across sessions [n = 6; Bonferroni’s multiple comparisons test, p  ≤ 0.0001 (session B), p = 0.0005 (session C), p ≤ 0.0001 (session D), p ≤ 0.0001 (session E), p = 0.0001 (session F); paired t test, one-tailed (E vs. F) t(5) = 2.47, p = 0.0284]. h MS across sessions (with respect to session A) for original and shuffled engram data. n = 6, two-way repeated-measures ANOVA, F(1, 5) = 8.657, p = 0.0322 (original vs. shuffled engram). i Difference in MS between original and shuffled engram data across sessions [n = 6, Bonferroni’s multiple comparisons test, p = 0.0122 (session B), p ≥  0.9999 (session C); p = 0.0296 (session D), p = 0.0017 (session E), p = 0.931 (session F)]. *p < 0.05, **p < 0.01, ***p < 0.001, ****p < 0.0001, #p < 0.05. Data represent the mean ± s.e.m
Fig. 6
Fig. 6
Engram sub-ensembles are frequently reactivated during memory processing. a, b Pair-making possibilities of each pattern expressed during learning with other patterns expressed from the non-rapid eye movement (NREM) (a) or rapid eye movement (REM) (b) sessions to retrieval. Positive green marks (+) and negative dark blue marks (−) indicate the presence or absence, respectively, of a significant pattern pair in the corresponding session. Pattern pairs with a dot product >0.6 are considered similar. Graphs show the percentage of patterns relative to the total number of patterns that appeared in the learning session. Statistical comparisons between engram and non-engram sub-ensembles were conducted with a paired t test, two-tailed. n = 6; (+++) vs (+++), t(5) = 2.882, p = 0.03; (+−−) vs. (+−−), t(5) = 4.53, p = 0.006 in a; (+++) vs. (+++), t(5) = 3.763, p = 0.013; (+−−) vs. (+−−), t(5) = 4.654, p = 0.0056 in b; *p < 0.05, **p < 0.01, n.s. not signficant. Statistical comparisons between engram sub-ensembles reactivated during sleep and retrieval vs. during retrieval, but not sleep were conducted with a paired t test, two-tailed. NREM, p = 0.34; REM, p = 0.74. Data represent the mean ± s.e.m. c Diagrammatic model showing orchestration of ensembles of engram cells across memory processing

References

    1. Semon, R. W. The Mneme (G Allen & Unwin Limited, London, 1921).
    1. Josselyn SA, Köhler S, Frankland PW. Finding the engram. Nat. Rev. Neurosci. 2015;16:521. doi: 10.1038/nrn4000. - DOI - PubMed
    1. Liu Xu, Ramirez Steve, Pang Petti T., Puryear Corey B., Govindarajan Arvind, Deisseroth Karl, Tonegawa Susumu. Optogenetic stimulation of a hippocampal engram activates fear memory recall. Nature. 2012;484(7394):381–385. doi: 10.1038/nature11028. - DOI - PMC - PubMed
    1. Nomoto M, et al. Cellular tagging as a neural network mechanism for behavioural tagging. Nat. Commun. 2016;7:12319. doi: 10.1038/ncomms12319. - DOI - PMC - PubMed
    1. Ohkawa N, et al. Artificial association of pre-stored information to generate a qualitatively new memory. Cell Rep. 2015;11:261–269. doi: 10.1016/j.celrep.2015.03.017. - DOI - PubMed

Publication types

Substances