Review
. 2019 Oct;24(10):1415-1424.
doi: 10.1038/s41380-019-0441-1. Epub 2019 Jun 14.

Conceptualizing mental disorders as deviations from normative functioning

Affiliations
Review

Conceptualizing mental disorders as deviations from normative functioning

Andre F Marquand et al. Mol Psychiatry. 2019 Oct.

Erratum in

Abstract

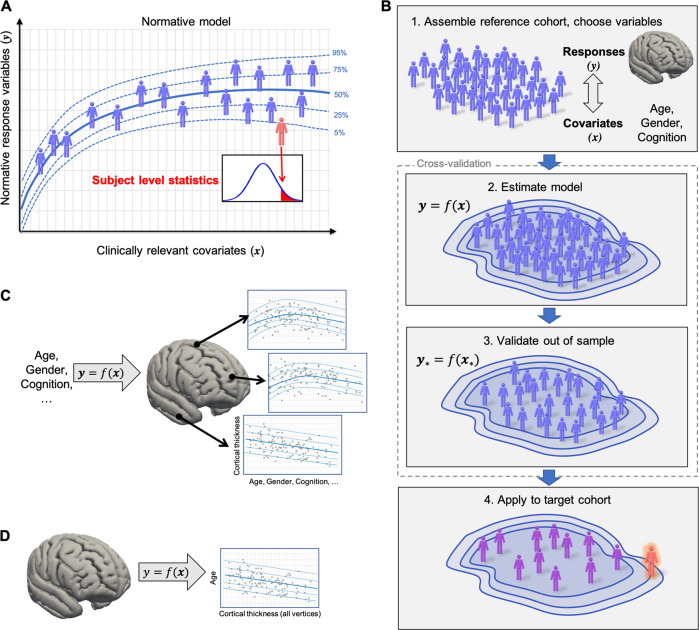
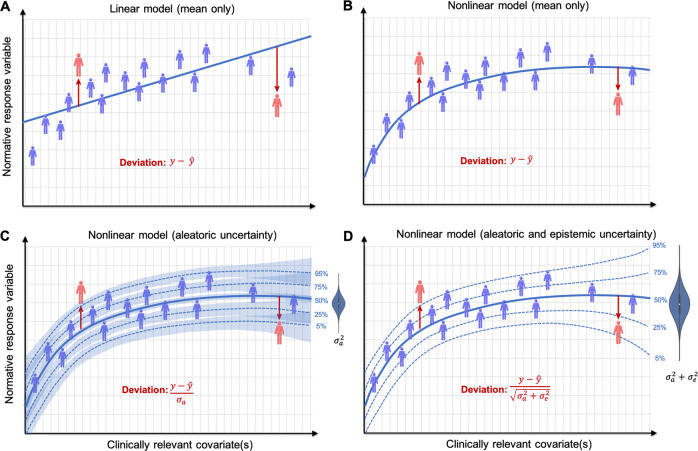
Normative models are a class of emerging statistical techniques useful for understanding the heterogeneous biology underlying psychiatric disorders at the level of the individual participant. Analogous to normative growth charts used in paediatric medicine for plotting child development in terms of height or weight as a function of age, normative models chart variation in clinical cohorts in terms of mappings between quantitative biological measures and clinically relevant variables. An emerging body of literature has demonstrated that such techniques are excellent tools for parsing the heterogeneity in clinical cohorts by providing statistical inferences at the level of the individual participant with respect to the normative range. Here, we provide a unifying review of the theory and application of normative modelling for understanding the biological and clinical heterogeneity underlying mental disorders. We first provide a statistically grounded yet non-technical overview of the conceptual underpinnings of normative modelling and propose a conceptual framework to link the many different methodological approaches that have been proposed for this purpose. We survey the literature employing these techniques, focusing principally on applications of normative modelling to quantitative neuroimaging-based biomarkers in psychiatry and, finally, we provide methodological considerations and recommendations to guide future applications of these techniques. We show that normative modelling provides a means by which the importance of modelling individual differences can be brought from theory to concrete data analysis procedures for understanding heterogeneous mental disorders and ultimately a promising route towards precision medicine in psychiatry.


Conflict of interest statement

JKB has been a consultant to/member of advisory board of and/or speaker for Janssen Cilag BV, Eli Lilly, Medice, Roche, and Servier. He is not an employee of any of these companies. He is not a stock shareholder of any of these companies. He has no other financial or material support, including expert testimony, patents, or royalties. CFB is director and shareholder of SBGneuro Ltd. The other authors declare that they have no conflict of interest.

Figures

Fig. 1
Fig. 1
Conceptual overview of normative modelling. a Normative modelling is similar to the use of growth charts in paediatric medicine, except the conventional response variable (e.g. height or weight) is substituted for a quantitative biological readout (e.g. regional brain activity). The classical covariates (age and sex) can also be substituted for clinically relevant variables. Normative modelling provides statistical inference at the level of each subject with respect to the normative model (red figure). b Procedural overview of normative modelling. After the choice of reference cohort and variables, the normative model is estimated, before being validated out of sample on new response variables and covariates (y* and x*, respectively). Finally, the estimated model can be applied to a target cohort (e.g. clinical cohort). c A common configuration for normative modelling of neuroimaging data, where a separate normative model is estimated for each sampled brain location. This can be described by a set of functions (y = f(x)) predicting neurobiological response variables (y) from clinical covariates (x). d Normative models can also be estimated for the opposite mapping, where brain measures are chosen as covariates and age or other covariates are chosen as a response variable. See text for further details
Fig. 2
Fig. 2
Separating different sources of uncertainty in normative modelling. Panels a and b show the simplest approach for normative models which do not quantify uncertainty at all (a: linear model, b: non-linear model). Instead, deviations from the model (red figures) are assessed via the residuals from a regression function (blue lines). In red, the corresponding equation for assessing deviations from the model is shown where deviation from the normative model are assessed simply as the difference between the true (y) and predicted (y^) normative response variable for each subject. c Some models estimate centiles of variation explicitly either via separate model fits or post hoc to the initial regression fit (blue dotted lines). This captures ‘aleatoric’ or irreducible variation in the cohort which shows how subjects vary across the population (σa2). However, there is also uncertainty associated with each of these centiles of variation (shaded blue regions), which is highest in regions of low data density and should be accounted for. d Some models separate and take all sources of variation into account (i.e. also including ‘epistemic’ uncertainty (σe2), which can be reduced by the addition of more data). This allows the model to automatically adjust predictions, becoming more conservative in regions where data are sparse. This is shown by a widening of the statistical intervals, although note that these intervals now have a different interpretation to those in (c). For example, the right-most figure in (d) would not be judged as an outlier, whereas the same figure may be judged as an outlier in models that do not account for all sources of uncertainty (c). This is important to prevent a subject being declared as ‘atypical’ simply because of data sparsity. See text for further details

References

    1. Kapur S, Phillips AG, Insel TR. Why has it taken so long for biological psychiatry to develop clinical tests and what to do about it? Mol Psychiatry. 2012;17:1174–9. doi: 10.1038/mp.2012.105. - DOI - PubMed
    1. Scarr E, Millan MJ, Bahn S, Bertolino A, Turck CW, Kapur S, et al. Biomarkers for Psychiatry: The Journey from Fantasy to Fact, a Report of the 2013 CINP Think Tank. Int J Neuropsychoph. 2015;18:pyv042. doi: 10.1093/ijnp/pyv042. - DOI - PMC - PubMed
    1. Wolfers T, Buitelaar JK, Beckmann C, Franke B, Marquand AF. From estimating activation locality to predicting disorder: a review of pattern recognition for neuroimaging-based psychiatric diagnostics. Neurosci Biobehav Rev. 2015;57:328–49. doi: 10.1016/j.neubiorev.2015.08.001. - DOI - PubMed
    1. Cicchetti D, Rogosch FA. Equifinality and multifinality in developmental psychopathology. Dev Psychopathol. 1996;8:597–600. doi: 10.1017/S0954579400007318. - DOI
    1. Cannon TD, Keller MC. Endophenotypes in the genetic analyses of mental disorders. Annu Rev Clin Psychol. 2006;2:267–90. doi: 10.1146/annurev.clinpsy.2.022305.095232. - DOI - PubMed

Publication types