Mesozoic mitogenome rearrangements and freshwater mussel (Bivalvia: Unionoidea) macroevolution
- PMID: 31201385
- PMCID: PMC6906506
- DOI: 10.1038/s41437-019-0242-y
Mesozoic mitogenome rearrangements and freshwater mussel (Bivalvia: Unionoidea) macroevolution
Abstract
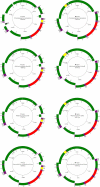
Using a new fossil-calibrated mitogenome-based approach, we identified macroevolutionary shifts in mitochondrial gene order among the freshwater mussels (Unionoidea). We show that the early Mesozoic divergence of the two Unionoidea clades, Margaritiferidae and Unionidae, was accompanied by a synchronous split in the gene arrangement in the female mitogenome (i.e., gene orders MF1 and UF1). Our results suggest that this macroevolutionary jump was completed within a relatively short time interval (95% HPD 201-226 Ma) that coincided with the Triassic-Jurassic mass extinction. Both gene orders have persisted within these clades for ~200 Ma. The monophyly of the so-called "problematic" Gonideinae taxa was supported by all the inferred phylogenies in this study using, for the first time, the M- and F-type mitogenomes either singly or combined. Within Gonideinae, two additional splits in the gene order (UF1 to UF2, UF2 to UF3) occurred in the Mesozoic and have persisted for ~150 and ~100 Ma, respectively. Finally, the mitogenomic results suggest ancient connections between freshwater basins of East Asia and Europe near the Cretaceous-Paleogene boundary, probably via a continuous paleo-river system or along the Tethys coastal line, which are well supported by at least three independent but almost synchronous divergence events.
Conflict of interest statement
The authors declare that they have no conflict of interest.
Figures


Similar articles
-
Reclassification of Lamprotula rochechouartii as Margaritifera rochechouartiicomb. nov. (Bivalvia: Margaritiferidae) revealed by time-calibrated multi-locus phylogenetic analyses and mitochondrial phylogenomics of Unionoida.Mol Phylogenet Evol. 2018 Mar;120:297-306. doi: 10.1016/j.ympev.2017.12.017. Epub 2017 Dec 20. Mol Phylogenet Evol. 2018. PMID: 29274495
-
The complete maternally and paternally inherited mitochondrial genomes of the endangered freshwater mussel Solenaia carinatus (Bivalvia: Unionidae) and implications for Unionidae taxonomy.PLoS One. 2013 Dec 17;8(12):e84352. doi: 10.1371/journal.pone.0084352. eCollection 2013. PLoS One. 2013. PMID: 24358356 Free PMC article.
-
Ancient River Inference Explains Exceptional Oriental Freshwater Mussel Radiations.Sci Rep. 2017 May 18;7(1):2135. doi: 10.1038/s41598-017-02312-z. Sci Rep. 2017. PMID: 28522869 Free PMC article.
-
'Fish' (Actinopterygii and Elasmobranchii) diversification patterns through deep time.Biol Rev Camb Philos Soc. 2016 Nov;91(4):950-981. doi: 10.1111/brv.12203. Epub 2015 Jun 23. Biol Rev Camb Philos Soc. 2016. PMID: 26105527 Review.
-
Vicariance and dispersal in southern hemisphere freshwater fish clades: a palaeontological perspective.Biol Rev Camb Philos Soc. 2019 Apr;94(2):662-699. doi: 10.1111/brv.12473. Epub 2018 Oct 19. Biol Rev Camb Philos Soc. 2019. PMID: 30338909 Review.
Cited by
-
The complete female mitogenome of Potomida semirugata (Lamarck, 1819).Mitochondrial DNA B Resour. 2024 Jul 17;9(7):892-896. doi: 10.1080/23802359.2024.2378964. eCollection 2024. Mitochondrial DNA B Resour. 2024. PMID: 39027116 Free PMC article.
-
Phylogeny and biogeography of Indochinese freshwater mussels in the genus Pilsbryoconcha Simpson, 1900 (Bivalvia: Unionidae) with descriptions of four new species.Sci Rep. 2022 Nov 28;12(1):20458. doi: 10.1038/s41598-022-24844-9. Sci Rep. 2022. PMID: 36443375 Free PMC article.
-
Comparative morphology and mitogenomics of freshwater mussels Koreosolenaia, Parvasolenaia, and Sinosolenaia (Bivalvia: Unionidae: Gonideinae).BMC Genomics. 2024 Dec 24;25(1):1243. doi: 10.1186/s12864-024-11164-7. BMC Genomics. 2024. PMID: 39719563 Free PMC article.
-
The mitogenome of Halotydeus destructor (Tucker) and its relationships with other trombidiform mites as inferred from nucleotide sequences and gene arrangements.Ecol Evol. 2021 Sep 22;11(20):14162-14174. doi: 10.1002/ece3.8133. eCollection 2021 Oct. Ecol Evol. 2021. PMID: 34707848 Free PMC article.
-
The complete mitochondrial genomes of the freshwater mussel Ortmanniana ligamentina (Lamarck, 1819): male and female mitotypes.Mitochondrial DNA B Resour. 2025 May 12;10(6):430-436. doi: 10.1080/23802359.2025.2500528. eCollection 2025. Mitochondrial DNA B Resour. 2025. PMID: 40371128 Free PMC article.
References
-
- Araujo R, Schneider S, Roe KJ, Erpenbeck D, Machordom A. The origin and phylogeny of Margaritiferidae (Bivalvia, Unionoida): a synthesis of molecular and fossil data. Zool Scr. 2017;46:289–307.
-
- Banarescu P (1991) Distribution and dispersal of freshwater animals in North America and Eurasia 2. In: Zoogeography of fresh waters, Aula-Verlag, Wiesbaden, Germany, p 519–1091
-
- Bernt M, Donath A, Jühling F, Externbrink F, Florentz C, Fritzsch G, et al. MITOS: improved de novo metazoan mitochondrial genome annotation. Mol Phylogenet Evol. 2013;69:313–319. - PubMed
-
- Bernt Matthias, Merkle Daniel, Middendorf Martin. Comparative Genomics. Berlin, Heidelberg: Springer Berlin Heidelberg; 2008. An Algorithm for Inferring Mitogenome Rearrangements in a Phylogenetic Tree; pp. 143–157.
Publication types
MeSH terms
LinkOut - more resources
Full Text Sources

