

Evolutionary perspectives on polygenic selection, missing heritability, and GWAS
- PMID: 31201529
- PMCID: PMC8059781
- DOI: 10.1007/s00439-019-02040-6
Evolutionary perspectives on polygenic selection, missing heritability, and GWAS
Abstract
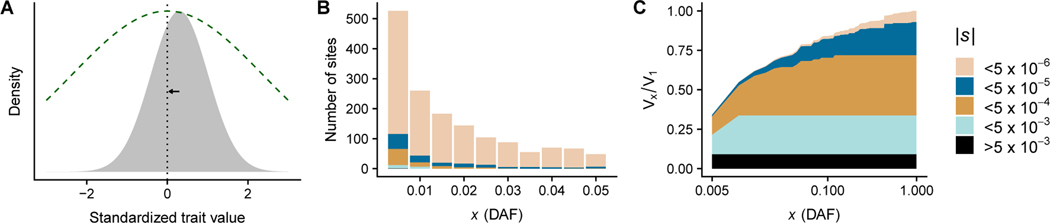
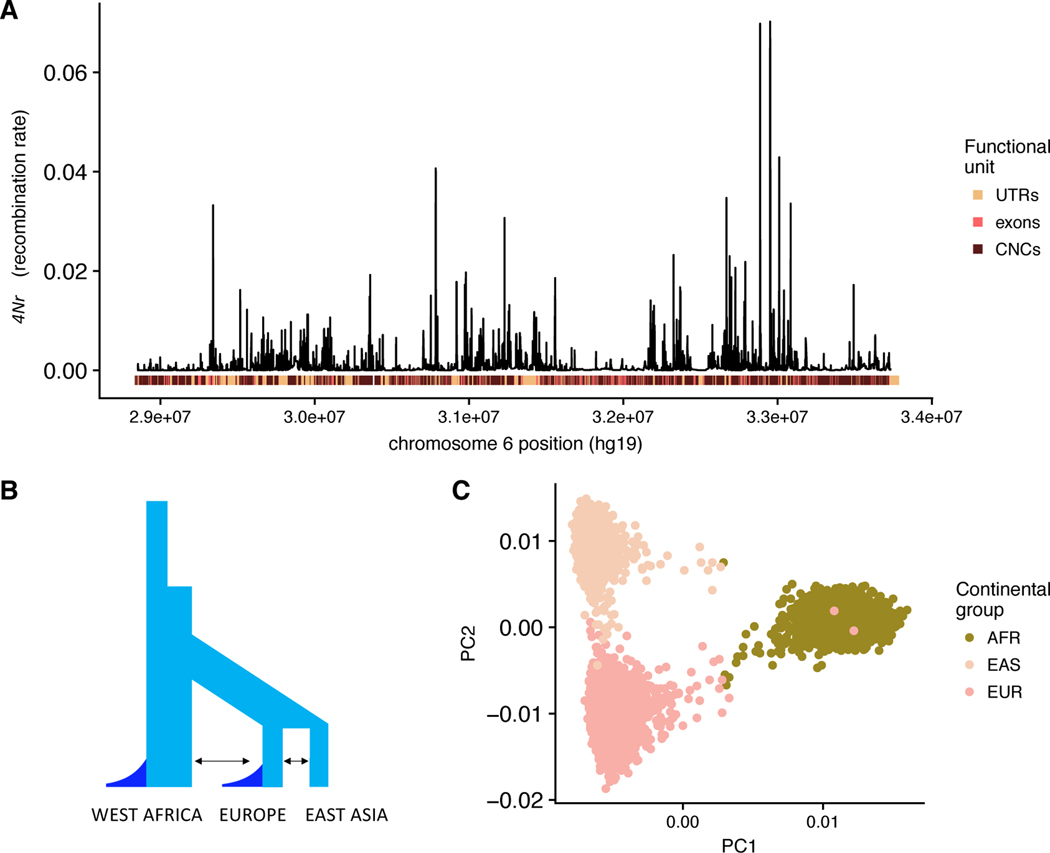
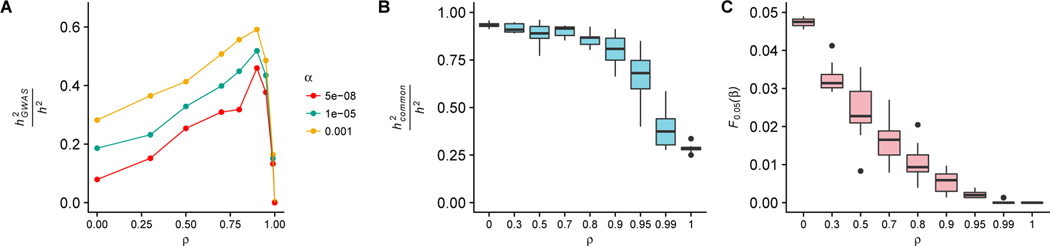
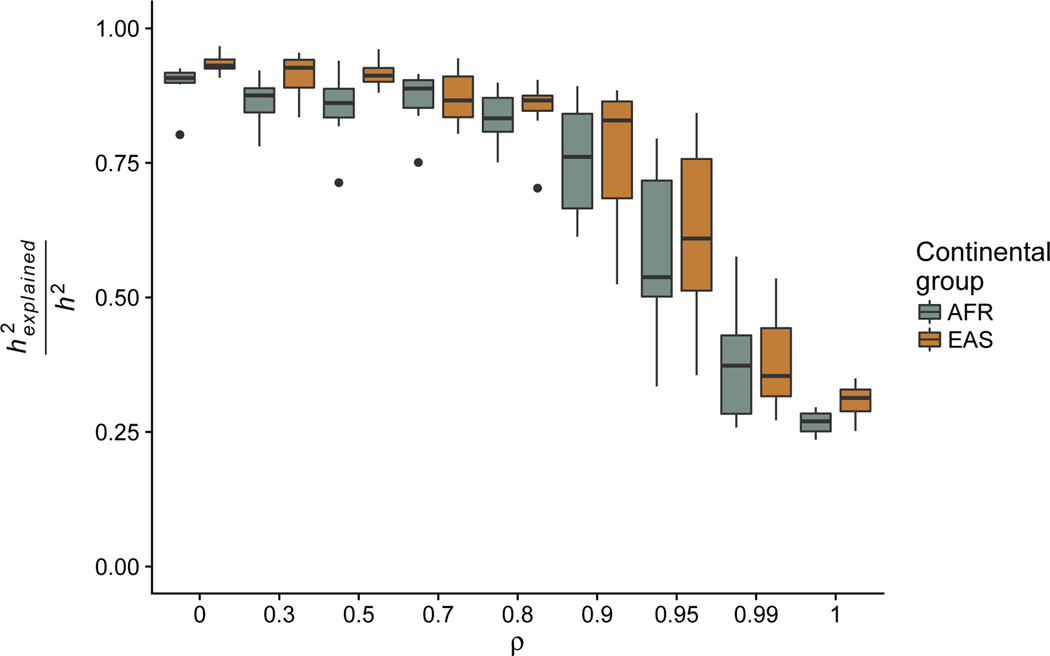
Genome-wide association studies (GWAS) have successfully identified many trait-associated variants, but there is still much we do not know about the genetic basis of complex traits. Here, we review recent theoretical and empirical literature regarding selection on complex traits to argue that "missing heritability" is as much an evolutionary problem as it is a statistical problem. We discuss empirical findings that suggest a role for selection in shaping the effect sizes and allele frequencies of causal variation underlying complex traits, and the limitations of these studies. We then use simulations of selection, realistic genome structure, and complex human demography to illustrate the results of recent theoretical work on polygenic selection, and show that statistical inference of causal loci is sharply affected by evolutionary processes. In particular, when selection acts on causal alleles, it hampers the ability to detect causal loci and constrains the transferability of GWAS results across populations. Last, we discuss the implications of these findings for future association studies, and suggest that future statistical methods to infer causal loci for genetic traits will benefit from explicit modeling of the joint distribution of effect sizes and allele frequencies under plausible evolutionary models.
Conflict of interest statement
Conflict of interest statement
No conflict of interest exists.
Figures
Similar articles
-
The omnigenic model and polygenic prediction of complex traits.Am J Hum Genet. 2021 Sep 2;108(9):1558-1563. doi: 10.1016/j.ajhg.2021.07.003. Epub 2021 Jul 30. Am J Hum Genet. 2021. PMID: 34331855 Free PMC article. Review.
-
Leveraging GWAS for complex traits to detect signatures of natural selection in humans.Curr Opin Genet Dev. 2018 Dec;53:9-14. doi: 10.1016/j.gde.2018.05.012. Epub 2018 Jun 16. Curr Opin Genet Dev. 2018. PMID: 29913353 Review.
-
Population differentiation of polygenic score predictions under stabilizing selection.Philos Trans R Soc Lond B Biol Sci. 2022 Jun 6;377(1852):20200416. doi: 10.1098/rstb.2020.0416. Epub 2022 Apr 18. Philos Trans R Soc Lond B Biol Sci. 2022. PMID: 35430887 Free PMC article.
-
A Selection Operator for Summary Association Statistics Reveals Allelic Heterogeneity of Complex Traits.Am J Hum Genet. 2017 Dec 7;101(6):903-912. doi: 10.1016/j.ajhg.2017.09.027. Am J Hum Genet. 2017. PMID: 29198721 Free PMC article.
-
Inferring the Nature of Missing Heritability in Human Traits Using Data from the GWAS Catalog.Genetics. 2019 Jul;212(3):891-904. doi: 10.1534/genetics.119.302077. Epub 2019 May 13. Genetics. 2019. PMID: 31123044 Free PMC article.
Cited by
-
Genomic Assessment of Cancer Susceptibility in the Threatened Catalina Island Fox (Urocyon littoralis catalinae).Genes (Basel). 2022 Aug 22;13(8):1496. doi: 10.3390/genes13081496. Genes (Basel). 2022. PMID: 36011407 Free PMC article.
-
Meta-analysis: Congruence of genomic and phenotypic differentiation across diverse natural study systems.Evol Appl. 2021 Aug 19;14(9):2189-2205. doi: 10.1111/eva.13264. eCollection 2021 Sep. Evol Appl. 2021. PMID: 34603492 Free PMC article.
-
Estimation of indirect genetic effects and heritability under assortative mating.bioRxiv [Preprint]. 2023 Jul 11:2023.07.10.548458. doi: 10.1101/2023.07.10.548458. bioRxiv. 2023. PMID: 37503158 Free PMC article. Preprint.
-
Genomics of Endometriosis: From Genome Wide Association Studies to Exome Sequencing.Int J Mol Sci. 2021 Jul 7;22(14):7297. doi: 10.3390/ijms22147297. Int J Mol Sci. 2021. PMID: 34298916 Free PMC article. Review.
-
Mosaic patterns of selection in genomic regions associated with diverse human traits.PLoS Genet. 2022 Nov 7;18(11):e1010494. doi: 10.1371/journal.pgen.1010494. eCollection 2022 Nov. PLoS Genet. 2022. PMID: 36342969 Free PMC article.
References
-
- Barton Nicholas H, Etheridge Alison M, and Véber Amandine. The infinitesimal model: Definition, derivation, and implications. Theoretical Population Biology, 118:50–73, 2017. - PubMed
-
- Barton Nick H. The maintenance of polygenic variation through a balance between mutation and stabilizing selection. Genetics Research, 47(3):209–216, 1986. - PubMed
Publication types
MeSH terms
Grants and funding
LinkOut - more resources
Full Text Sources
