. 2019 Dec;56(12):8168-8202.
doi: 10.1007/s12035-019-01643-4. Epub 2019 Jun 14.

Altered Levels of Proteins and Phosphoproteins, in the Absence of Early Causative Transcriptional Changes, Shape the Molecular Pathogenesis in the Brain of Young Presymptomatic Ki91 SCA3/MJD Mouse

Affiliations

Altered Levels of Proteins and Phosphoproteins, in the Absence of Early Causative Transcriptional Changes, Shape the Molecular Pathogenesis in the Brain of Young Presymptomatic Ki91 SCA3/MJD Mouse

Kalina Wiatr et al. Mol Neurobiol. 2019 Dec.

Abstract

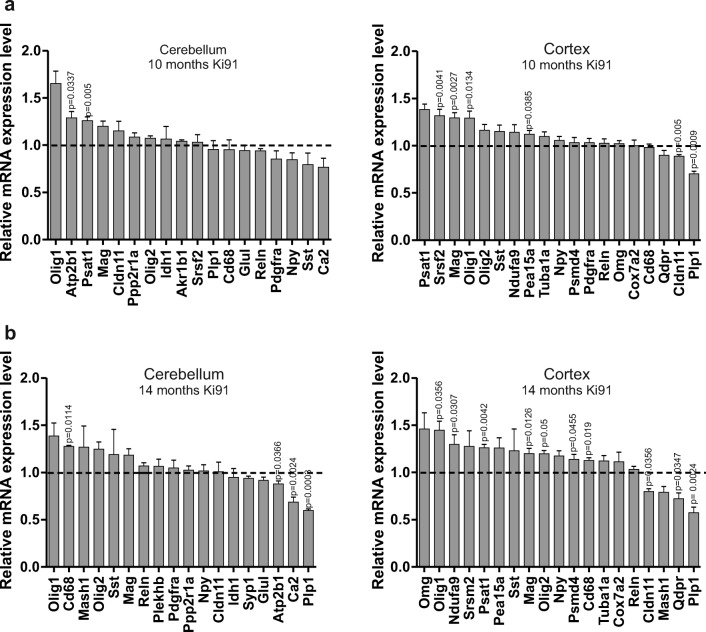
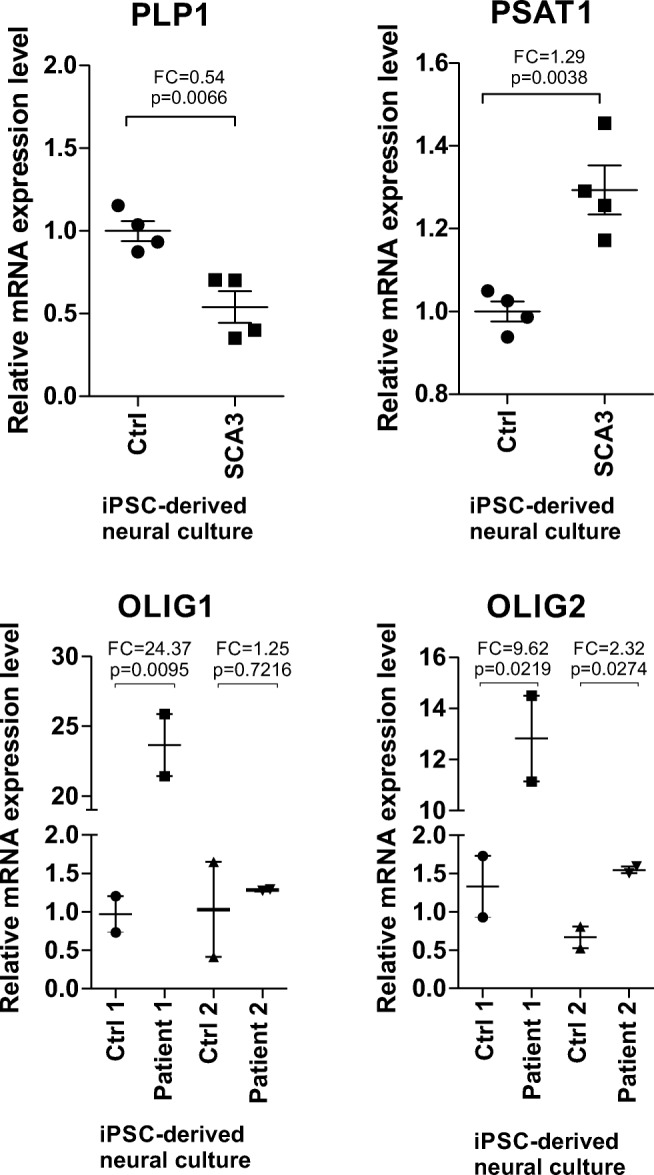
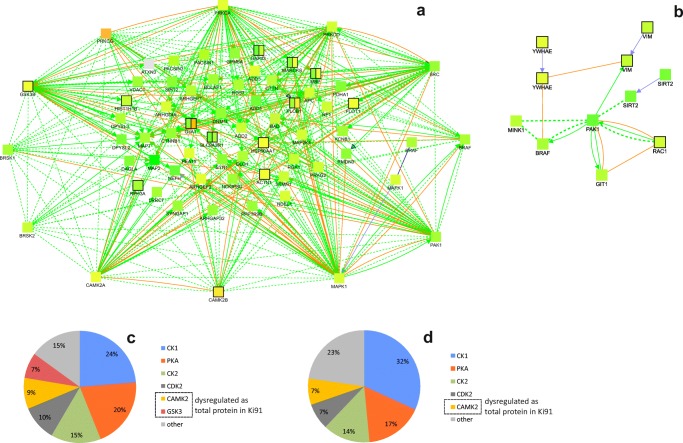
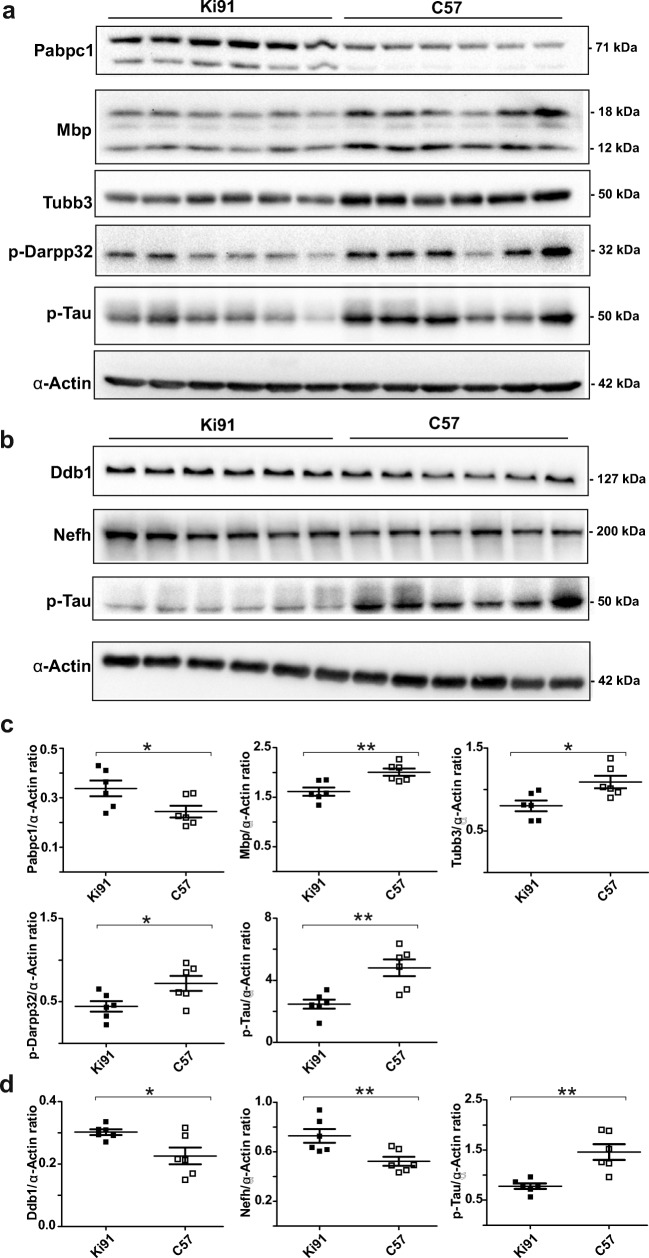
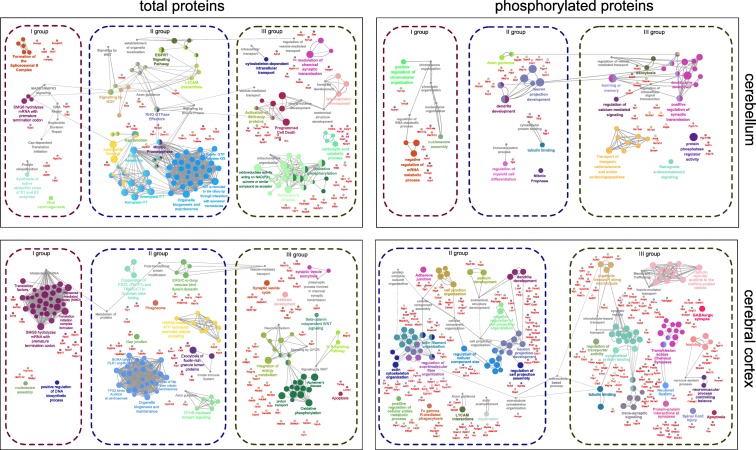
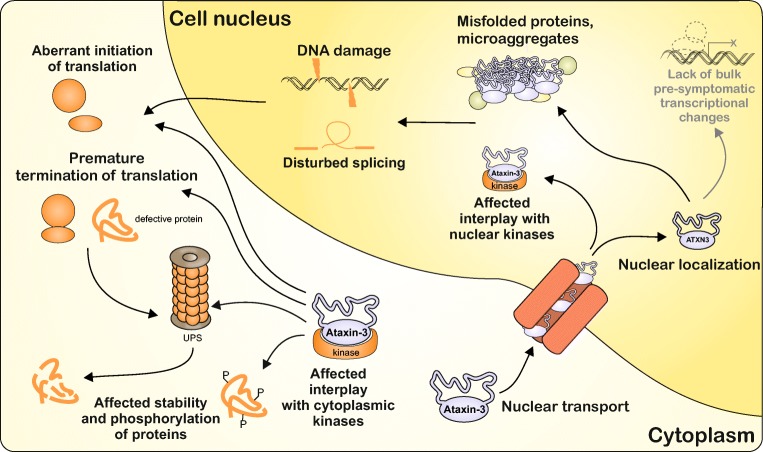
Spinocerebellar ataxia type 3 (SCA3/MJD) is a polyQ neurodegenerative disease where the presymptomatic phase of pathogenesis is unknown. Therefore, we investigated the molecular network of transcriptomic and proteomic triggers in young presymptomatic SCA3/MJD brain from Ki91 knock-in mouse. We found that transcriptional dysregulations resulting from mutant ataxin-3 are not occurring in young Ki91 mice, while old Ki91 mice and also postmitotic patient SCA3 neurons demonstrate the late transcriptomic changes. Unlike the lack of early mRNA changes, we have identified numerous early changes of total proteins and phosphoproteins in 2-month-old Ki91 mouse cortex and cerebellum. We discovered the network of processes in presymptomatic SCA3 with three main groups of disturbed processes comprising altered proteins: (I) modulation of protein levels and DNA damage (Pabpc1, Ddb1, Nedd8), (II) formation of neuronal cellular structures (Tubb3, Nefh, p-Tau), and (III) neuronal function affected by processes following perturbed cytoskeletal formation (Mt-Co3, Stx1b, p-Syn1). Phosphoproteins downregulate in the young Ki91 mouse brain and their phosphosites are associated with kinases that interact with ATXN3 such as casein kinase, Camk2, and kinases controlled by another Atxn3 interactor p21 such as Gsk3, Pka, and Cdk kinases. We conclude that the onset of SCA3 pathology occurs without altered transcript level and is characterized by changed levels of proteins responsible for termination of translation, DNA damage, spliceosome, and protein phosphorylation. This disturbs global cellular processes such as cytoskeleton and transport of vesicles and mitochondria along axons causing energy deficit and neurodegeneration also manifesting in an altered level of transcripts at later ages.

Keywords: Ataxia; Ataxin-3; CAG; Knock-in; MJD; Mouse; Phosphoproteome; PolyQ; Presymptomatic; Proteome; SCA3; Spinocerebellar.


Conflict of interest statement

The authors declare that they have no competing interests.

Figures

Fig. 1
Fig. 1
Motor performance of 2-month-old and 14-month-old Ki91 SCA3/MJD mice. Each behavioral test consisted of one training day and three consecutive days of measurement, except of scoring test. In the elevated beam walk (ad), two parameters “time to turn” and “traverse time” were tested on each rod (diameter of rods is indicated by Ø in mm). Two-month-old Ki91 mice demonstrated significant differences compared to C57BL/6 (C57) in “time to turn” only on the 9-mm rod on the 3rd day of testing (a) and no differences in “traverse time” (c). Fourteen-month-old Ki91 mice needed significantly more “time to turn” on the 28-mm rod on the first day of testing (b) and significantly more “time to traverse” on four rods: 35, 28, 21 and 17 mm (d). There were no significant differences for both 2- and 14-month-old mice in rotarod setup which accelerated from 4 to 40 rpm in 9.5 min (e, i). No significant difference in body weight was observed in 2-month-old Ki91 mice, while 14-month-old Ki91 mice demonstrated significant difference (f, j). In the scoring test, 2-month-old Ki91 mice scored no parameters associated with SCA3 (g), while 14-month-old Ki91 mice scored for characteristic SCA3 phenotypic hallmarks such as: incoordination, gait disturbances, kyphosis, and hind limb clasping (k). In the parallel rod floor test, the number of footslips (m) and locomotor activity (h) was evaluated during 10 min in 2-month-old animals, which demonstrated no differences (d). ANOVA with Bonferroni post hoc test (p ≤ 0.05; total number of biological replicates: n = 36, n = 18 per genotype), error bars: SEM
Fig. 2
Fig. 2
Nuclear localization of ataxin-3 in 2-month-old presymptomatic Ki91 SCA3/MJD mice. The brain sections revealed small number of cells with ataxin-3-positive staining (green; 1H9 antibody) in the white matter of the cerebellum and cerebral cortex where the ataxin-3 localizes mainly in the cell nucleus (blue; Hoechst 33342) of Ki91 mice, whereas in control samples, ataxin-3 localizes uniformly throughout the whole cell. Moreover, the micrograph demonstrates localization of microaggregates in the nucleus of cells in Ki91 mice. The figure demonstrates micrographs of three cells per genotype and brain region; cerebellum of C57BL/6 (C57) (ac), cerebellum of Ki91 mice (df) cortex of C57BL/6 (gi), and cortex of Ki91 mice (jl). Each cell is presented as green and blue fluorescent channel in addition to micrograph with merged channels
Fig. 3
Fig. 3
qPCR analysis of RNAseq results reveals lack of transcriptional changes related to mutant ataxin-3 in 2-month-old presymptomatic mice. Genes identified by RNAseq were analyzed by qPCR using control brain tissue collected from C57BL/6 (C57) and FVB mouse strains to exclude the influence of the genetic background (BG) on the level of gene expression. The differences in expression levels of genes would be considered statistically significant if the tested gene demonstrated p ≤ 0.01 for each of the brain tissue controls (unpaired Student’s t test; error bars: SEM; total number of samples n = 12, n = 4 per experimental group). However, none of the tested genes from the a cerebellum and b cerebral cortex consistently reached such significance value across controls and brain tissues. The qPCR results indicate that the differences in expression level measured by RNAseq are the result of genetic background and are not the result of the influence of the mutant ataxin-3. Hence, the presymptomatic cerebellum and cortex from Ki91 mouse do not demonstrate SCA3 causative changes in mRNA levels
Fig. 4
Fig. 4
qPCR analysis of RNAseq results reveals lack of transcriptional changes related to mutant ataxin-3 in 4-month-old Ki91 mouse. The presymptomatic changes in mRNA levels of genes identified by RNAseq were examined by qPCR, however using brain tissue from 4-month-old Ki91 mice. The differences in expression levels of genes for the a cerebellum and b cerebral cortex did not reach consistent statistical significance across controls and tissues (p ≤ 0.01 for each of the brain tissue controls in unpaired Student’s t test; total number of samples n = 12, n = 4 per tissue; C57BL6 (C57) or FVB mouse tissue was the control for Ki91 mouse tissues; error bars: SEM)
Fig. 5
Fig. 5
Transcriptomic changes occur in 10- and 14-month-old symptomatic homozygous Ki91 SCA3/MJD mice and are also related to changes associated with particular cell types. In 10-month-old Ki91 mice, the analysis revealed the elevated level of Psat1 and Olig1 in the cerebellum and cortex (a). Mag gene related to oligodendrocytes revealed upregulated level in the cortex. Plp1 demonstrated decreased level in the cortex of 10-month-old Ki91 mice suggesting loss of adult oligodendrocytes during disease progression. Fourteen-month-old Ki91 mice demonstrate more pronounced alterations in tested mRNA levels (b). In the cerebellum, the Cd68, a microglial marker, demonstrated upregulated expression level. The metabolism-associated genes, Apt2b1 and Ca2, are downregulated. The gene highly expressed in adult oligodendrocytes Plp1 is also downregulated in the cerebellum. In the cortex, the level of transcripts, characteristic for oligodendrocyte precursors, is upregulated (Olig1, Olig2) and, on the other hand, decreased the level of transcripts characteristic for adult oligodendrocytes (Plp1 and Cldn11) and also increased the level of Mag. We did not detect transcriptional changes characteristic for neuronal markers both in 10- and 14-month-old Ki91 mouse brains. We also observe the changed level of genes characteristic for metabolism (Psat1, Qdpr, and Psmd4). p ≤ 0.05, using unpaired Student’s t test; total number of samples n = 8 per age per cerebellum or cortex; n = 4 for the control group per individual tissue of 10 or 14 months, n = 4 for the SCA3 group per tissue of 10-month-old. In the case of 14-month-old Ki91 mouse, n = 3 or n = 4 depending on the gene tested: n = 3 in the Ki91 mouse group for the following genes in the cerebellum: Srsf2, Ppp2r1a, Idh1, Glul, Atp2b1, Ca2, Plp1; n = 3 in Ki91 mouse for the following genes in the cortex: Olig1, Olig2, Cd68, Cox7a2, Reln, Cldn11, Mash, Plp1; n = 4 in the Ki91 mouse group in the cerebellum: Olig1, Cd68, Mash1, Olig2, Sst, Mag, Reln, Plekhb1, Pdgfra, Npy, Cldn11; n = 4 in the Ki91 mouse group for the following genes in the cortex: Omg, Ndufa9, Srsf2, Psat1, Pea15a, Sst, Mag, Npy, Psmd4, Tuba1a, Qdpr (error bars: SEM)
Fig. 6
Fig. 6
Human SCA3 neural cultures demonstrated mRNA changes similar to late changes in Ki91 SCA3/MJD mouse. iPSC-derived neural cultures from SCA3 patients were tested for dysregulated expression of PLP1, OLIG1, and OLIG2 (classically associated with oligodendrocytes and in neuronal precursors) and for dysregulation of PSAT1 which is associated with serine and glycine metabolism. The marker of precursors of oligodendrocytes and neurons, Olig1, was upregulated in one patient and Olig2 was upregulated in neural cultures from both patients. PLP1, which is highly expressed in mature oligodendrocyte, was decreased in SCA3 patients. The PSAT1 marker was slightly upregulated in both patients. Provisional p values (unpaired Student’s t test; two cell culture technical replicates per patient) were calculated for the evaluation of differences between patient and control; however, the statistical criteria for using t test were not met due to a small number of available patients (patients n = 2; unaffected patient controls n = 2). PLP1 FC for both patients—0.54, PSAT1 FC for both patients—1.29, OLIG1 patient 1 FC—24.37, patient 2 FC—1.25; OLIG2 patient 1 FC—9.62, patient 2 FC—2.32 (error bars: SEM)
Fig. 7
Fig. 7
Dysregulation of protein phosphorylation in Ki91 SCA3/MJD mouse brains: kinases and their substrates. Network of dysregulated kinases and their substrates was generated with the CPDB tool: induced network modules using gene names coding for dysregulated proteins and phosphoproteins (high and medium confidence), number of dysregulated proteins and phosphoproteins in the cerebellum n = 175; in the cerebral cortex n = 486, four biological replicates (Z-score calculated with the binomial proportions test). The gradient of red color is for upregulated proteins, green color for downregulated proteins. Nonframed squares denote proteins with altered phosphorylation; one-color, framed squares denote total dysregulated proteins; and two-color, framed squares denote proteins, which are dysregulated both at phosphorylation and total levels (left part of the square—phosphorylation, right part of the square—total level). Orange arrows are for biochemical reactions and green arrows for physical interactions. Kinases with the highest number of dysregulated substrates are arranged in the outer space of the network. There are several such kinases identified in the cerebral cortex (a) and one kinase: Pak1 in the cerebellum (b). In the cerebral cortex, the substrate, which is modified by several different dysregulated kinases, is Mapt and Map2, both regulating microtubule functions. Further analysis of peptides with modified phosphosites using PHOSIDA revealed additional kinases (CKs, Pka, Cdks, Camk2a) common for the cerebellum and cerebral cortex, which phosphorylate the highest number of dysregulated phosphoproteins in the cerebral cortex, n = 335 (c), and cerebellum, n = 82 (d); total number of biological replicates: n = 8, n = 4 per genotype
Fig. 8
Fig. 8
Western blotting analysis of proteins and phosphoproteins dysregulated in presymptomatic 2-month-old Ki91 mice. Western blot analysis confirmed increased levels of Pabpc1 (p = 0.013; two-sample t test) and decreased levels of Mbp (p = 0.0012; two-sample t test), Tubb3 (p = 0.011; two-sample t test), p-Darpp32 (p = 0.045; two-sample t test), and p-Tau (p = 0.0012; two-sample t test) in the cerebral cortex of 2-month-old Ki91 mice (a, c). In the cerebellum of Ki91 animals, increased levels of Ddb1 (p = 0.011; two-sample t test) and Nefh (p = 0.007; two-sample t test) and decreased levels of p-Tau (p = 0.0035; two-sample t test) were demonstrated (b, d). α-Actin was used as a loading control. N = 6 per genotype, error bars: SEM. All experiments were performed in three technical replicates
Fig. 9
Fig. 9
Major groups of affected biological processes based on the proteomic and phosphoproteomic analysis in Ki91 SCA3/MJD mouse brains. A network of GO terms and pathways (two-sided hypergeometric test with Bonferroni step-down correction, p value cutoff = 0.05, tree interval 3–5, kappa score = 0.5) was generated for dysregulated proteins and phosphoproteins in the cerebellum and cerebral cortex with ClueGO (Cytoscape) using organic layout. GO terms and pathways were arranged into three major groups described in chapters: “Disturbed mechanism of modulation of protein levels and DNA damage,” “Disturbed formation of neuronal cellular structures: organelles and macromolecules,” and “Neuronal cell functionality affected by processes following perturbed cytoskeletal (microtubule) complex formation.” Proteins were assigned to GO terms and pathways based on ClueGO analysis (genes with corresponding functions). The same analysis, however, with no arrangement is included as Supplementary Fig. 3 in order to enable free interpretation of data. The lists of GO terms and pathways with p values are included in Tables 7, 8, 9, 10, 11, and 12 and Supplementary Tables 3–5
Fig. 10
Fig. 10
The diagram of processes affected by molecules identified in young Ki91 mouse brain during the early SCA3/MJD pathogenesis

Similar articles

Cited by

References

    1. Kawaguchi Y, Okamoto T, Taniwaki M, Aizawa M, Inoue M, Katayama S, Kawakami H, Nakamura S, Nishimura M, Akiguchi I, Kimura J, Narumiya S, Kakizuka A. CAG expansions in a novel gene for Machado-Joseph disease at chromosome 14q32.1. Nat Genet. 1994;8:221–228. doi: 10.1038/ng1194-221. - DOI - PubMed
    1. Riess O, Rüb U, Pastore A, Bauer P, Schöls L. SCA3: neurological features, pathogenesis and animal models. Cerebellum. 2008;7:125–137. doi: 10.1007/s12311-008-0013-4. - DOI - PubMed
    1. Winborn BJ, Travis SM, Todi SV, Scaglione KM, Xu P, Williams AJ, Cohen RE, Peng J, Paulson HL. The deubiquitinating enzyme ataxin-3, a polyglutamine disease protein, edits lys63 linkages in mixed linkage ubiquitin chains. J Biol Chem. 2008;283:26436–26443. doi: 10.1074/jbc.M803692200. - DOI - PMC - PubMed
    1. Todi SV, Scaglione KM, Blount JR, Basrur V, Conlon KP, Pastore A, Elenitoba-Johnson K, Paulson HL. Activity and cellular functions of the deubiquitinating enzyme and polyglutamine disease protein ataxin-3 are regulated by ubiquitination at lysine 117. J Biol Chem. 2010;285:39303–39313. doi: 10.1074/jbc.M110.181610. - DOI - PMC - PubMed
    1. Weishäupl D, Schneider J, Peixoto Pinheiro B, Ruess C, Dold SM, von Zweydorf F, Gloeckner CJ, Schmidt J, Riess O, Schmidt T. Physiological and pathophysiological characteristics of ataxin-3 isoforms. J Biol Chem. 2019;294:644–661. doi: 10.1074/jbc.RA118.005801. - DOI - PMC - PubMed

LinkOut - more resources