Randomized Controlled Trial
. 2019 Sep;221(3):233.e1-233.e16.
doi: 10.1016/j.ajog.2019.06.004. Epub 2019 Jun 12.

Pain and activity after vaginal reconstructive surgery for pelvic organ prolapse and stress urinary incontinence

Collaborators, Affiliations
Randomized Controlled Trial

Pain and activity after vaginal reconstructive surgery for pelvic organ prolapse and stress urinary incontinence

Matthew D Barber et al. Am J Obstet Gynecol. 2019 Sep.

Abstract

Background: Little is known about short- and long-term pain and functional activity after surgery for pelvic organ prolapse.

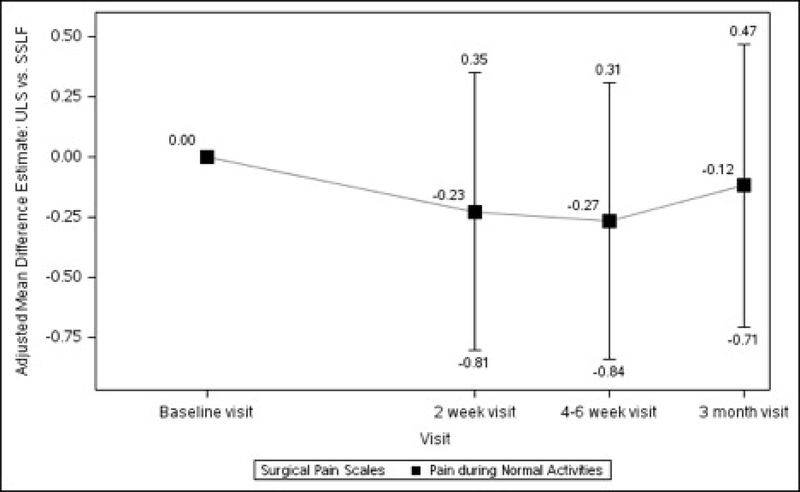
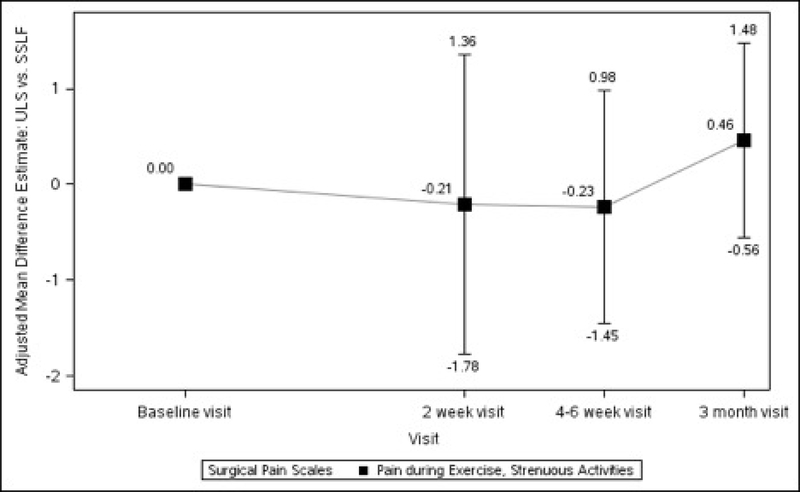
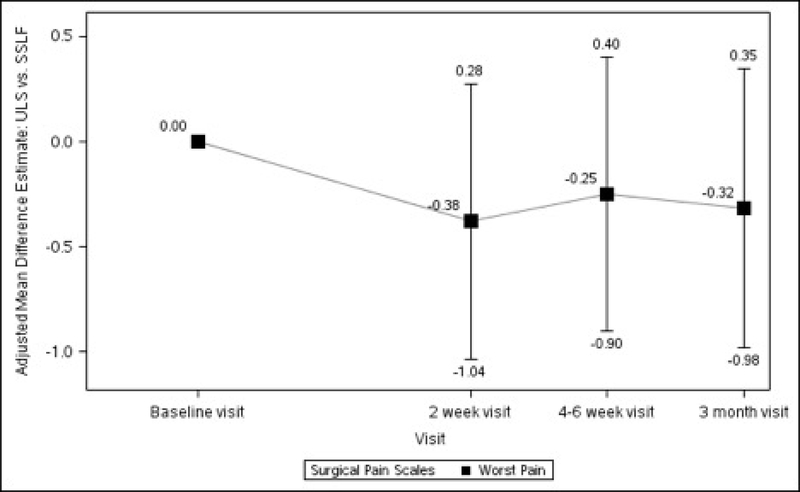
Objective: The objectives of the study were to describe postoperative pain and functional activity after transvaginal native tissue reconstructive surgery with apical suspension and retropubic synthetic midurethral sling and to compare these outcomes between patients receiving 2 common transvaginal prolapse repairs, uterosacral ligament, and sacrospinous ligament vaginal vault suspension.

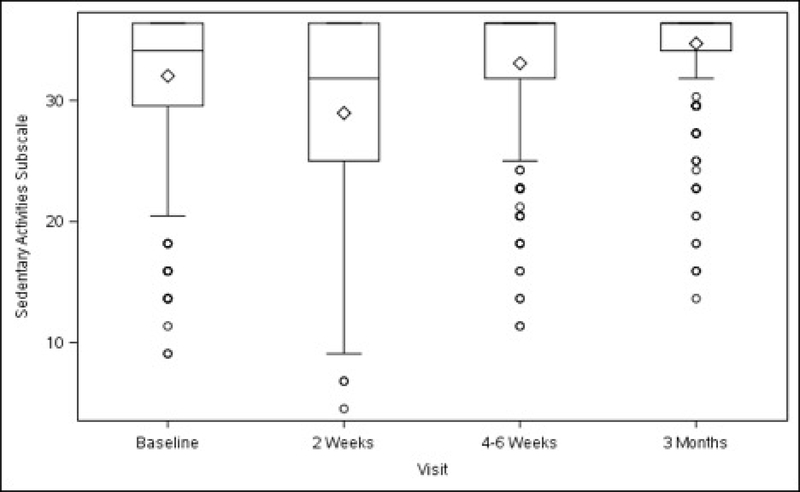
Study design: This planned secondary analysis of a 2 × 2 factorial randomized trial included 374 women randomized to receive uterosacral (n = 188) or sacrospinous (n = 186) vaginal vault suspension to treat both stages 2-4 apical vaginal prolapse and stress urinary incontinence between 2008 and 2013 at 9 medical centers. Participants were also randomized to receive perioperative pelvic muscle therapy or usual care. All patients received transvaginal native tissue repairs and a midurethral sling. Participants completed the Surgical Pain Scales (0-10 numeric rating scales; higher scores = greater pain) and Activity Assessment Scale (0-100; higher score = higher activity) prior to surgery and at 2 weeks, 4-6 weeks, and 3 months postoperatively. The MOS 36-item Short-Form Health Survey was completed at baseline and 6, 12, and 24 months after surgery; the bodily pain, physical functioning, and role-physical subscales were used for this analysis (higher scores = less disability). Self-reported pain medication use was also collected.

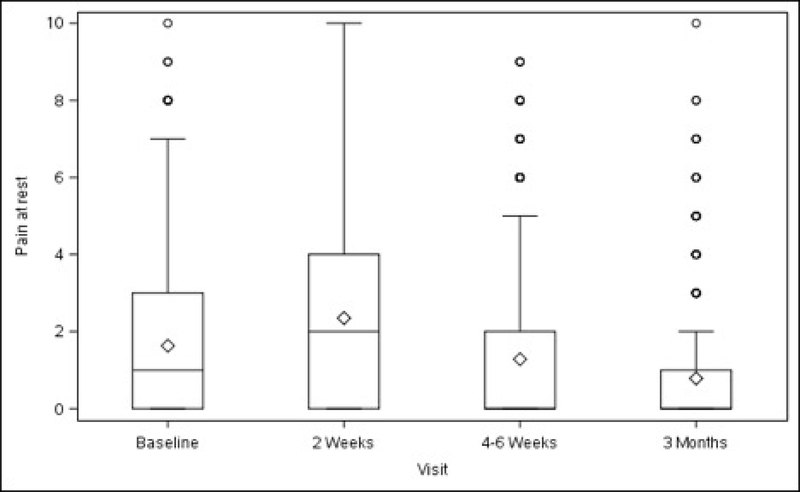
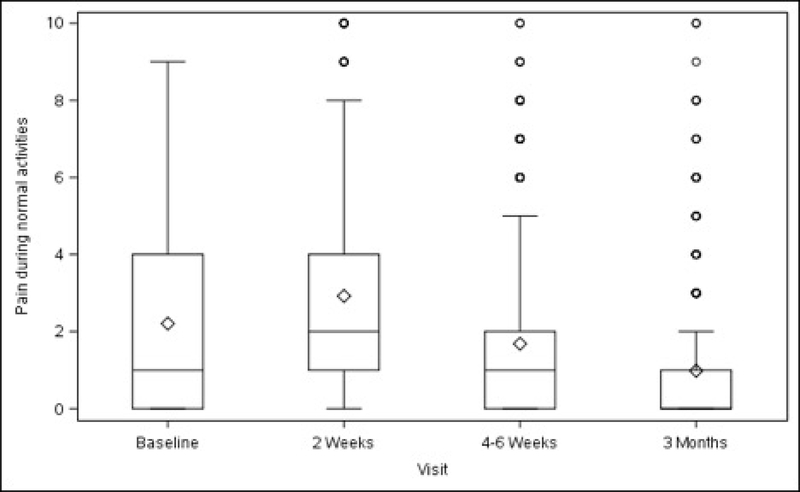
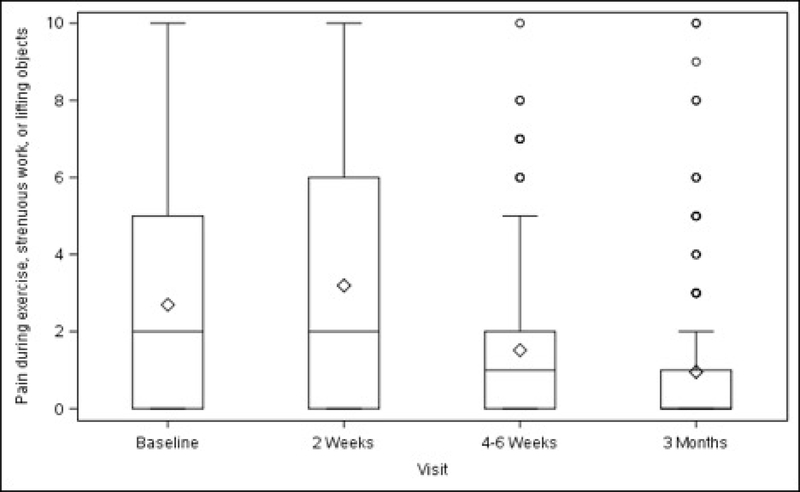
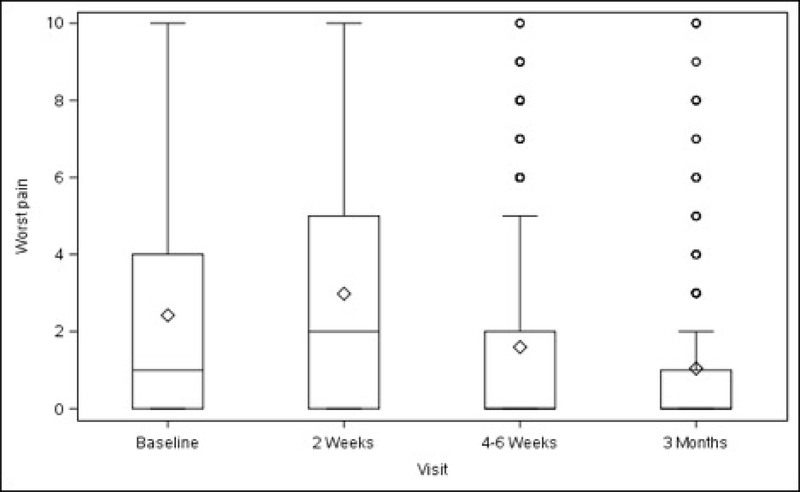
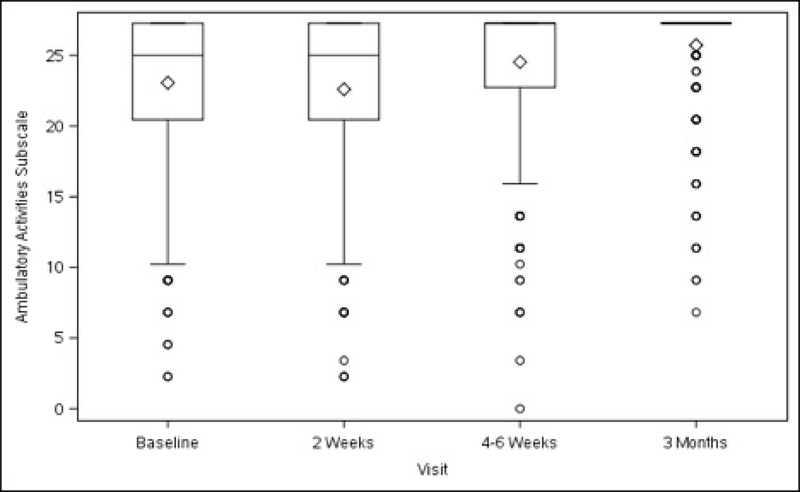
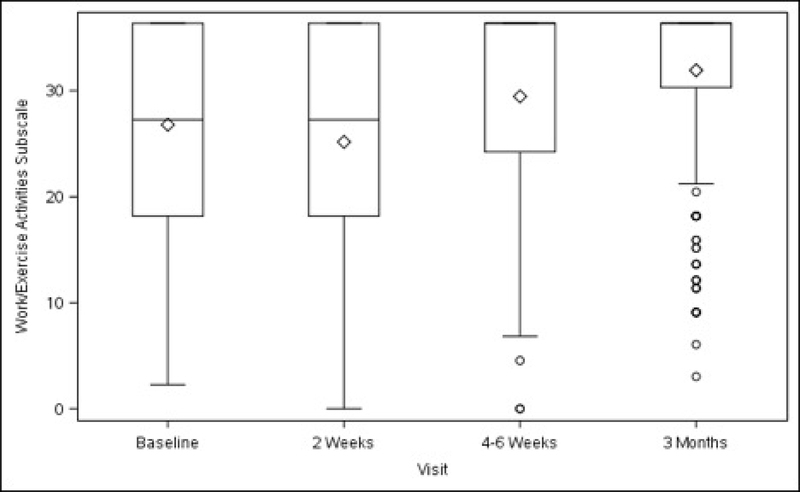
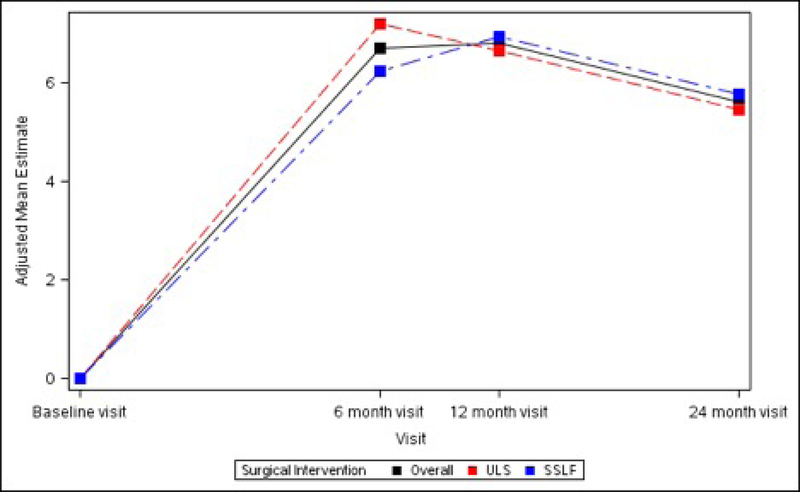
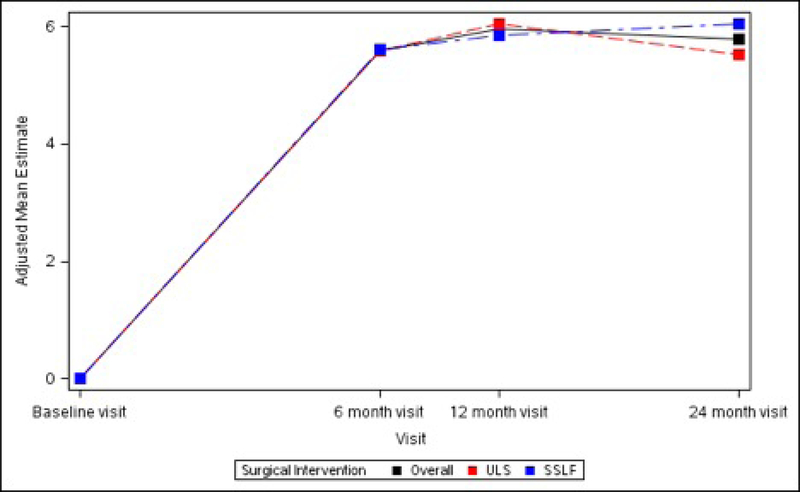
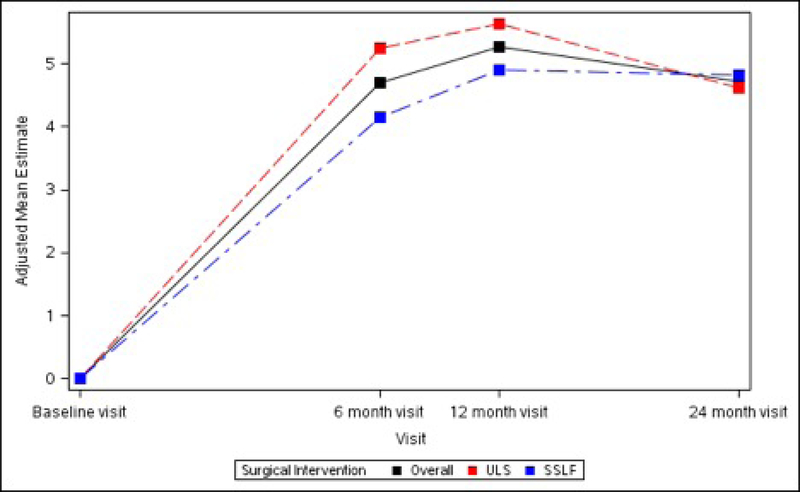
Results: Before surgery, average pain at rest and during normal activity were (adjusted mean ± SE) 2.24 ± 0.23 and 2.76 ± 0.25; both increased slightly from baseline at 2 weeks (+0.65, P = .004, and +0.74, P = .007, respectively) and then decreased below baseline at 3 months (-0.87 and -1.14, respectively, P < .001), with no differences between surgical groups. Pain during exercise/strenuous activity and worst pain decreased below baseline levels at 4-6 weeks (-1.26, P = .014, and -0.95, P = .002) and 3 months (-1.97 and -1.50, P < .001) without differences between surgical groups. Functional activity as measured by the Activity Assessment Scale improved from baseline at 4-6 weeks (+9.24, P < .001) and 3 months (+13.79, P < .001). The MOS 36-item Short-Form Health Survey Bodily Pain, Physical Functioning, and Role-Physical Scales demonstrated significant improvements from baseline at 6, 12, and 24 months (24 months: +5.62, +5.79, and +4.72, respectively, P < .001 for each) with no differences between groups. Use of narcotic pain medications was reported by 14.3% of participants prior to surgery and 53.7% at 2 and 26.1% at 4-6 weeks postoperatively; thereafter use was similar to baseline rates until 24 months when it decreased to 6.8%. Use of nonnarcotic pain medication was reported by 48.1% of participants prior to surgery, 68.7% at 2 weeks, and similar to baseline at 3 months; thereafter use dropped steadily to 26.6% at 2 years. Uterosacral ligament suspension resulted in less new or worsening buttock pain than sacrospinous suspension at 4-6 weeks postoperatively (4.6% vs 10.5%, P = .043) but no difference in groin or thigh pain.

Conclusion: Pain and functional activity improve for up to 2 years after native tissue reconstructive surgery with uterosacral or sacrospinous vaginal vault suspension and midurethral sling for stages 2-4 pelvic organ prolapse. On average, immediate postoperative pain is low and improves to below baseline levels by 4-6 weeks.

Keywords: functional activity; pelvic floor disorders; pelvic organ prolapse; postoperative pain; sacrospinous ligament fixation; stress urinary incontinence; uterosacral ligament suspension; vaginal reconstructive surgery.


Conflict of interest statement

Disclosure of potential Conflicts of Interest: Barber, royalties from Elsevier and UpToDate; Brubaker, editorial stipends from JAMA, Female Pelvic Medicine and Reconstructive Surgery journal and UpToDate, honorarium from American Board of Obstetrics and Gynecology; Dyer, research funding from Pelvalon, Sunnyvale CA; Nygaard, editorial stipend from Elsevier; Gantz – Research funding received from Boston Scientific on behalf of the NICHD Pelvic Floor Disorders Network; the following authors have no potential conflicts of interest: Wai, Ellington

Figures

Figures 1A–1D.
Figures 1A–1D.. Surgical Pain Scales from Baseline to 3 Months After Surgery (Unadjusted)
Figure 1A. Pain at Rest Figure 1B. Pain during Normal Activities Figure 1C. Pain during exercise, strenuous work, or lifting objects Figure 1D. Worst Pain
Figures 1A–1D.
Figures 1A–1D.. Surgical Pain Scales from Baseline to 3 Months After Surgery (Unadjusted)
Figure 1A. Pain at Rest Figure 1B. Pain during Normal Activities Figure 1C. Pain during exercise, strenuous work, or lifting objects Figure 1D. Worst Pain
Figures 1A–1D.
Figures 1A–1D.. Surgical Pain Scales from Baseline to 3 Months After Surgery (Unadjusted)
Figure 1A. Pain at Rest Figure 1B. Pain during Normal Activities Figure 1C. Pain during exercise, strenuous work, or lifting objects Figure 1D. Worst Pain
Figures 1A–1D.
Figures 1A–1D.. Surgical Pain Scales from Baseline to 3 Months After Surgery (Unadjusted)
Figure 1A. Pain at Rest Figure 1B. Pain during Normal Activities Figure 1C. Pain during exercise, strenuous work, or lifting objects Figure 1D. Worst Pain
Figures 2A–2D.
Figures 2A–2D.. Difference in Surgical Pain Scale scores between surgical interventions, from Baseline to 3 Months After Surgery, Modeling Outcome as Change from Baseline1
Figure 2A. Pain at Rest Difference between Surgical Interventions across Visits Figure 2B. Pain during Normal Activities Difference between Surgical Interventions across Visits Figure 2C. Pain during Exercise, Strenuous Activities Difference between Surgical Interventions across Visits Figure 2D. Worst Pain Difference between Surgical Interventions across Visits 1The analyses for each outcome of interest were performed on the modified intent to treat population (mITT) which includes all participants that were eligible, gave consent, were randomized to both the PMT and surgical interventions, and for whom the outcome was assessed (i.e. non-missing). For analyses assessing each outcome’s change from baseline to a follow-up visit, all adjusted means, mean differences, standard errors, 95% confidence intervals, and p-values for outcomes were obtained from general linear models adjusting for randomized surgical intervention, randomized PMT intervention, visit, interaction between visit and randomized surgical intervention, interaction between visit and randomized PMT intervention, and three-way interaction between visit and randomized surgical intervention and randomized PMT intervention, concomitant hysterectomy, age at surgical randomization, race (white, black, other), ethnicity, public insurance, and private insurance while controlling for a random surgeon effect (if found statistically significant) and repeated subject visits. All tests were conducted at a significance level of 0.05.
Figures 3A–3D.
Figures 3A–3D.. Activity Assessment Scales from Baseline to 3 Months After Surgery (Unadjusted)
Figure 3A. Activity Assessment Scale Total Figure 3B. Sedentary Activities Subscale Figure 3C. Ambulatory Activities Subscale Figure 3D. Work/Exercise Activities Subscale
Figures 3A–3D.
Figures 3A–3D.. Activity Assessment Scales from Baseline to 3 Months After Surgery (Unadjusted)
Figure 3A. Activity Assessment Scale Total Figure 3B. Sedentary Activities Subscale Figure 3C. Ambulatory Activities Subscale Figure 3D. Work/Exercise Activities Subscale
Figures 3A–3D.
Figures 3A–3D.. Activity Assessment Scales from Baseline to 3 Months After Surgery (Unadjusted)
Figure 3A. Activity Assessment Scale Total Figure 3B. Sedentary Activities Subscale Figure 3C. Ambulatory Activities Subscale Figure 3D. Work/Exercise Activities Subscale
Figures 3A–3D.
Figures 3A–3D.. Activity Assessment Scales from Baseline to 3 Months After Surgery (Unadjusted)
Figure 3A. Activity Assessment Scale Total Figure 3B. Sedentary Activities Subscale Figure 3C. Ambulatory Activities Subscale Figure 3D. Work/Exercise Activities Subscale
Figures 4A – 4C.
Figures 4A – 4C.. Long-term Pain and Activity After Surgery SF36 Scale Changes from Baseline to 3 Months After Surgery Modeling Outcome as Change from Baseline1
Figure 4A. SF-36 Bodily Pain Scale Change from Baseline across Visits by Surgical Interventions Figure 4B. SF-36 Physical Functioning Scale Change from Baseline across Visits by Surgical Interventions Figure 4C. SF-36 Role Physical Scale Change from Baseline across Visits by Surgical Interventions 1The analyses for each outcome of interest were performed on the modified intent to treat population (mITT) which includes all participants that were eligible, gave consent, were randomized to both the PMT and surgical interventions, and for whom the outcome was assessed (i.e. non-missing). For analyses assessing each outcome’s change from baseline to a follow-up visit, all adjusted means, mean differences, standard errors, 95% confidence intervals, and p-values for outcomes were obtained from general linear models adjusting for randomized surgical intervention, randomized PMT intervention, visit, interaction between visit and randomized surgical intervention, interaction between visit and randomized PMT intervention, and three-way interaction between visit and randomized surgical intervention and randomized PMT intervention, concomitant hysterectomy, age at surgical randomization, race (white, black, other), ethnicity, public insurance, and private insurance while controlling for a random surgeon effect (if found statistically significant) and repeated subject visits. All tests were conducted at a significance level of 0.05.

Comment in

Similar articles

Cited by

References

    1. Wu JM, Matthews CA, Conover MM, Pate V, Jonsson Funk M. Lifetime risk of stress urinary incontinence or pelvic organ prolapse surgery. Obstet Gynecol 2014;123:1201–6. - PMC - PubMed
    1. FDA. Urogynecologic surgical mesh:update on the safety and effectiveness of transvaginal mesh placement for pelvic organ prolapse, 2011.
    1. Boyles SH, Weber AM, Meyn L. Procedures for pelvic organ prolapse in the United States, 1979–1997. Am J Obstet Gynecol 2003;188:108–15. - PubMed
    1. Brown JS, Waetjen LE, Subak LL, Thom DH, Van den Eeden S, Vittinghoff E. Pelvic organ prolapse surgery in the United States, 1997. Am J Obstet Gynecol 2002;186:712–6. - PubMed
    1. Olsen AL, Smith VJ, Bergstrom JO, Colling JC, Clark AL. Epidemiology of surgically managed pelvic organ prolapse and urinary incontinence. Obstet Gynecol 1997;89:501–6. - PubMed

Publication types