Review
. 2019 Oct:29:239-247.
doi: 10.1016/j.copsyc.2019.05.003. Epub 2019 May 21.

Cortico-cerebellar networks for visual attention and working memory

Affiliations
Review

Cortico-cerebellar networks for visual attention and working memory

James A Brissenden et al. Curr Opin Psychol. 2019 Oct.

Abstract

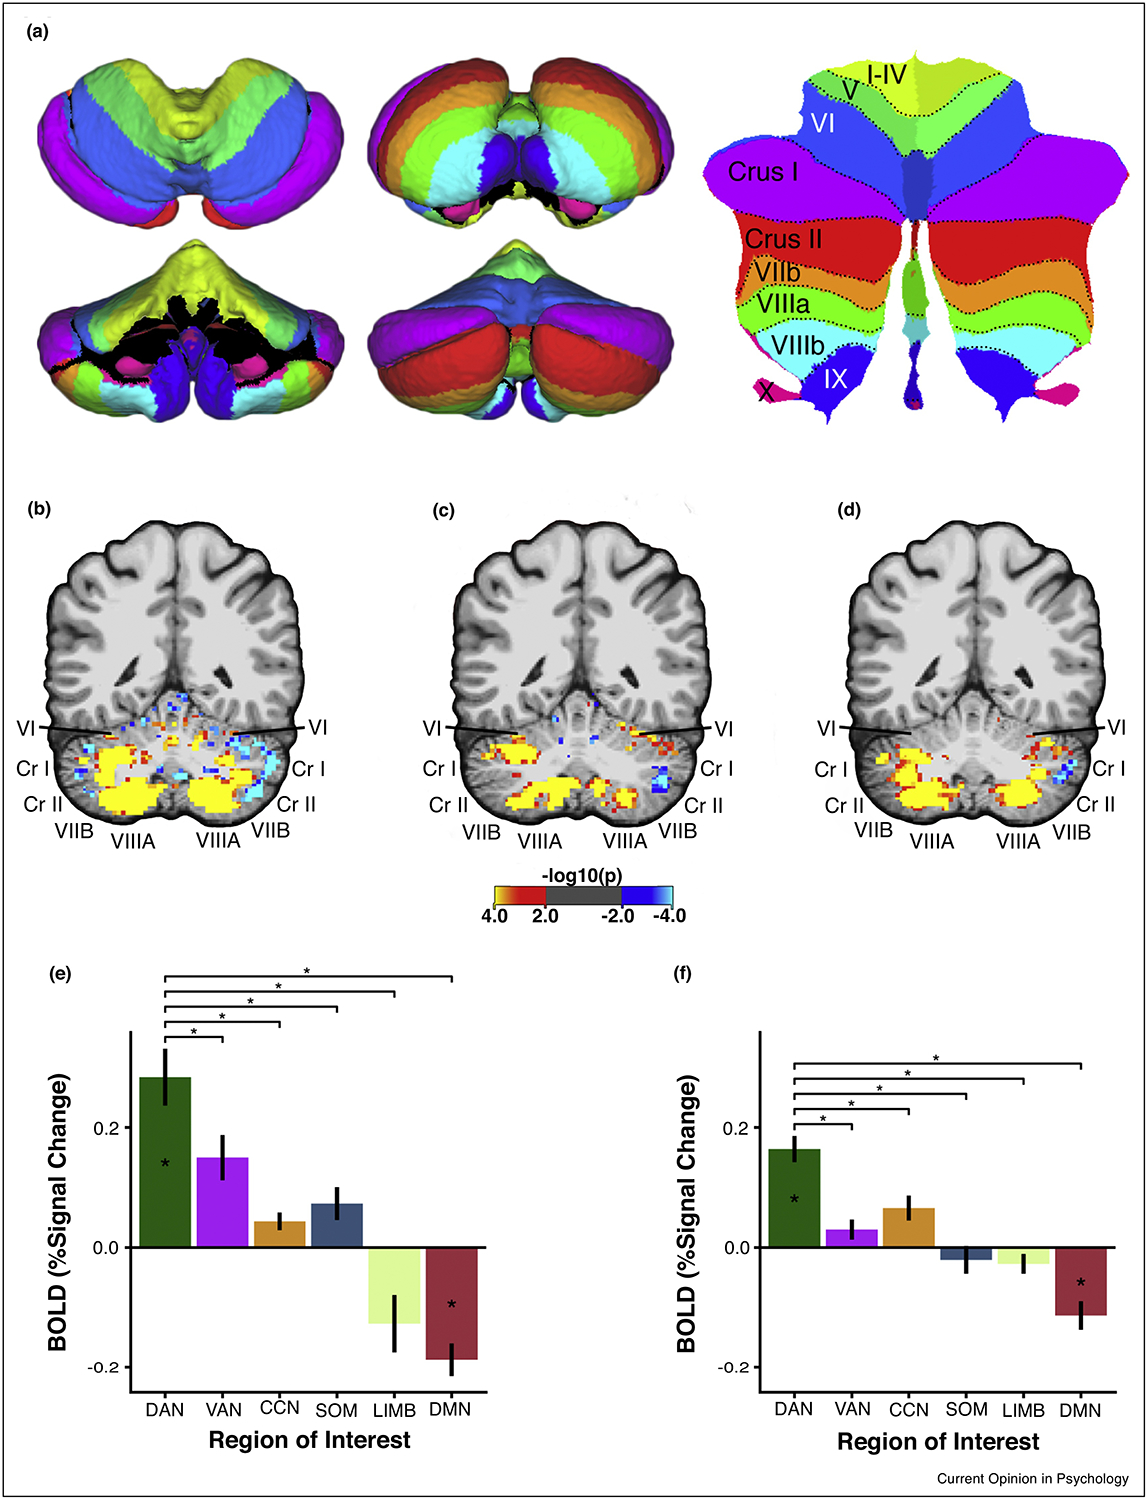
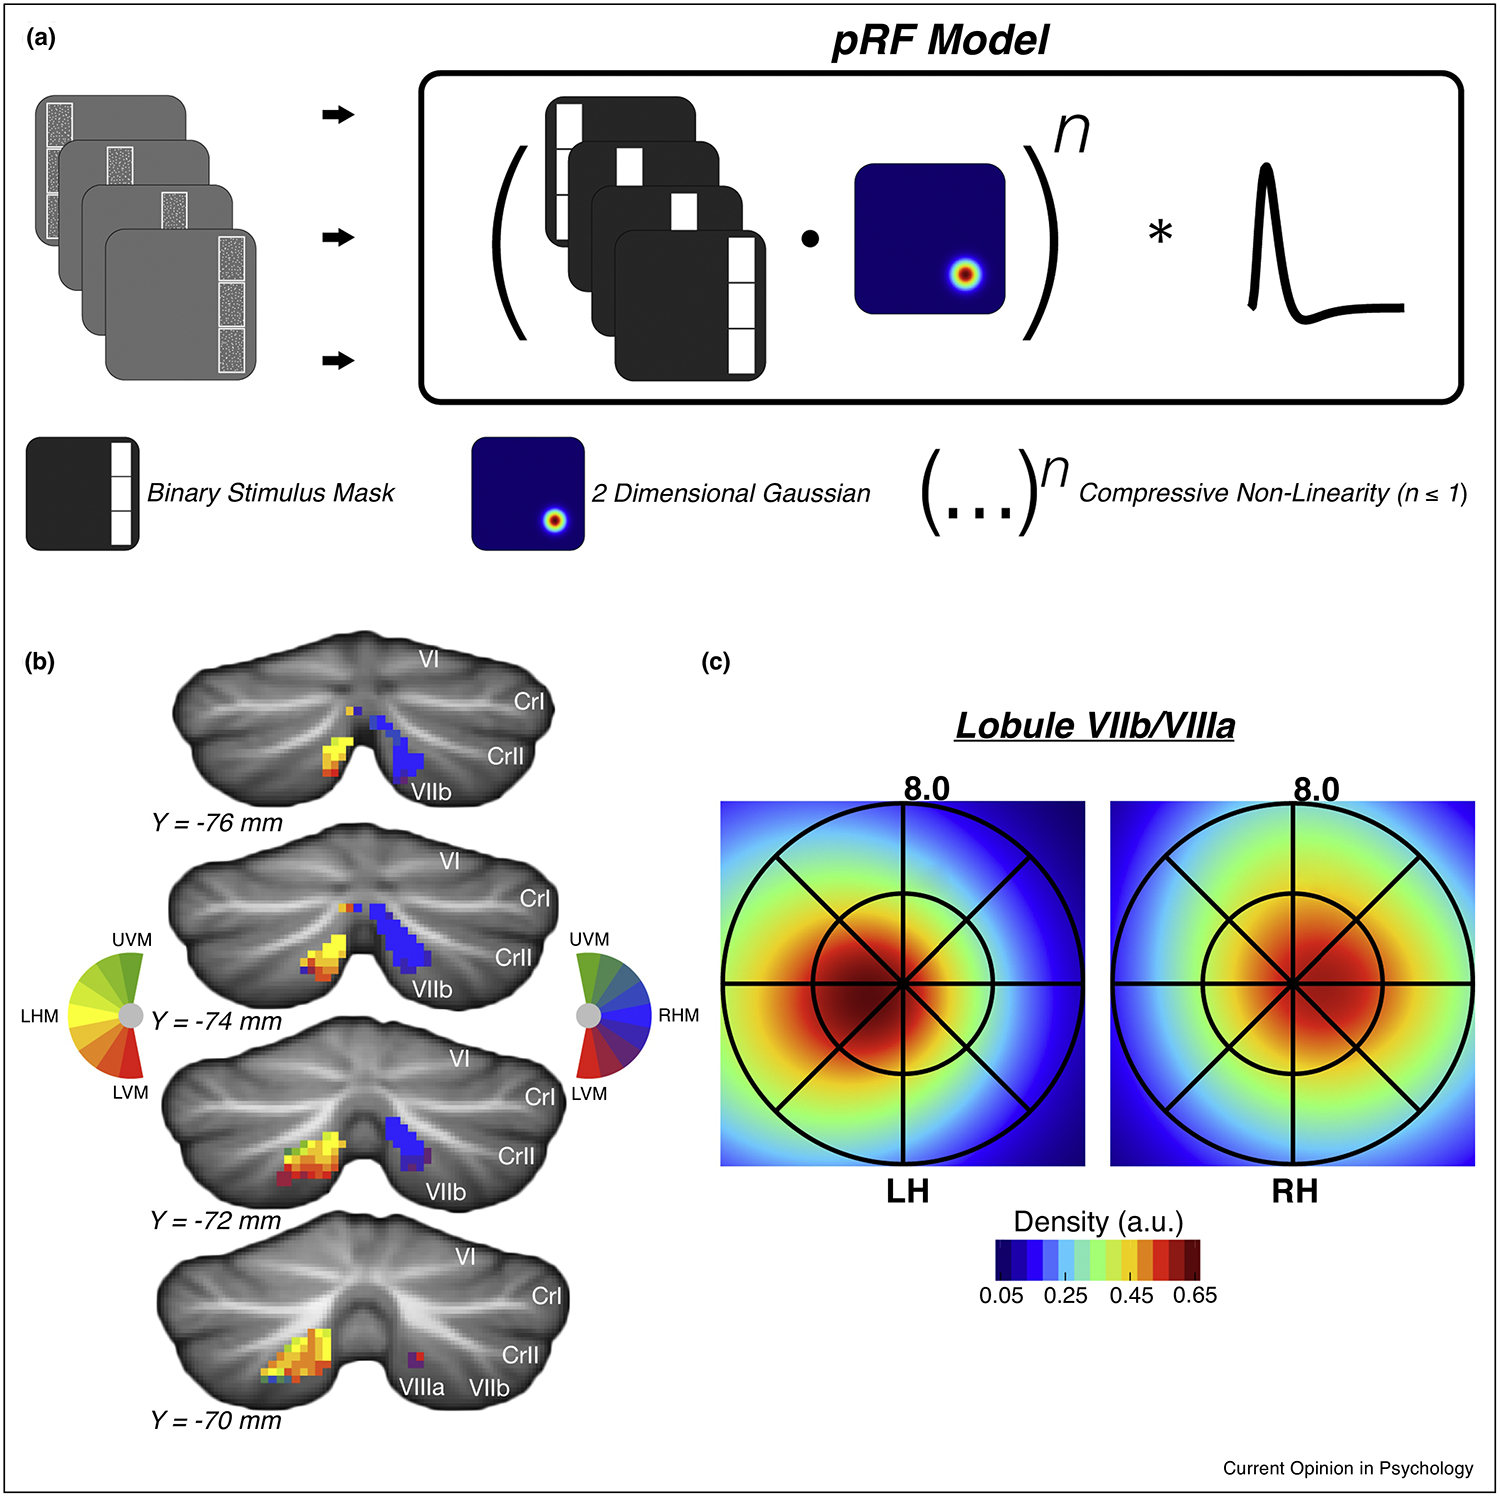
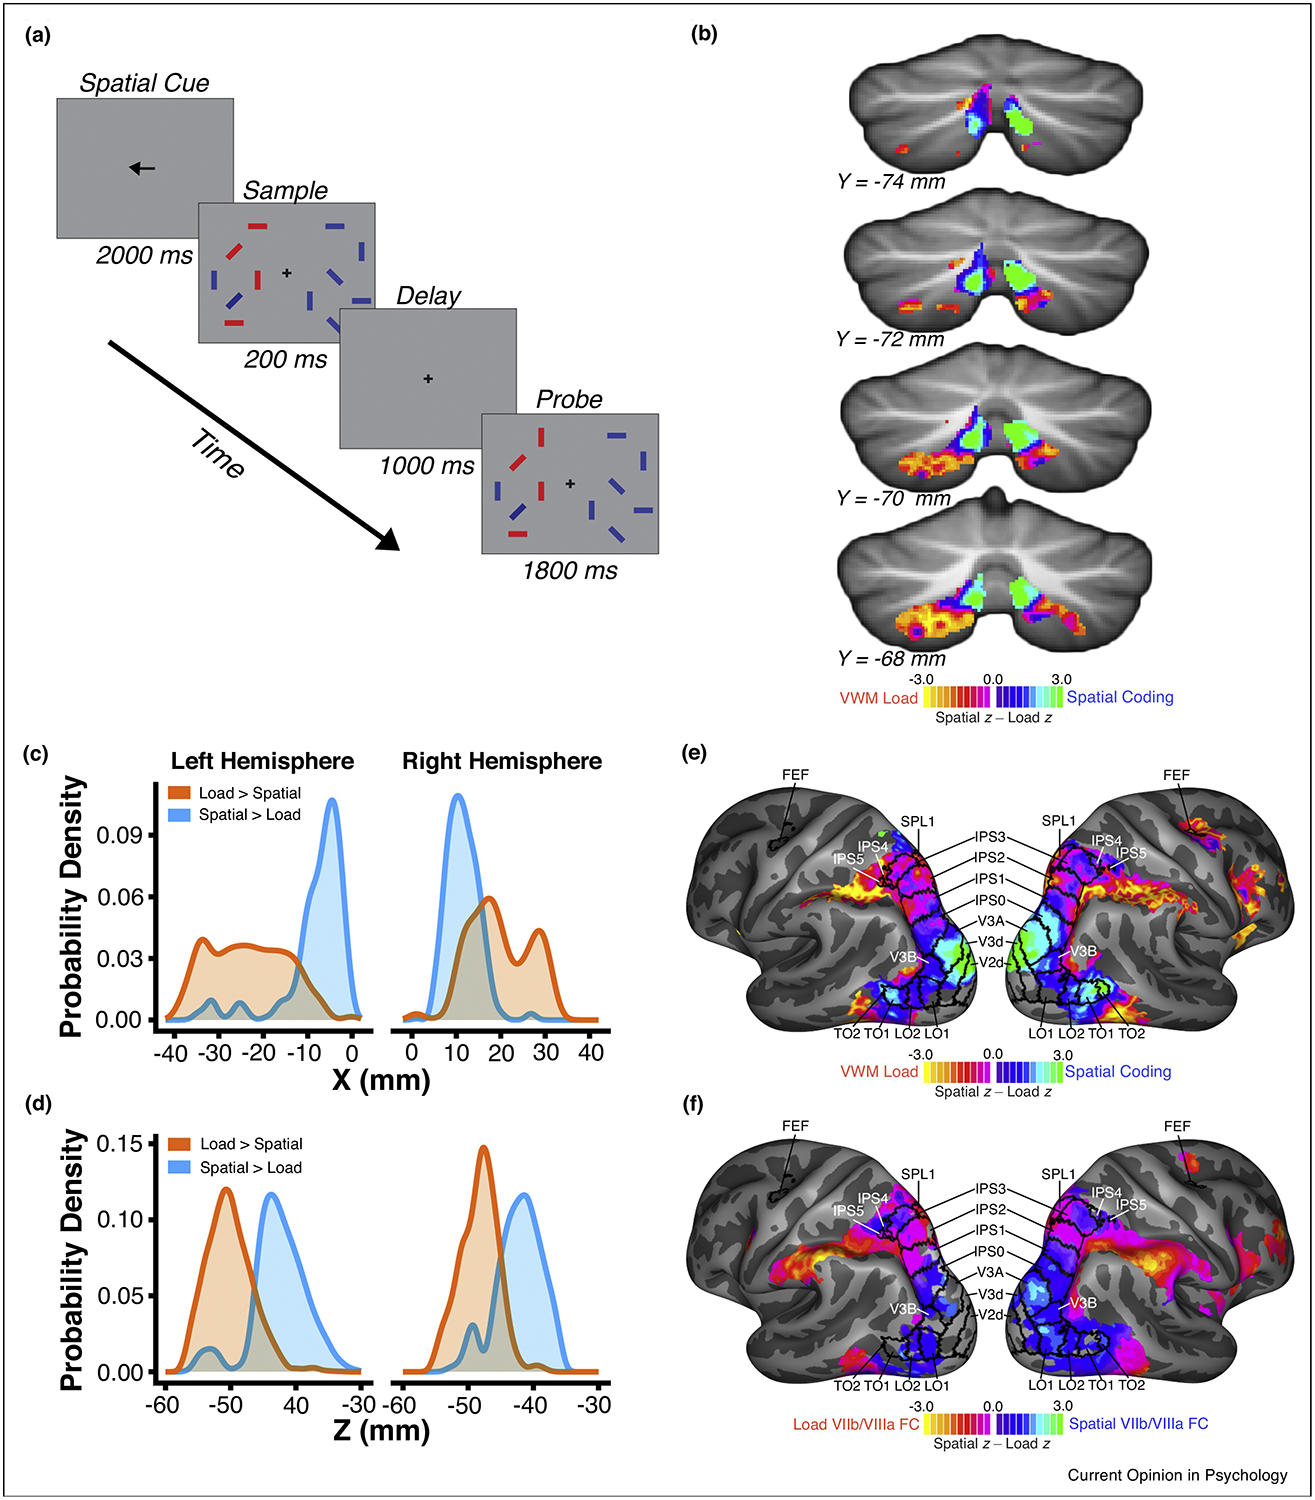
Cerebellar cortex, which is cytoarchitectonically homogenous, can be functionally differentiated by connectivity differences across the cerebral cortex. The cerebral cortical dorsal attention network exhibits strong, selective connectivity with a set of cerebellar circuits, including lobule VIIb/VIIIa. Recent findings demonstrate that lobule VIIb/VIIIa exhibits functional properties characteristic of the cortical dorsal attention network: task-specific activation; working memory load-dependent responses; and the representation of visuospatial location. Moreover, functional cortico-cerebellar subnetworks exhibit topographic specialization for different aspects of visual attentional processing. Thus, cerebellar lobule VIIb/VIIIa, rather than simply supporting motor functions, appears to be an integral part of the brain's visual attentional circuitry. More generally, these findings suggest that parallel cortico-cerebellar networks may play highly specific functional roles in a broad range of cognitive processes.


Conflict of interest statement

Conflict of Interest Statement

Nothing declared.

Figures

Figure 1.
Figure 1.
Functional MRI evidence for a cerebellar node of the dorsal attention network. (a) Pial surface representation of the cerebellum from superior (top left), anterior (bottom left), inferior (top middle), and posterior (bottom middle) views. Colors denote lobular boundaries. Flatmap representation of the cerebellum [82] is shown on the right with corresponding lobular labels. (b) A single subject’s pattern of resting-state functional connectivity with the cortical dorsal attention network. Color map reflects p-value of the t-statistic produced by regressing the time course of each cerebellar voxel on the average time course of the cortical DAN. (c) The same subject’s activation pattern for a visual attention multiple object tracking task (contrast of set size 4 vs. set size 0). The task required participants to covertly track multiple moving target items among identical distractors. Color map reflects p-value of t-statistic for task activation contrast via GLM. (d) Cerebellar activation pattern elicited by a contrast of high load (set size 4) working memory with low load (set size 1) working memory. Participants were required to maintain the identity of varying numbers of items over short delays in order to detect the presence or absence of a change in the identity of one of the stored items. (e) Cerebellar region-of-interest (ROI) analysis shows that covert attentional tracking selectively recruits portions of the cerebellar that are functionally coupled with the cortical DAN. Cerebellar ROIs were defined by winner-take-all procedure which assigned cerebellar voxels to the cortical network with which they had the strongest correlation. Other networks shown: Ventral Attention Network (VAN), Cognitive Control Network (CCN), Somatomotor Network (SOM), Limbic Network (LIMB), and Default Mode Network (DMN). (f) Cerebellar network ROI analysis for the visual working memory load contrast (set size 4 > set size 1). Adapted from Ref. [17]
Figure 2.
Figure 2.
Cerebellar lobule VIIb/VIIIa visual field representations. (a) Schematic of population receptive field (pRF) mapping procedure. Participants held central fixation while bar-like apertures containing moving dot stimuli were slowly swept across the visual field in each of four cardinal directions. The task was to report which of the two outer sections possessed dot motion in the same direction as the inner section. This task was repeated for each step in the visual field sweep. The pRF modeling procedure consists of converting trial stimulus images to 2D binary masks and then computing the dot product between the binary mask and a 2D Gaussian (representing a predicted pRF) for each timepoint. A static power-law non-linearity is then applied to account for subadditive spatial summation. Lastly, the generated time course is convolved with a hemodynamic response function. (b) Polar angle visual field location preferences produced by a pRF mapping analysis for a single subject. Colors reflect visual field polar angle relative to central fixation; LHM – left horizontal meridian (yellow), RHM – right horizontal meridian (blue), UVM – upper vertical meridian (green), LVM – lower vertical meridian (red). (c) Group-average (n=5) visual field coverage maps for left and right hemisphere lobule VIIb/VIIIa. Coverage maps are produced by averaging the pRFs (scaled to peak at 1) of above-threshold (cross-validated predicted-actual correlation > 0.2) lobule VIIb/VIIIa voxels within and across subjects. Adapted from Ref. [18]
Figure 3.
Figure 3.
Fine-scale topography of cortico-cerebellar networks for visual attention and working memory. (a) Task Configuration. Participants held central fixation while covertly performing a spatially lateralized visual working memory task, in which they were asked to encode the orientation of 1 or 4 target stimuli (red) and to report whether the orientation of any bar changed (one bar changed on 50% of trials, no change on other 50% of trials) across a brief delay interval. Target stimuli alternated visual hemifields across blocks of trials. (b) Normalized comparison of spatial location coding and VWM load coding revealed complementary gradients, for which spatial coding is more robust dorsomedially and VWM load coding is more robust ventrolaterally. (c, d) Probability density curves for VWM load coding (orange) and for spatial coding (blue) showed separable profiles in the X- and Z-dimensions (MNI coordinates). (e) Normalized comparison of spatial coding and VWM load coding in the cerebral cortex revealed a gradient in parieto-occipital cortical regions. Within parietal cortex, dorsomedial retinotopic areas IPS0–5 exhibited varying degrees of spatial bias, while the ventrolateral portion was biased for VWM load coding (f) Contrast between resting-state functional connectivity of cerebellar lobule VIIb/VIIIa spatial coding and VWM load coding seeds accurately reflected the functional gradient observed in the task data of panel e. Adapted from Ref. [18].

Similar articles

Cited by

References

    1. Petersen SE, Robinson DL, Morris JD, Contributions of the pulvinar to visual spatial attention, Neuropsychologia. 25 (1987) 97–105. - PubMed
    1. Ignashchenkova A, Dicke PW, Haarmeier T, Thier P, Neuron-specific contribution of the superior colliculus to overt and covert shifts of attention, Nature Neuroscience. 7 (2004) 56–64. doi:10.1038/nn1169. - DOI - PubMed
    1. Müller JR, Philiastides MG, Newsome WT, Microstimulation of the superior colliculus focuses attention without moving the eyes, Pnas 102 (2005) 524–529. doi:10.1073/pnas.0408311101. - DOI - PMC - PubMed
    1. Evarts EV, Thach WT, Motor mechanisms of the CNS: cerebrocerebellar interrelations, Annu. Rev. Physiol 31 (1969) 451–498. doi:10.1146/annurev.ph.31.030169.002315. - DOI - PubMed
    1. Gilbert PF, Thach WT, Purkinje cell activity during motor learning, Brain Research. 128 (1977) 309–328. - PubMed

Publication types

LinkOut - more resources