

Circulating serum fatty acid synthase is elevated in patients with diabetes and carotid artery stenosis and is LDL-associated
- PMID: 31202106
- PMCID: PMC6707847
- DOI: 10.1016/j.atherosclerosis.2019.05.016
Circulating serum fatty acid synthase is elevated in patients with diabetes and carotid artery stenosis and is LDL-associated
Abstract
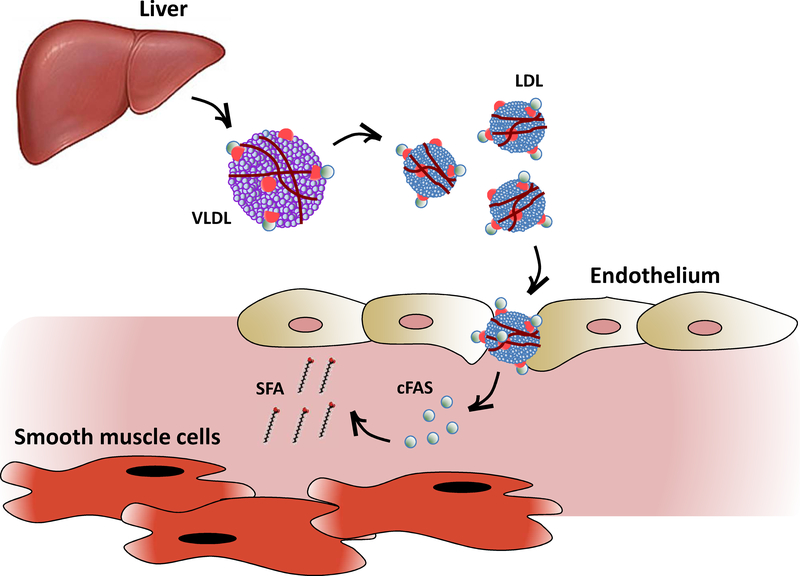
Background and aims: Diabetes is an independent risk factor for carotid artery stenosis (CAS). Fatty acid synthase (FAS), an essential de novo lipogenesis enzyme, has increased activity in the setting of diabetes that leads to altered lipid metabolism. Circulating FAS (cFAS) was recently observed in the blood of patients with hyperinsulinemia and cancer. We thought to evaluate the origin of cFAS and its role in diabetes-associated CAS.
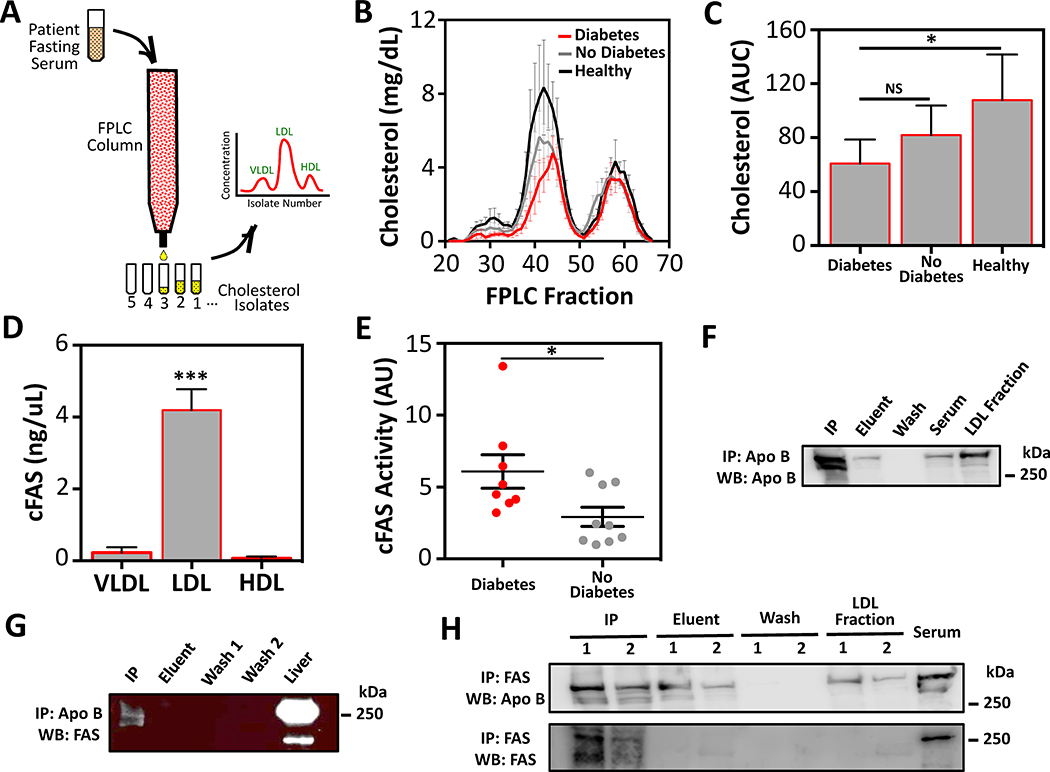
Methods: Patients with diabetes and no diabetes, undergoing carotid endarterectomy (CEA) for CAS, were prospectively enrolled for collection of plaque and fasting serum. FPLC was used to purify lipoprotein fractions, and ELISA was used to quantify cFAS content and activity. Immunoprecipitation (IP) was used to evaluate the affinity of cFAS to LDL-ApoB.
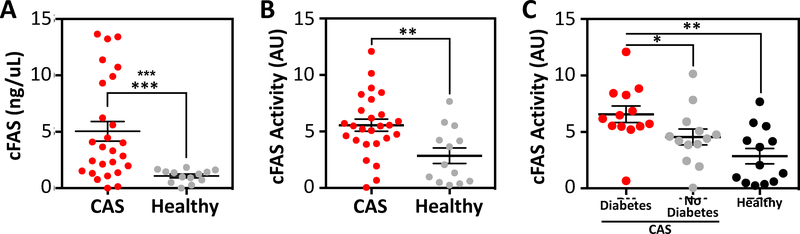
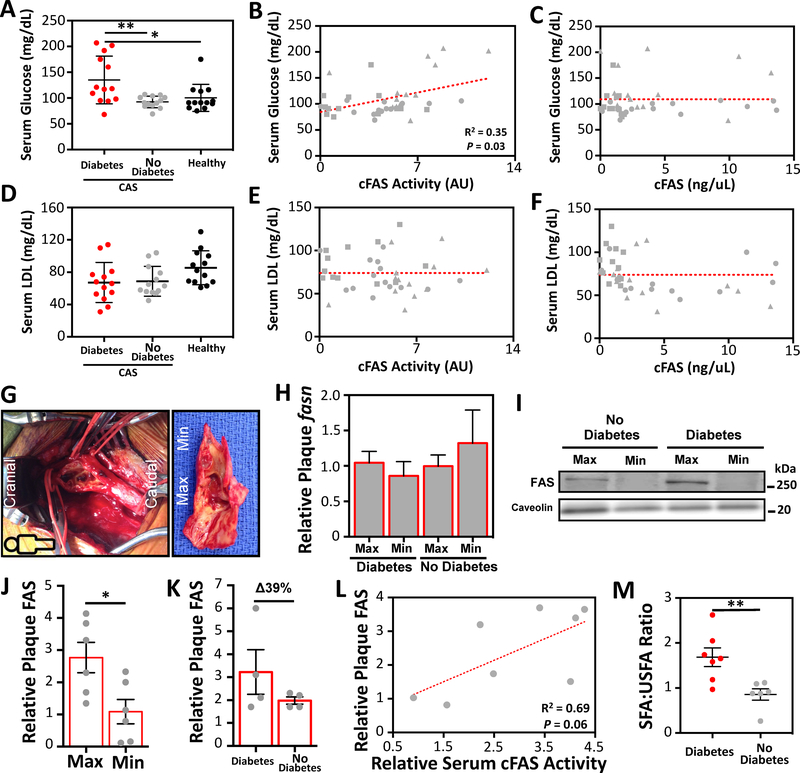
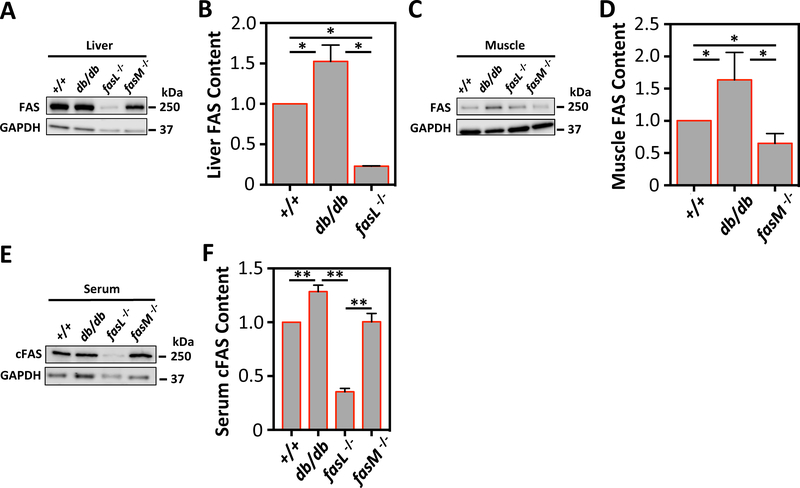
Results: Patients with CAS had higher cFAS activity (p < 0.01), and patients with diabetes had higher cFAS activity than patients with no diabetes (p < 0.05). cFAS activity correlated with serum glucose (p = 0.03, r2 = 0.35), and cFAS content trended with plaque FAS content (p = 0.06, r2 = 0.69). cFAS was predominantly in LDL cholesterol fractions of patients with CAS (p < 0.001), and IP of cFAS demonstrated pulldown of ApoB. Similar to patients with diabetes, db/db mice had highest levels of serum cFAS (p < 0.01), and fasL-/- (tissue-specific liver knockdown of FAS) mice had the lowest levels of cFAS (p < 0.001).
Conclusions: Serum cFAS is higher in patients with diabetes and CAS, appears to originate from the liver, and is LDL cholesterol associated. We postulate that LDL may be serving as a carrier for cFAS that contributes to atheroprogression in carotid arteries of patients with diabetes.
Keywords: Carotid artery stenosis; Diabetes; Fatty acid synthase; Lipoprotein; Serum biomarker.
Copyright © 2019 The Authors. Published by Elsevier B.V. All rights reserved.
Conflict of interest statement
CONFLICT OF INTEREST
The authors declared they do not have anything to disclose regarding conflict of interest with respect to this manuscript.
Figures
Similar articles
-
Targeting fatty acid synthase reduces aortic atherosclerosis and inflammation.Commun Biol. 2025 Feb 19;8(1):262. doi: 10.1038/s42003-025-07656-1. Commun Biol. 2025. PMID: 39972116 Free PMC article.
-
Carotid artery plaque and LDL-to-HDL cholesterol ratio predict atherosclerotic status in coronary arteries in asymptomatic patients with type 2 diabetes mellitus.J Atheroscler Thromb. 2013;20(5):452-64. doi: 10.5551/jat.14977. Epub 2013 Jan 30. J Atheroscler Thromb. 2013. PMID: 23363982
-
Predicting ischemic stroke after carotid artery stenting based on proximal calcification and the jellyfish sign.J Neurosurg. 2018 May;128(5):1280-1288. doi: 10.3171/2017.1.JNS162379. Epub 2017 Jul 7. J Neurosurg. 2018. PMID: 28686117
-
Contemporary carotid imaging: from degree of stenosis to plaque vulnerability.J Neurosurg. 2016 Jan;124(1):27-42. doi: 10.3171/2015.1.JNS142452. Epub 2015 Jul 31. J Neurosurg. 2016. PMID: 26230478 Review.
-
Endarterectomy or carotid artery stenting: the quest continues.Am J Surg. 2008 Feb;195(2):259-69. doi: 10.1016/j.amjsurg.2007.07.022. Am J Surg. 2008. PMID: 18154764 Review.
Cited by
-
Potential Therapies Targeting the Metabolic Reprogramming of Diabetes-Associated Breast Cancer.J Pers Med. 2023 Jan 14;13(1):157. doi: 10.3390/jpm13010157. J Pers Med. 2023. PMID: 36675817 Free PMC article. Review.
-
Targeting fatty acid synthase reduces aortic atherosclerosis and inflammation.Commun Biol. 2025 Feb 19;8(1):262. doi: 10.1038/s42003-025-07656-1. Commun Biol. 2025. PMID: 39972116 Free PMC article.
-
Adiponectin Reduces Lipid Content in Chicken Myoblasts by Activating AMPK Signaling Pathway.Biosci Rep. 2022 May 23;42(6):BSR20212549. doi: 10.1042/BSR20212549. Online ahead of print. Biosci Rep. 2022. PMID: 35603780 Free PMC article.
-
Mammalian fatty acid synthase: a commonly used viral host dependency factor and a putative target for host-targeted broad-spectrum antiviral therapeutic development.mBio. 2025 Aug 13;16(8):e0395424. doi: 10.1128/mbio.03954-24. Epub 2025 Jun 25. mBio. 2025. PMID: 40558086 Free PMC article. Review.
-
Altered Peroxisome Proliferator-Activated Receptor Alpha Signaling in Variably Diseased Peripheral Arterial Segments.Front Cardiovasc Med. 2022 Jun 15;9:834199. doi: 10.3389/fcvm.2022.834199. eCollection 2022. Front Cardiovasc Med. 2022. PMID: 35783870 Free PMC article.
References
-
- Jeerakathil T, et al., Short-term risk for stroke is doubled in persons with newly treated type 2 diabetes compared with persons without diabetes: a population-based cohort study. Stroke, 2007. 38(6): p. 1739–43. - PubMed
-
- Kuebler TW, et al., Diabetes mellitus and cerebrovascular disease: prevalence of carotid artery occlusive disease and associated risk factors in 482 adult diabetic patients. Diabetes Care, 1983. 6(3): p. 274–8. - PubMed
-
- Fisher M, et al., The NASCET-ACAS plaque project. North American Symptomatic Carotid Endarterectomy Trial. Asymptomatic Carotid Atherosclerosis Study. Stroke, 1993. 24(12 Suppl): p. I24–5; discussion I31–2. - PubMed
-
- Gregg EW, et al., Changes in diabetes-related complications in the United States, 1990–2010. N Engl J Med, 2014. 370(16): p. 1514–23. - PubMed
Publication types
MeSH terms
Substances
Grants and funding
LinkOut - more resources
Full Text Sources
Medical
Research Materials
Miscellaneous
