

Cyp2b-null male mice are susceptible to diet-induced obesity and perturbations in lipid homeostasis
- PMID: 31202118
- PMCID: PMC6642837
- DOI: 10.1016/j.jnutbio.2019.05.004
Cyp2b-null male mice are susceptible to diet-induced obesity and perturbations in lipid homeostasis
Abstract
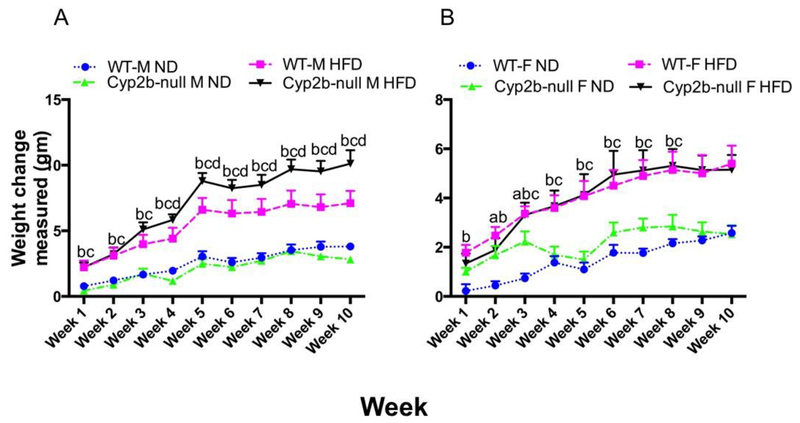
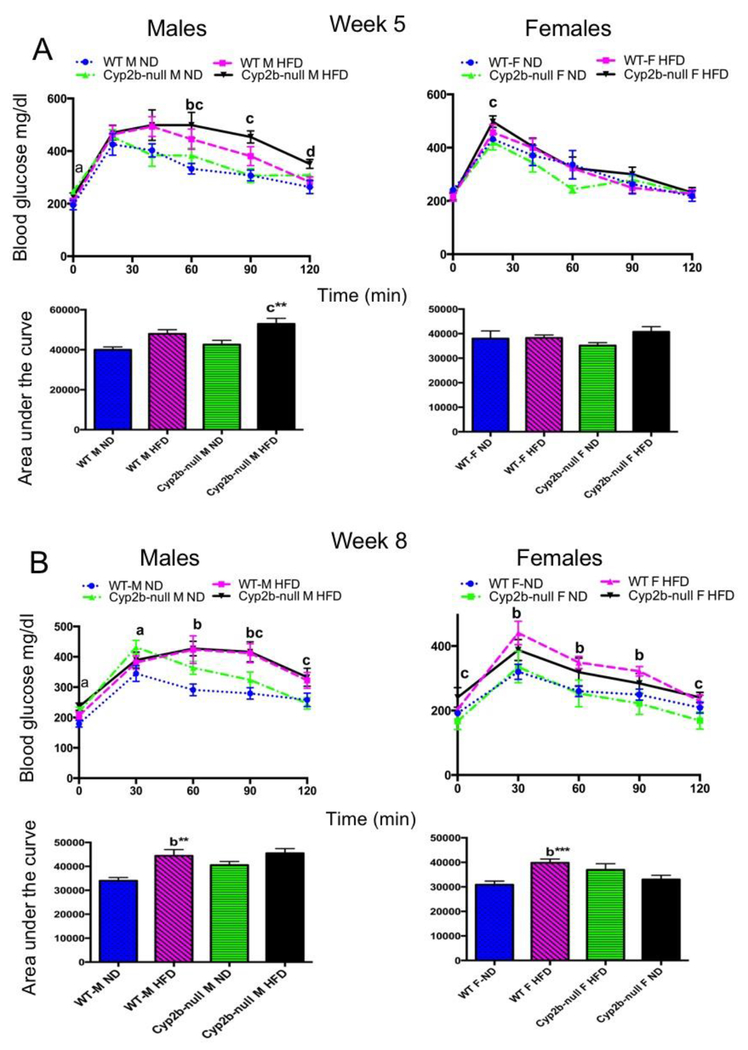
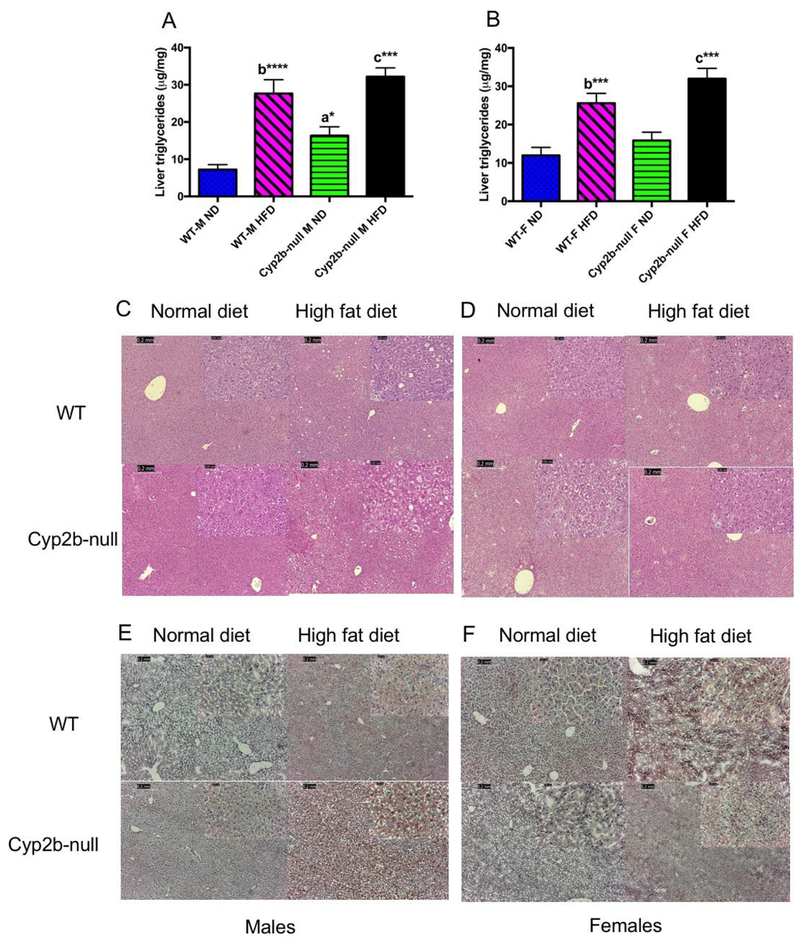
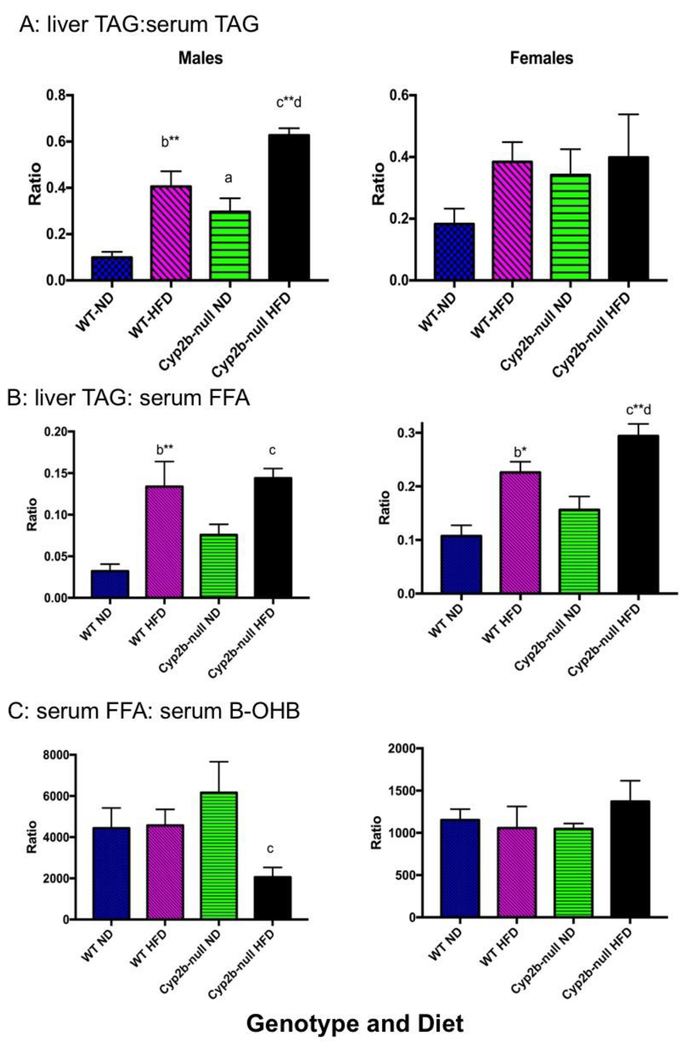
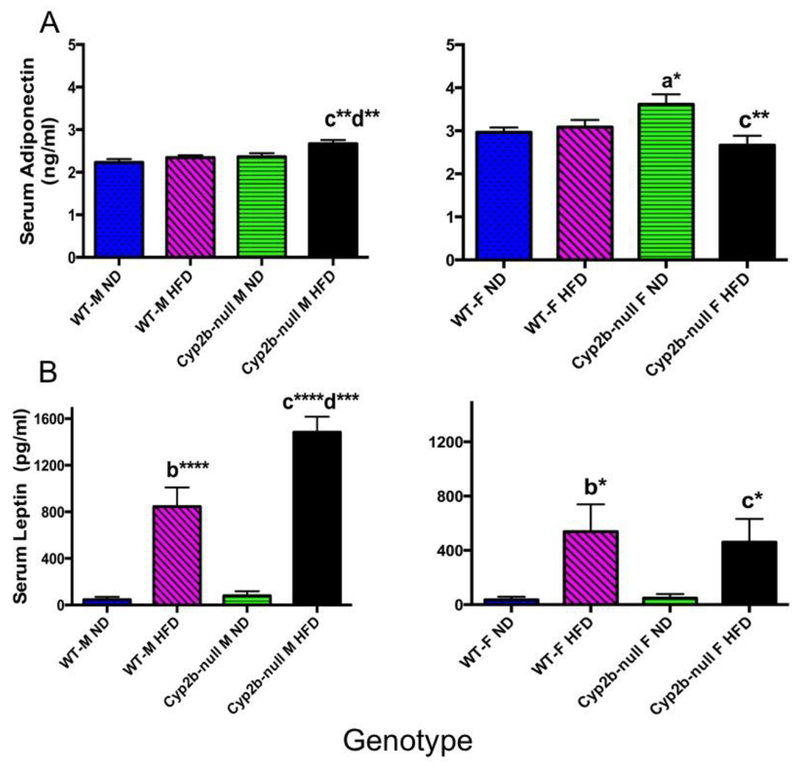
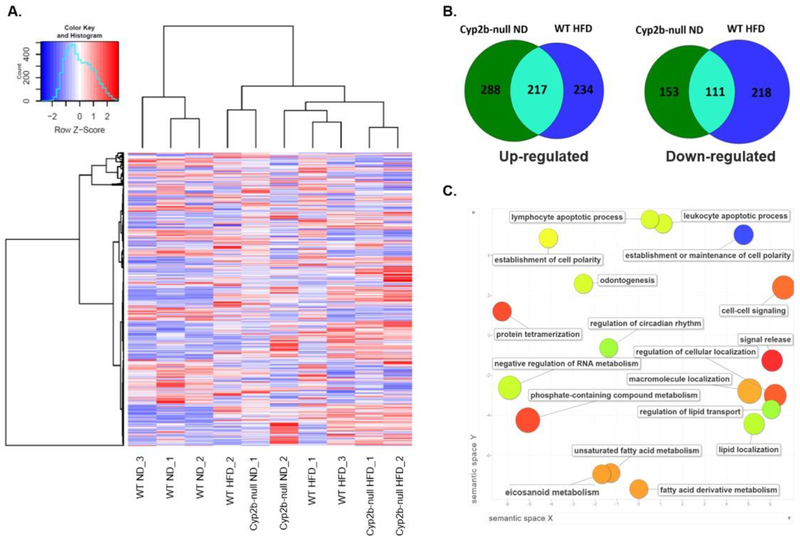
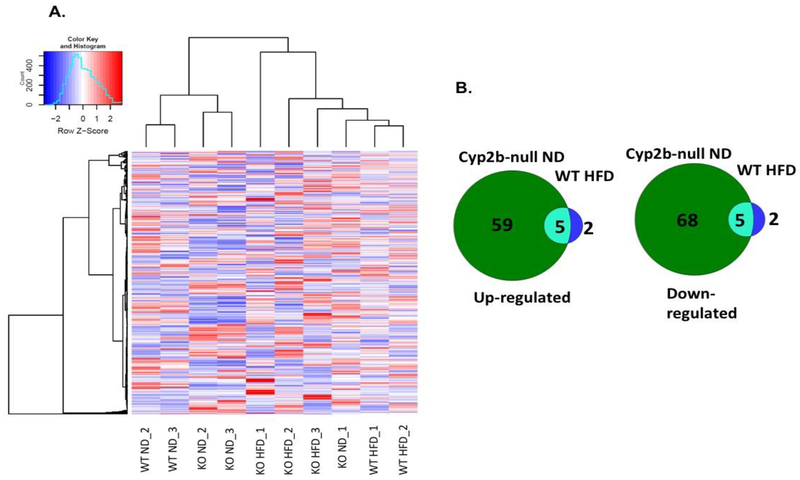
Obesity is an endemic problem in the United States and elsewhere, and data indicate that in addition to overconsumption, exposure to specific chemicals enhances obesity. CYP2B metabolizes multiple endo- and xenobiotics, and recent data suggests that repression of Cyp2b activity increases dyslipidemia and age-onset obesity, especially in males. To investigate the role played by Cyp2b in lipid homeostasis and obesity, we treated wildtype and Cyp2b-null mice with a normal (ND) or 60% high-fat diet (HFD) for 10 weeks and determined metabolic and molecular changes. Male HFD-fed Cyp2b-null mice weigh 15% more than HFD-fed wildtype mice, primarily due to an increase in white adipose tissue (WAT); however, Cyp2b-null female mice did not demonstrate greater body mass or WAT. Serum parameters indicate increased ketosis, leptin and cholesterol in HFD-fed Cyp2b-null male mice compared to HFD-fed wildtype mice. Liver triglycerides and liver:serum triglyceride ratios were higher than their similarly treated wildtype counterparts in Cyp2b-null male mice, indicating a role for Cyp2b in fatty acid metabolism regardless of diet. Furthermore, RNAseq demonstrates that hepatic gene expression in ND-fed Cyp2b-null male mice is similar to HFD-fed WT male mice, suggestive of fatty liver disease progression and a role for Cyp2b in lipid homeostasis. Females did not show as demonstrative changes in liver health, and significantly fewer changes in gene expression, as well as gene expression associated with liver disease. Overall our data indicates that the repression or inhibition of CYP2B may exacerbate metabolic disorders and cause obesity by perturbing fatty acid metabolism, especially in males.
Keywords: Cyp2b; Non-alcoholic fatty liver disease (NAFLD); Obesity; P450; RNAseq; Triglycerides.
Copyright © 2019 Elsevier Inc. All rights reserved.
Conflict of interest statement
Figures
Similar articles
-
Gender differences in diet-induced steatotic disease in Cyp2b-null mice.PLoS One. 2020 Mar 10;15(3):e0229896. doi: 10.1371/journal.pone.0229896. eCollection 2020. PLoS One. 2020. PMID: 32155178 Free PMC article.
-
High fat diet induced obesity is mitigated in Cyp3a-null female mice.Chem Biol Interact. 2018 Jun 1;289:129-140. doi: 10.1016/j.cbi.2018.05.001. Epub 2018 May 5. Chem Biol Interact. 2018. PMID: 29738703 Free PMC article.
-
Compensatory changes in CYP expression in three different toxicology mouse models: CAR-null, Cyp3a-null, and Cyp2b9/10/13-null mice.PLoS One. 2017 Mar 28;12(3):e0174355. doi: 10.1371/journal.pone.0174355. eCollection 2017. PLoS One. 2017. PMID: 28350814 Free PMC article.
-
Evaluation of Aroclor 1260 exposure in a mouse model of diet-induced obesity and non-alcoholic fatty liver disease.Toxicol Appl Pharmacol. 2014 Sep 15;279(3):380-390. doi: 10.1016/j.taap.2014.06.019. Epub 2014 Jul 3. Toxicol Appl Pharmacol. 2014. PMID: 24998970 Free PMC article.
-
Obesity as a clinical and public health problem: is there a need for a new definition based on lipotoxicity effects?Biochim Biophys Acta. 2010 Mar;1801(3):400-4. doi: 10.1016/j.bbalip.2009.12.011. Epub 2010 Jan 4. Biochim Biophys Acta. 2010. PMID: 20045743 Review.
Cited by
-
The reproductive effects of the cancer chemotherapy agent, Carmofur, on Daphnia magna are mediated by its metabolite, 5-Fluorouracil.Ecotoxicology. 2022 Jul;31(5):860-872. doi: 10.1007/s10646-022-02551-5. Epub 2022 May 17. Ecotoxicology. 2022. PMID: 35579761 Free PMC article.
-
Increased Perfluorooctanesulfonate (PFOS) Toxicity and Accumulation Is Associated with Perturbed Prostaglandin Metabolism and Increased Organic Anion Transport Protein (OATP) Expression.Toxics. 2024 Jan 26;12(2):106. doi: 10.3390/toxics12020106. Toxics. 2024. PMID: 38393201 Free PMC article.
-
Increased toxicity and retention of perflourooctane sulfonate (PFOS) in humanized CYP2B6-Transgenic mice compared to Cyp2b-null mice is relieved by a high-fat diet (HFD).Food Chem Toxicol. 2021 Jun;152:112175. doi: 10.1016/j.fct.2021.112175. Epub 2021 Apr 8. Food Chem Toxicol. 2021. PMID: 33838175 Free PMC article.
-
Sex difference in liver diseases: How preclinical models help to dissect the sex-related mechanisms sustaining NAFLD and hepatocellular carcinoma.iScience. 2023 Oct 30;26(12):108363. doi: 10.1016/j.isci.2023.108363. eCollection 2023 Dec 15. iScience. 2023. PMID: 38034347 Free PMC article. Review.
-
Period 2 Regulates CYP2B10 Expression and Activity in Mouse Liver.Front Pharmacol. 2021 Nov 23;12:764124. doi: 10.3389/fphar.2021.764124. eCollection 2021. Front Pharmacol. 2021. PMID: 34887762 Free PMC article.
References
-
- Hales CM, Carroll MD, Fryar CD, Ogden CL. Prevalence of obesity among adults and youth: United States, 2015-2016. NCHS data brief 2017;288. - PubMed
Publication types
MeSH terms
Substances
Grants and funding
LinkOut - more resources
Full Text Sources
Medical
Molecular Biology Databases
