. 2019 Jun 15;21(1):74.
doi: 10.1186/s13058-019-1155-7.

The p52 isoform of SHC1 is a key driver of breast cancer initiation

Affiliations

The p52 isoform of SHC1 is a key driver of breast cancer initiation

Kevin D Wright et al. Breast Cancer Res. .

Abstract

Background: SHC1 proteins (also called SHCA) exist in three functionally distinct isoforms (p46SHC, p52SHC, and p66SHC) that serve as intracellular adaptors for several key signaling pathways in breast cancer. Despite the broad evidence implicating SHC1 gene products as a central mediator of breast cancer, testing the isoform-specific roles of SHC1 proteins have been inaccessible due to the lack of isoform-specific inhibitors or gene knockout models.

Methods: Here, we addressed this issue by generating the first isoform-specific gene knockout models for p52SHC and p66SHC, using germline gene editing in the salt-sensitive rat strain. Compared with the wild-type (WT) rats, we found that genetic ablation of the p52SHC isoform significantly attenuated mammary tumor formation, whereas the p66SHC knockout had no effect. Rats were dosed with 7,12-dimethylbenz(a)anthracene (DMBA) by oral gavage to induce mammary tumors, and progression of tumor development was followed for 15 weeks. At 15 weeks, tumors were excised and analyzed by RNA-seq to determine differences between tumors lacking p66SHC or p52SHC.

Results: Compared with the wild-type (WT) rats, we found that genetic ablation of the p52SHC isoform significantly attenuated mammary tumor formation, whereas the p66SHC knockout had no effect. These data, combined with p52SHC being the predominant isoform that is upregulated in human and rat tumors, provide the first evidence that p52SHC is the oncogenic isoform of Shc1 gene products in breast cancer. Compared with WT tumors, 893 differentially expressed (DE; FDR < 0.05) genes were detected in p52SHC KO tumors compared with only 18 DE genes in the p66SHC KO tumors, further highlighting that p52SHC is the relevant SHC1 isoform in breast cancer. Finally, gene network analysis revealed that p52SHC KO disrupted multiple key pathways that have been previously implicated in breast cancer initiation and progression, including ESR1 and mTORC2/RICTOR.

Conclusion: Collectively, these data demonstrate the p52SHC isoform is the key driver of DMBA-induced breast cancer while the expression of p66SHC and p46SHC are not enough to compensate.

Keywords: Breast cancer; DMBA; Rat model; Shc proteins; Signaling.


Conflict of interest statement

The authors declare that they have no competing interests.

Figures
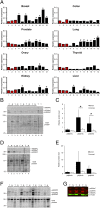
Fig. 1
Fig. 1
Upregulation of SHC1 p46SHC/p52SHC transcript and SHC proteins in human breast cancers. a Quantitative real-time RT-PCR analysis of SHC1 p52SHC/p46SHC transcript levels on a TissueScan cancer survey panel of the breast, colon, prostate, lung, ovary, thyroid, kidney, and liver non-tumor tissue (red bars) and tumor tissue (black bars). Expression is normalized to the median non-cancerous tissue samples. Expression of p52SHC/p46SHC transcript greater than 1.5 is indicated with a number sign, while expression greater than 2 times is indicated with an asterisk. b Western blot analysis of SHC1 isoform expression of paired ER+/PR+/HER2− tumor (T) and non-tumor (N) samples, 5 μg/lane. Lane numbers are indicated at the bottom. c Quantification of data from b panel by normalization to total protein, where *P = 0.008. d Western blot analysis of SHC1 in triple negative ER−/PR−/HER2− paired samples, 10 μg/lane. Lane numbers are indicated at the bottom. e Quantification of data from d panel by normalization to total protein. f INSTA-Blot Breast Tissue OncoPair membrane blotted with both c-terminal total SHC1 and n-terminal p66SHC-specific antibodies. Membranes contain seven paired tumor (T) or non-tumor (N) samples. Locations of three SHC isoforms are indicated. g Western blot analysis of SHC isoform expression (red bands) and β-actin (green) as a loading control in paired normal (N) and DMBA tumor (T) samples from the same rats (n = 3 rats)
Fig. 2
Fig. 2
Immunohistochemistry of SHC1 proteins shows the increased staining of SHC1 proteins in breast cancer cells compared to adjacent normal breast epithelia or stromal cells in human breast cancer. There are shown 4 cases of normal tissues and 4 cases of breast cancers. Each image represents one case
Fig. 3
Fig. 3
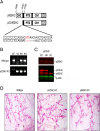
Knockout of p52SHC by CRISPR/Cas-9. a Diagrammatic representation of protein domains and ATG initiation codons of SHC isoforms that arise from the two SHC1 transcripts. To knock out the p52SHC isoform, the initiation of the codon for p52SHC was targeted using the CRISPR/Cas-9 gene editing in the salt-sensitive (SS) rat. One founder generated a 6-base pair deletion (red) in which the p52SHC ATG was deleted. b PCR genotyping results of WT, p52SHC-KO, and heterozygous (Het) animals. The upper gel shows PCR reaction for WT allele and the lower gel shows PCR reaction for the mutant allele. c Western blot from spleen tissue showing expression of SHC isoforms (red) and β-actin (green) as a loading control in WT, heterozygous (Het), and p52SHC-KO knockout (KO) rats. d Carmine alum stain of the normal adult mammary epithelium of wild-type, p52SHC-KO, and p66SHC-KO rats. Magnification × 4
Fig. 4
Fig. 4
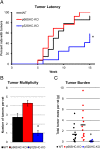
Increased tumor latency and decreased multiplicity in DMBA-induced p52SHC knockout rats. a Tumor latency was compared between WT (black, n = 14), p66SHC-KO (red, n = 13), and p52SHC-KO (blue, n = 12) DMBA-induced rats over 15 weeks. *P < 0.015. b The average multiplicity of tumors at 15 weeks for each genotype. Error bars represent standard error of means. *P < 0.004. c Total tumor burden, the sum total of mammary tumors per rat, isolated for each animal. The line indicates average tumor mass for each genotype. *P < 0.02
Fig. 5
Fig. 5
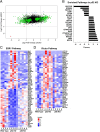
RNAseq analysis reveals enriched genes dis-regulated by loss of p52SHC. a Histogram comparing log2 fold change in transcript expression in p52SHC-KO tumors compared to WT (X-axis) with fold change in transcript expression in p66SHC-KO tumors (Y-axis). Green dots symbolize genes that are differentially expressed in only one knockout group. Blue dots symbolize genes that are differentially expressed in p52SHC-KO and p66SHC-KO tumors in the opposite directions. Red dots symbolize differentially expressed genes p52SHC-KO and p66SHC-KO tumors in the same direction. b Bar graph indicating the top 20 enriched pathways with Z-score greater than ± 2 in p52SHC-KO tumors, ranked by Z-score. ce Heat map of ESR1 (c) and RICTOR (d) pathway targets identified by RNAseq analysis of wild-type, p52SHC-KO, and p66SHC-KO DMBA-induced tumors

Similar articles

Cited by

References

    1. Nagini S. Breast cancer: current molecular therapeutic targets and new players. Anti Cancer Agents Med Chem. 2017;17(2):152–163. doi: 10.2174/1871520616666160502122724. - DOI - PubMed
    1. Soysal SD, Tzankov A, Muenst SE. Role of the tumor microenvironment in breast cancer. Pathobiology. 2015;82(3–4):142–152. doi: 10.1159/000430499. - DOI - PubMed
    1. Das R, Vonderhaar BK. Involvement of SHC, GRB2, SOS and RAS in prolactin signal transduction in mammary epithelial cells. Oncogene. 1996;13(6):1139–1145. - PubMed
    1. Fox EM, Andrade J, Shupnik MA. Novel actions of estrogen to promote proliferation: integration of cytoplasmic and nuclear pathways. Steroids. 2009;74(7):622–627. doi: 10.1016/j.steroids.2008.10.014. - DOI - PMC - PubMed
    1. Hudson J, Ha JR, Sabourin V, Ahn R, La SR, Livingstone J, Podmore L, Knight J, Forrest L, Beauchemin N, et al. p66ShcA promotes breast cancer plasticity by inducing an epithelial-to-mesenchymal transition. Mol Cell Biol. 2014;34(19):3689–3701. doi: 10.1128/MCB.00341-14. - DOI - PMC - PubMed

Publication types

MeSH terms

Substances