. 2019 Jul:45:231-250.
doi: 10.1016/j.ebiom.2019.06.004. Epub 2019 Jun 13.

Dietary vinegar prevents kidney stone recurrence via epigenetic regulations

Affiliations

Dietary vinegar prevents kidney stone recurrence via epigenetic regulations

Wei Zhu et al. EBioMedicine. 2019 Jul.

Abstract

Background: Epidemiological evidence of over 9000 people suggests that daily intake of vinegar whose principal bioactive component is acetic acid is associated with a reduced risk of nephrolithiasis. The underlying mechanism, however, remains largely unknown.

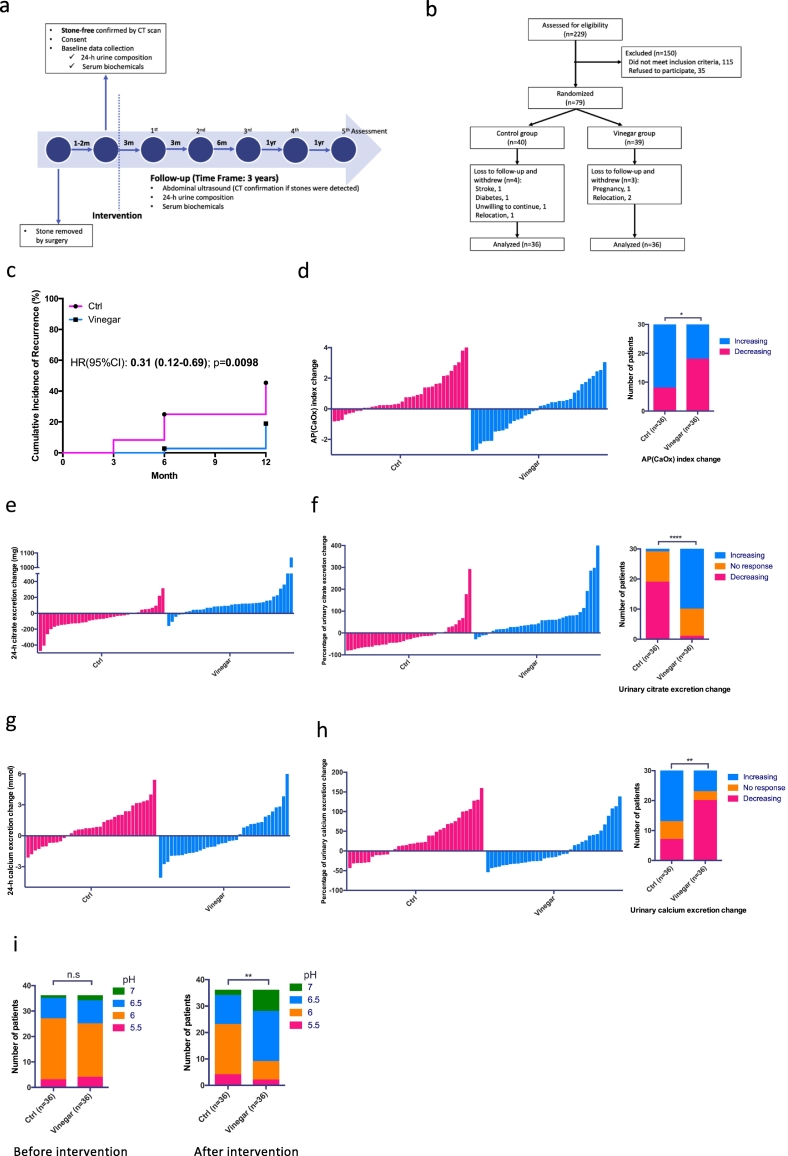
Methods: We examined the in vitro and in vivo anti-nephrolithiasis effects of vinegar and acetate. A randomized study was performed to confirm the effects of vinegar in humans.

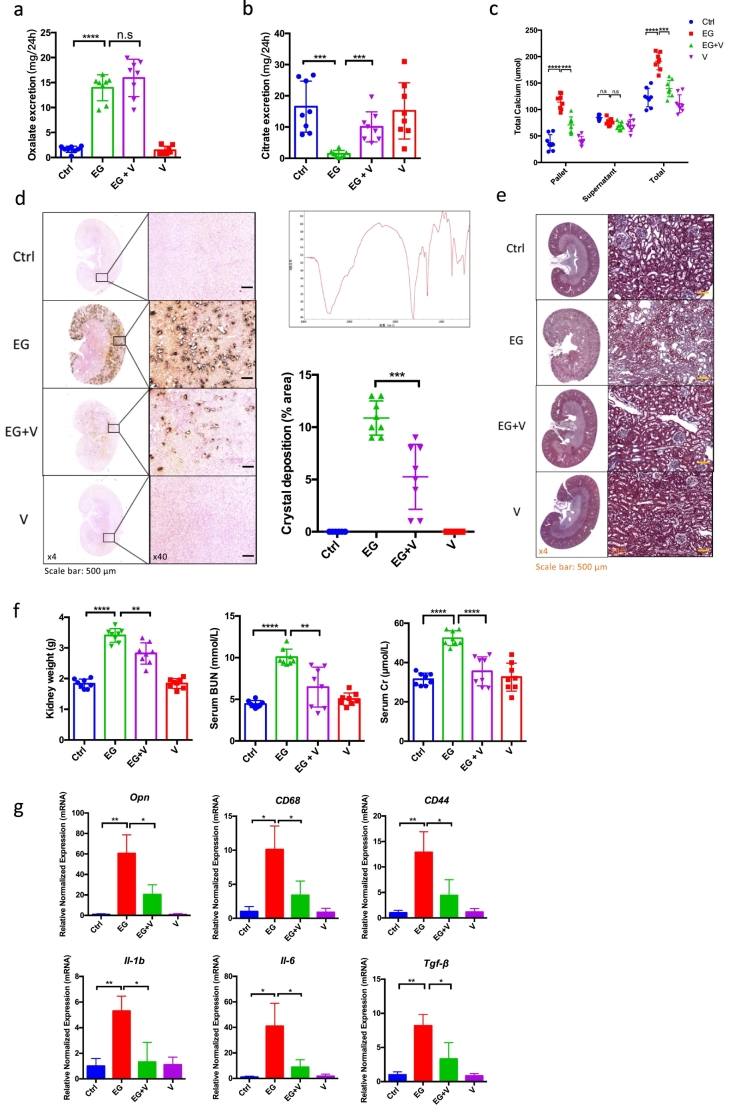
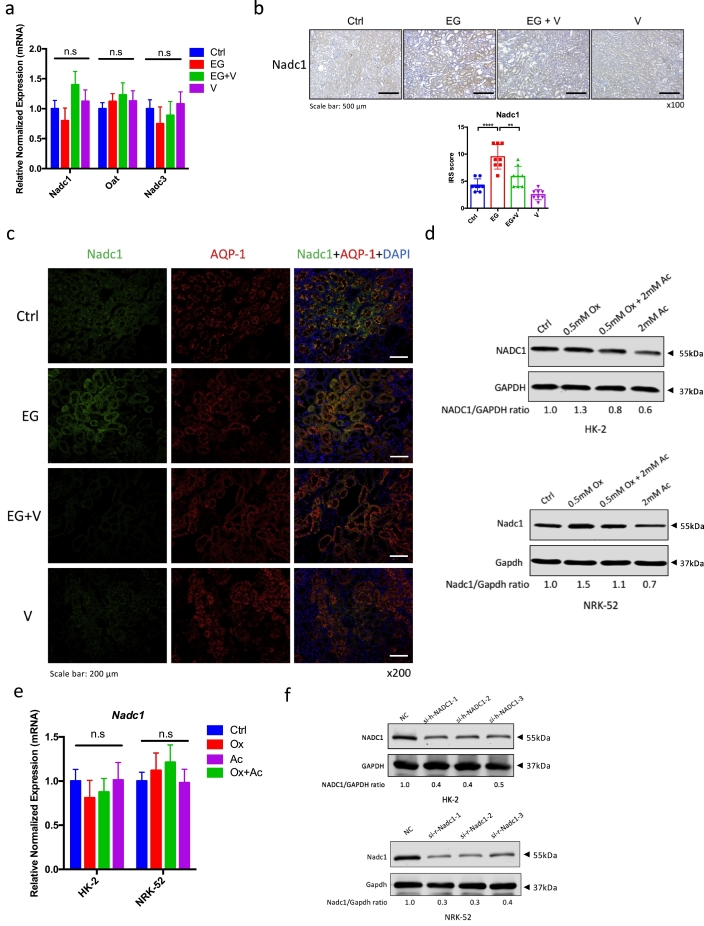
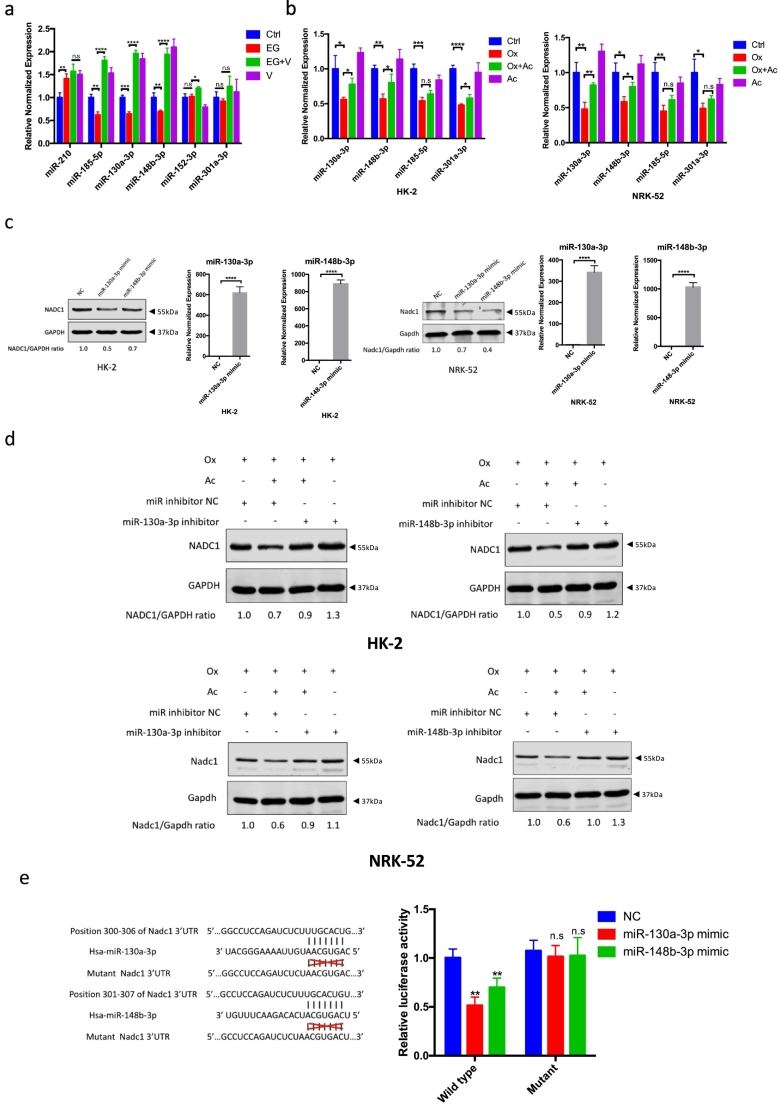
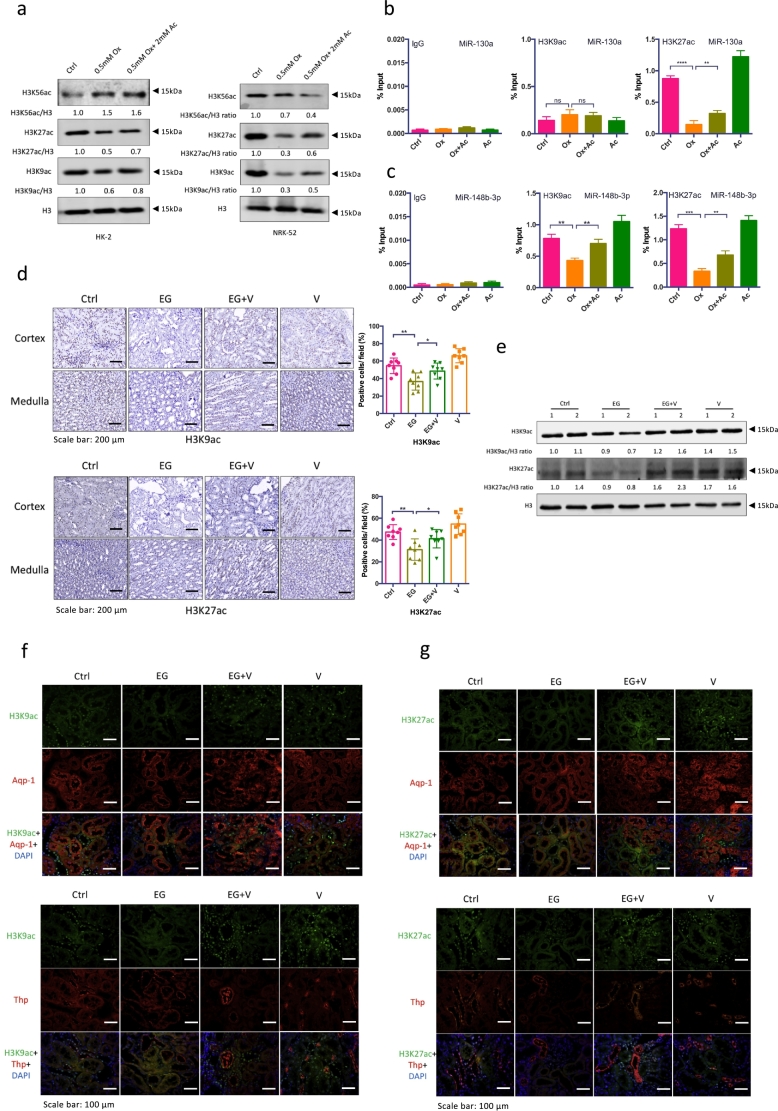
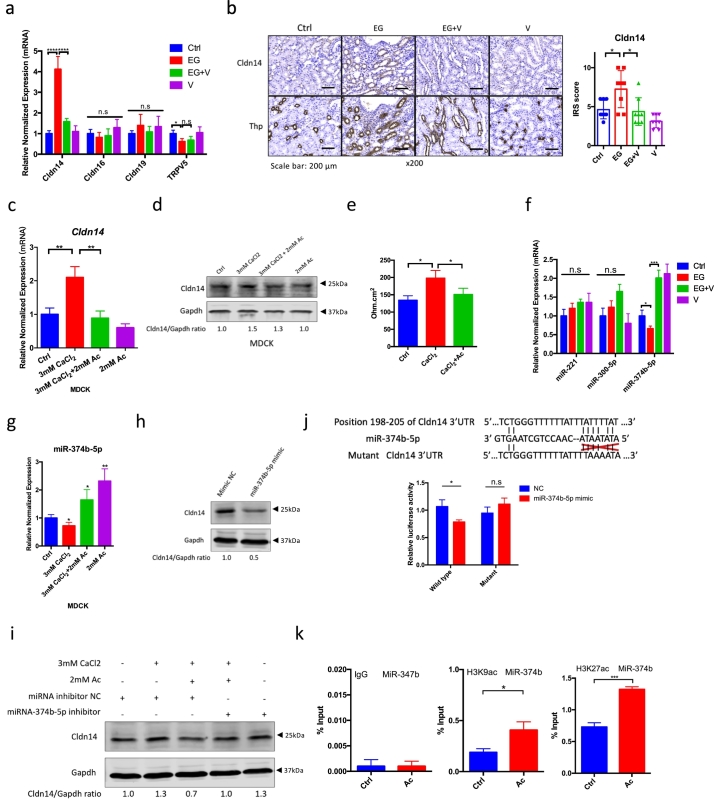
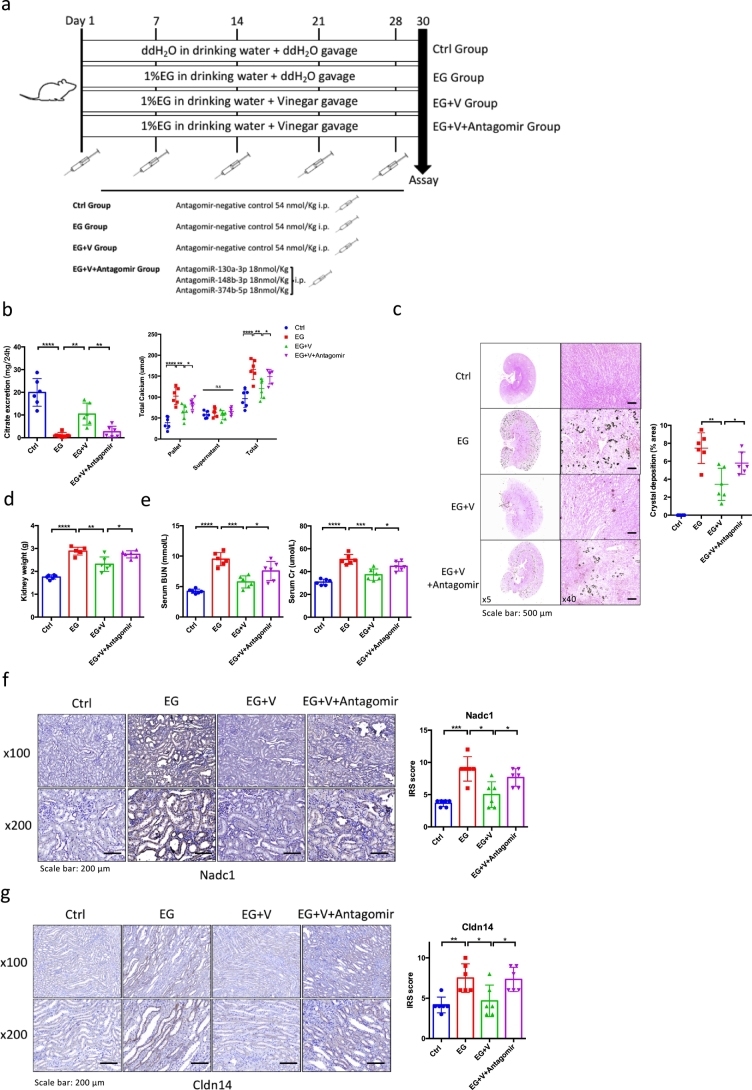
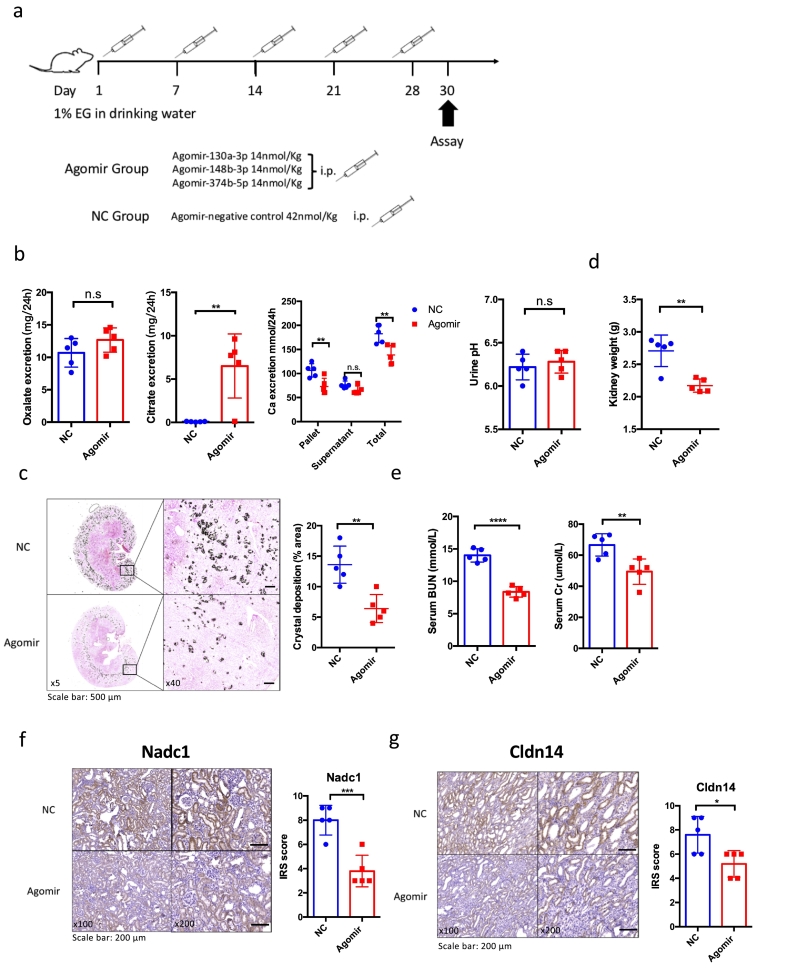
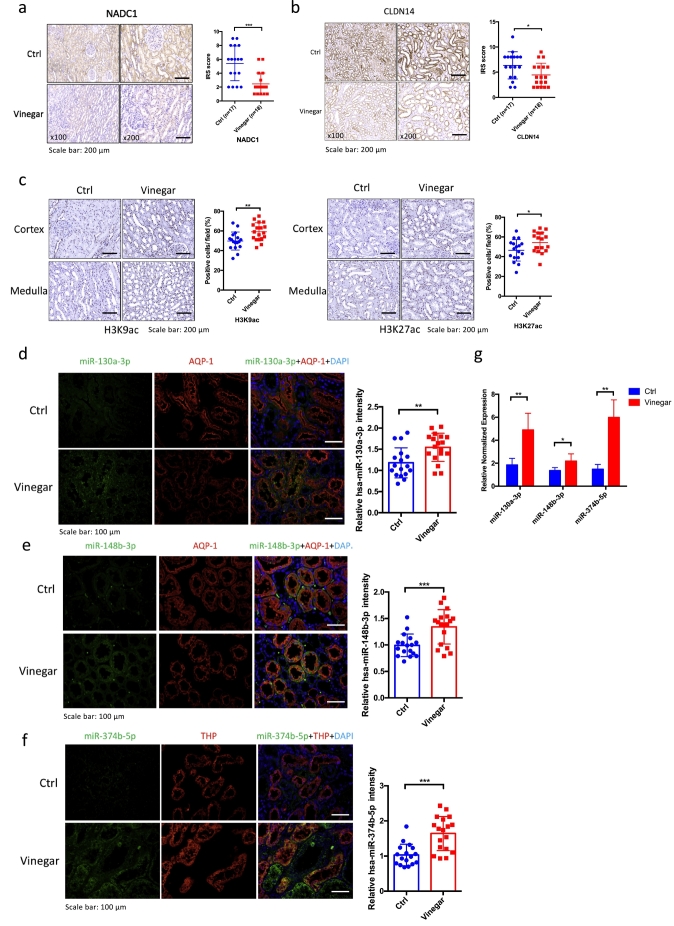
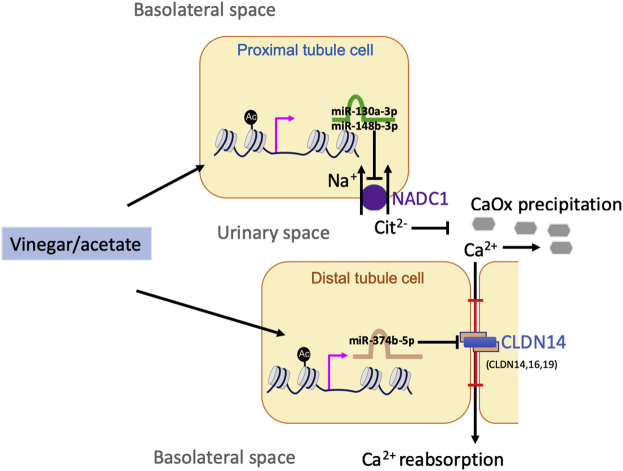
Findings: We found individuals with daily consumption of vinegar compared to those without have a higher citrate and a lower calcium excretion in urine, two critical molecules for calcium oxalate (CaOx) kidney stone in humans. We observed that oral administration of vinegar or 5% acetate increased citrate and reduced calcium in urinary excretion, and finally suppressed renal CaOx crystal formation in a rat model. Mechanism dissection suggested that acetate enhanced acetylation of Histone H3 in renal tubular cells and promoted expression of microRNAs-130a-3p, -148b-3p and -374b-5p by increasing H3K9, H3K27 acetylation at their promoter regions. These miRNAs can suppress the expression of Nadc1 and Cldn14, thus enhancing urinary citrate excretion and reducing urinary calcium excretion. Significantly these mechanistic findings were confirmed in human kidney tissues, suggesting similar mechanistic relationships exist in humans. Results from a pilot clinical study indicated that daily intake of vinegar reduced stone recurrence, increased citrate and reduced calcium in urinary excretion in CaOx stone formers without adverse side effects.

Interpretation: Vinegar prevents renal CaOx crystal formation through influencing urinary citrate and calcium excretion via epigenetic regulations. Vinegar consumption is a promising strategy to prevent CaOx nephrolithiasis occurrence and recurrence. FUND: National Natural Science Foundations of China and National Natural Science Foundation of Guangdong Province.

Keywords: Acetate; Calcium; Citrate; Epigenetic regulation; Nephrolithiasis; Vinegar; microRNA.


Figures

Fig. 1
Fig. 1
Effect of vinegar on urinary composition and renal CaOx crystals formation in the EG-treated rats. (a) Detection of 24-h oxalate exertion in urine samples of each group of rats. (b) Detection of 24-h citrate exertion in urine samples of each group of rats. (c) Detection of 24-h calcium exertion in urine samples of each group rats. (d) Pizzolato staining (left) illustrating CaOx crystal deposition in the kidney and its quantification (right panel). Crystals components in rats kidneys were isolated as CaOx crystals with Fourier-transform infrared spectroscopy analysis (right panel). (e) Representative macrophotographs of Masson-stained kidneys in rats. (f) Kidney weight, serum BUN and creatinine (Cr) concentration in rats. (g) q-PCR analysis of inflammation-related genes expression in kidney from rats. Ctrl, control. EG, ethylene glycol. V, vinegar. Data are given as mean ± SD, from 6 to 8 rats in each group. n.s, not significant, *P < .05, **P < .01, ***P < .001, ****P < .0001 (One-way ANOVA).
Fig. 2
Fig. 2
Vinegar increased urinary citrate excretion via down-regulating the Nadc1 expression. (a) q-PCR analysis of genes expression of citrate transporters in kidney from rats. (b) IHC staining of Nadc1 in kidney tissues from each group of rats (quantitation on the right). (c) Immunofluorescence costaining for Nadc1 and proximal tubular marker Aqp-1 in kidney tissues for each group of rats. (d) Western blot analysis of Nadc1 protein expression after 2 mM sodium acetate and/or 0.5 mM oxalate treatment in HK-2 or NRK-52 cells. (e) q-PCR analysis of Nadc1 mRNA expression after 2 mM sodium acetate and/or 0.5 mM oxalate treatment for 24 h in HK-2 or NRK-52 cells. (f) Western blot analysis of validation of knockdown of Nadc1 using siRNAs. Ctrl, control. EG, ethylene glycol. V, vinegar. Ox, oxalate. Ac, sodium acetate. IRS, immune-reactive score. Data are given as mean ± SD, from 6 to 8 rats in each group. n.s, not significant, **P < .01, ****P < .0001(One-way ANOVA).
Fig. 3
Fig. 3
Acetate suppressed Nadc1 protein expression via up-regulating miR-130a-3p and miR-148b-3p expression. (a) 6 potential miRNAs candidates were screened by q-PCR assay in kidney from rats. (b) q-PCR analysis of 4 miRNA expressions after 2 mM sodium acetate and/or 0.5 mM oxalate treatment for 24 h in HK-2 or NRK-52 cells. (c) HK-2 or NRK-52 cells were transfected with the miR-130a-3p or miR-148b-3p mimic or a negative control (NC). Nadc1 expression was analyzed 48 h later by Western blot. Gapdh serves as a loading control. (d) HK-2 or NRK-52 cells were transfected with the miR-130a-3p or miR-148b-3p inhibitor or a negative control (NC). 24 h later cells were treated with 0.5 mM oxalate or/and 2.0 mM sodium acetate. Nadc1 expression was analyzed 24 h later by Western blot. (e) Co-transfection of Nadc1 3’UTR constructs containing wild type or mutant seed regions with miR-130a-3p and miR-148b-3p into HEK-293 cells and luciferase assay was applied to detect the luciferase activity. Ctrl, control. EG, ethylene glycol. V, vinegar. Ox, oxalate. Ac, sodium acetate. Data are given as mean ± SD, from 6 to 8 rats in each group. n.s, not significant, *P < .05, **P < .01, ***P < .001, ****P < .0001 (Student's t-test).
Fig. 4
Fig. 4
Acetate activated miR-130a-3p and miR-148b-3p through epigenetic regulation. (a) Acetate rescues hyper-oxalate-reduced H3K9 and H3K27 acetylation levels. HK-2 or NRK-52 cells were treated with or without 2 mM sodium acetate under hyper-oxalate condition (0.5 mM) for 24 h. The histone acetylation levels were determined by Western blot. Total H3 served as a loading control. (b) ChIP-qPCR assays showing histone acetylation enrich at miR-130a promoter region in HK-2 cells treated with or without 2 mM sodium acetate under normal or hyper-oxalate condition (0.5 mM) for 24 h. Rabbit IgG was included as a negative control. (c) ChIP-qPCR assays showing histone acetylation enrichment at miR-148b promoter region in HK-2 cells treated as in (b). Each histogram was presented as mean ± SD of triplicate experiments (ns, no significant, **P < .01, ***P < .001; by Student's t-test). (d) IHC staining of H3K9ac and H3K27ac in kidney tissues from each group rats (quantitation on the right) (amplification x200). (e) H3K9 and H3K27 acetylation levels (normalized against Histone H3) in kidney tissues from each group rats were analyzed by western blot. Two pairs of representative samples were shown. (f) Immunofluorescence co-staining for H3K9ac and tubular markers (Aqp-1 or Thp) in kidney tissues from each group rats (amplification x400). (g) Immunofluorescence costaining for H3K27ac and tubular markers (Aqp-1 or Thp) in kidney tissues from each group rats. Ctrl, control. EG, ethylene glycol. V, vinegar. Ox, oxalate. Ac, sodium acetate. n.s, not significant, *P < .05, **P < .01, ***P < .001, ****P < .0001 (One-way ANOVA).
Fig. 5
Fig. 5
Vinegar decreased urinary calcium excretion via epigenetic regulation of miR-374b-5p/Cldn14 signaling. (a) q-PCR analysis of genes expression of calcium transporters in kidney from rats. (b) IHC staining of serial sections for Cldn14 and Thp in kidney tissues from each group rats (quantitation on the right). (c) q-PCR analysis of Cldn14 mRNA expression after 2 mM sodium acetate and/or 3 mM calcium chloride treatment for 24 h in MDCK cells. (d) Western blot analysis of Cldn14 protein expression after 2 mM sodium acetate and/or 3 mM calcium chloride treatment for 24 h in MDCK cells. (e) Cldn14 function was determined by measurement of trans-epithelial electrical resistance (TER) in MDCK cells treated with 1.5 mM calcium chloride and/or 2 mM sodium acetate for 24 h. (f) 3 potential miRNAs candidates were screened by q-PCR assay in kidney tissue from rats. (g) q-PCR analysis of miR-374b-5p expressions after 3 mM calcium chloride and/or 2 mM sodium acetate treatment for 24 h in MDCK cells. (h) MDCK cells were transfected with the miR-374b-5p mimic or a negative control (NC). Cldn14 expression was analyzed 48 h later by Western blot. Gapdh serves as a loading control. (i) MDCK cells were transfected with the miR-374b-5p inhibitor or a negative control (NC). 24 h later cells were treated with 3 mM calcium chloride or/and 2.0 mM sodium acetate. Cldn14 expression was analyzed 24 h later by Western blot. (j) Co-transfection of Cldn14 3’UTR constructs containing wild type or mutant seed regions with miR-374b-5p into HEK-293 cells and luciferase assay was applied to detect the luciferase activity. (k) ChIP-qPCR assays showing histone acetylation enrich at miR-374b promoter region in MDCK cells treated with or without 2 mM sodium acetate for 24 h. Rabbit IgG was included as a negative control. Ctrl, control. EG, ethylene glycol. V, vinegar. Ac, sodium acetate. CaCl2, calcium chloride. Data are given as mean ± SD, from 6 to 8 rats in each group. n.s, not significant, *P < .05, **P < .01, ***P < .001, ****P < .0001 (One-way ANOVA for a, b, c, e, f and g; Student's t-test for j and k).
Fig. 6
Fig. 6
Antagomir treatments attenuated vinegar effects of regulating urinary citrate and calcium and suppressing CaOx crystal formation. (a) A diagram describing the injection schedule for antagomir; EG, ethylene glycol; i.p., intraperitoneal injection. (b) Detection of 24-h citrate (left) and calcium (right) exertion in urine samples of each group rats. (c) Pizzolato staining illustrating CaOx crystal deposition in the kidney and its quantification. (d) Kidney weight in rats. (e) Serum BUN and Cr concentration in rats. (f) IHC staining of Nadc1 in kidney tissues from each group rats (quantitation on the right). (g) IHC staining of Cldn14 in kidney tissues from each group rats (quantitation on the right). Ctrl, control. EG, ethylene glycol. V, vinegar. Data are given as mean ± SD, from 6 rats in each group. n.s, no significant, *P < .05, **P < .01, ***P < .001, ****P < .0001 (One-way ANOVA).
Fig. 7
Fig. 7
Agomir treatments mimicked vinegar effects in regulating urinary citrate and calcium and suppressing CaOx crystal formation. (a) A diagram describing the injection schedule for antagomir; EG, ethylene glycol; i.p., intraperitoneal injection. (b) Detection of 24-h oxalate (left), citrate (second from left), calcium (second from right) excretion and pH value (right) in urine samples of each group rats. (c) Pizzolato staining illustrating CaOx crystal deposition in the kidney and its quantification. (d) Kidney weight in rats. (e) Serum BUN and Cr concentration in rats. (f) IHC staining of Nadc1 in kidney tissues from each group rats (quantitation on the right). (g) IHC staining of Cldn14 in kidney tissues from each group rats (quantitation on the right). NC, negative control. Data are given as mean ± SD, from 5 rats in each group. n.s, not significant, *P < .05, **P < .01, ***P < .001, ****P < .0001 (Student's t-test).
Fig. 8
Fig. 8
Vinegar consumption positively correlated with histone acetylation and miRNA expressions, and negatively correlated with NADC1 and CLDN14 expressions in human kidney tissue. (a) IHC staining of NADC1 in kidney tissues from 18 individuals who consumed vinegar daily and 17 individuals who did not (quantitation on the right). (b) IHC staining of CLDN14 in kidney tissues from 18 individuals who consumed vinegar daily and 17 individuals who did not (quantitation on the right). (c) Representative IHC staining results for H3K9/K27 acetylation in kidney tissues from individuals who consumed vinegar daily and individuals who did not (quantitation on the right). (d) Representative MISH combined IF staining results for hsa-miR-130a-3p in proximal tubule (AQP-1 as marker) in kidney tissues from 18 individuals who consumed vinegar daily and 17 individuals who did not (quantitation on the right) (amplification x400). (e) Representative MISH-IF staining for hsa-miR-148b-3p in proximal tubules (AQP-1 positive) in kidney tissues from 18 individuals who consumed vinegar daily and 17 individuals who did not (quantitation on the right) (amplification x400). (f) Representative MISH-IF staining for hsa-miR-374b-5p in TAL (THP positive) in kidney tissues from 18 individuals who consumed vinegar daily and 17 individuals who did not (quantitation on the right) (amplification x400). (g) q-PCR results for miRNA expression (Hsa-miR-130a-3p, −148b-3p, −374b-5p) in kidney tissues from individuals who consumed vinegar daily and individuals who did not. n.s, no significant, *P < .05, **P < .01, ***P < .001, ****P < .0001 (Student's t-test).
Fig. 9
Fig. 9
Vinegar effect in CaOx kidney stone patients. (a) Study design overview. (b) Chart showing patient selection and assessment at 6 or 12-month follow-up. (c) Kaplan–Meier estimates of the cumulative incidence of recurrent stones in both groups. HI, hazard ratio. CI, confidence interval. (d) Waterfall plots of change of AP(CaOx) indexes after 6–12 months intervention in both groups. (e) Waterfall plots of actual value change of urinary citrate excretion after 6–12 months intervention in both groups. (f) Waterfall plots of urinary citrate excretion change compared to baseline after 6–12 months intervention in both groups. We defined lesser or equal to 20% change in citrate level from baseline after intervention as no response. (g) Waterfall plots of actual value change of urinary calcium excretion after 6–12 months intervention in both groups. (h) Waterfall plots of urinary calcium excretion compared to baseline after 6–12 months intervention in both groups. We defined lesser or equal to 10% change in calcium level from baseline after intervention as no response. (i) Urine pH change after 6–12 months intervention in both groups. *P < .05, **P < .01, ****P < .0001 (Chi-square test).
Fig. 10
Fig. 10
A scheme of vinegar effect. The scheme summarizes the pathway described: vinegar or acetate enhances the H3K9 or/and H3K27 acetylation levels at miR-130a, miR-148b, miR-374b promoter regions, which downregulate Nadc1 and Cldn14 expression, and increase urinary citrate excretion while decrease calcium excretion to suppress CaOx crystal formations.

References

    1. Zeng G., Mai Z., Xia S., Wang Z., Zhang K., Wang L. Prevalence of kidney stones in China: an ultrasonography based cross-sectional study. BJU Int. 2017 Jul;120(1):109–116. - PubMed
    1. Scales C.D., Smith A.C., Hanley J.M., Saigal C.S. Prevalence of kidney stones in the United States. Eur Urol. 2012 Jul;62(1):160–165. - PMC - PubMed
    1. Lotan Y., Antonelli J., Jiménez I.B., Gharbi H., Herring R., Beaver A. The kidney stone and increased water intake trial in steel workers: results from a pilot study. Urolithiasis. 2017 Apr;45(2):177–183. - PubMed
    1. Fink H.A., Wilt T.J., Eidman K.E., Garimella P.S., MacDonald R., Rutks I.R. Medical management to prevent recurrent nephrolithiasis in adults: a systematic review for an American College of Physicians Clinical Guideline. Ann Intern Med. 2013 Apr 2;158(7):535–543. - PubMed
    1. Wu W., Yang D., Tiselius H.-G., Ou L., Liang Y., Zhu H. The characteristics of the stone and urine composition in Chinese stone formers: primary report of a single-center results. Urology. 2014 Apr;83(4):732–737. - PubMed

MeSH terms