. 2019 Jul:45:58-69.
doi: 10.1016/j.ebiom.2019.06.002. Epub 2019 Jun 13.

The binding of lncRNA RP11-732M18.3 with 14-3-3 β/α accelerates p21 degradation and promotes glioma growth

Affiliations

The binding of lncRNA RP11-732M18.3 with 14-3-3 β/α accelerates p21 degradation and promotes glioma growth

Chun-Min Kang et al. EBioMedicine. 2019 Jul.

Abstract

Background: Long noncoding RNAs (lncRNAs) have been identified as regulators of a number of developmental and tumorigenic processes. However, the functions of most lncRNAs in glioma remain unknown and the mechanisms governing the proliferation of tumor cells remain poorly defined.

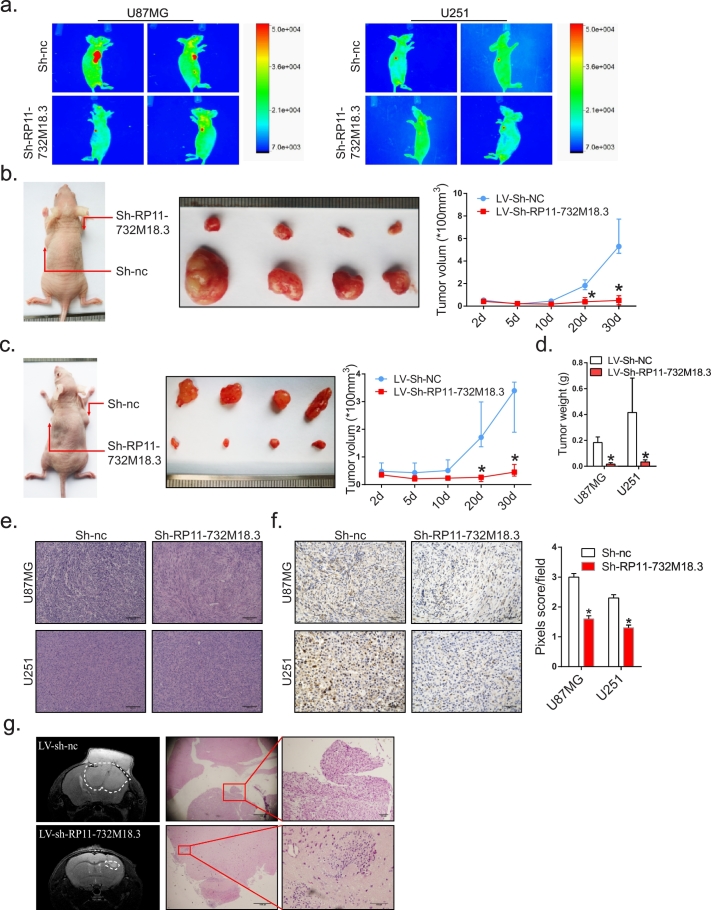
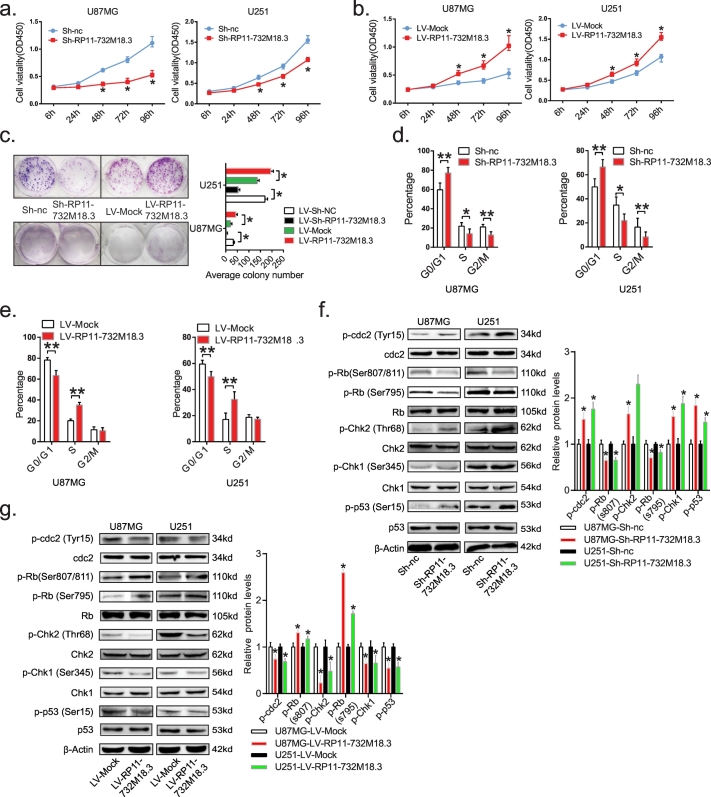
Methods: Both in vitro and in vivo assays were performed to investigate the roles of lncRNAs in the pathophysiology of gliomas. lncRNA arrays were used to identify differentially expressed lncRNAs. Subcutaneous tumor formation and a brain orthotopic tumor model in nude mice were used to investigate the functions of lncRNAs in vivo. The in vitro functions of lncRNAs were analyzed by fluorescence-activated cell sorting, colony formation, and western blot analyses. RNA fluorescence in situ hybridization and immunoprecipitation were used to explore the underlying mechanisms.

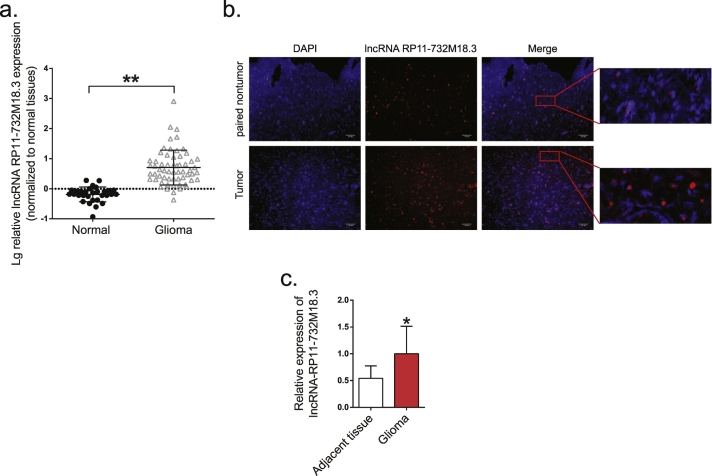
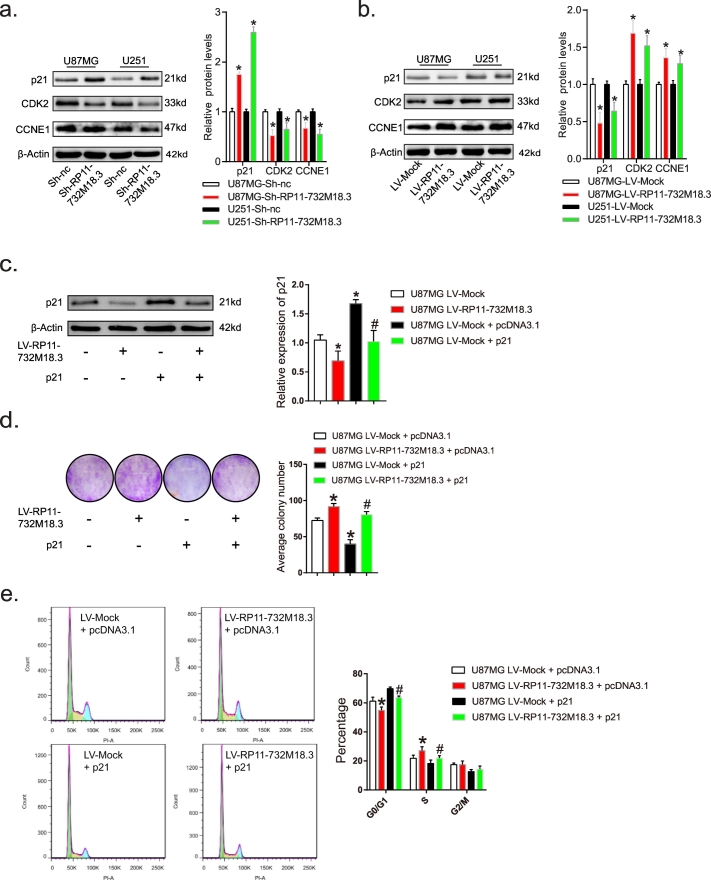
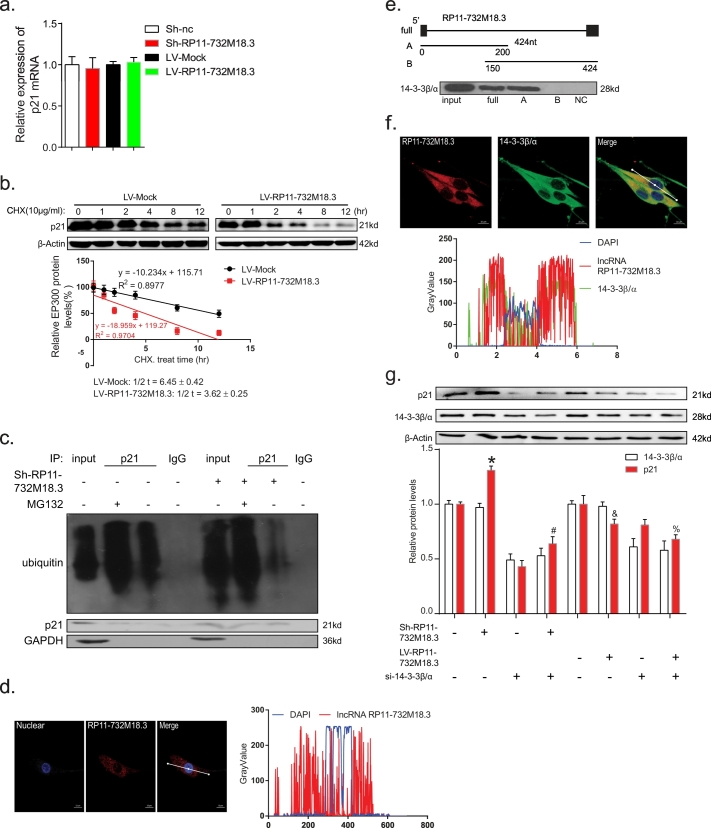
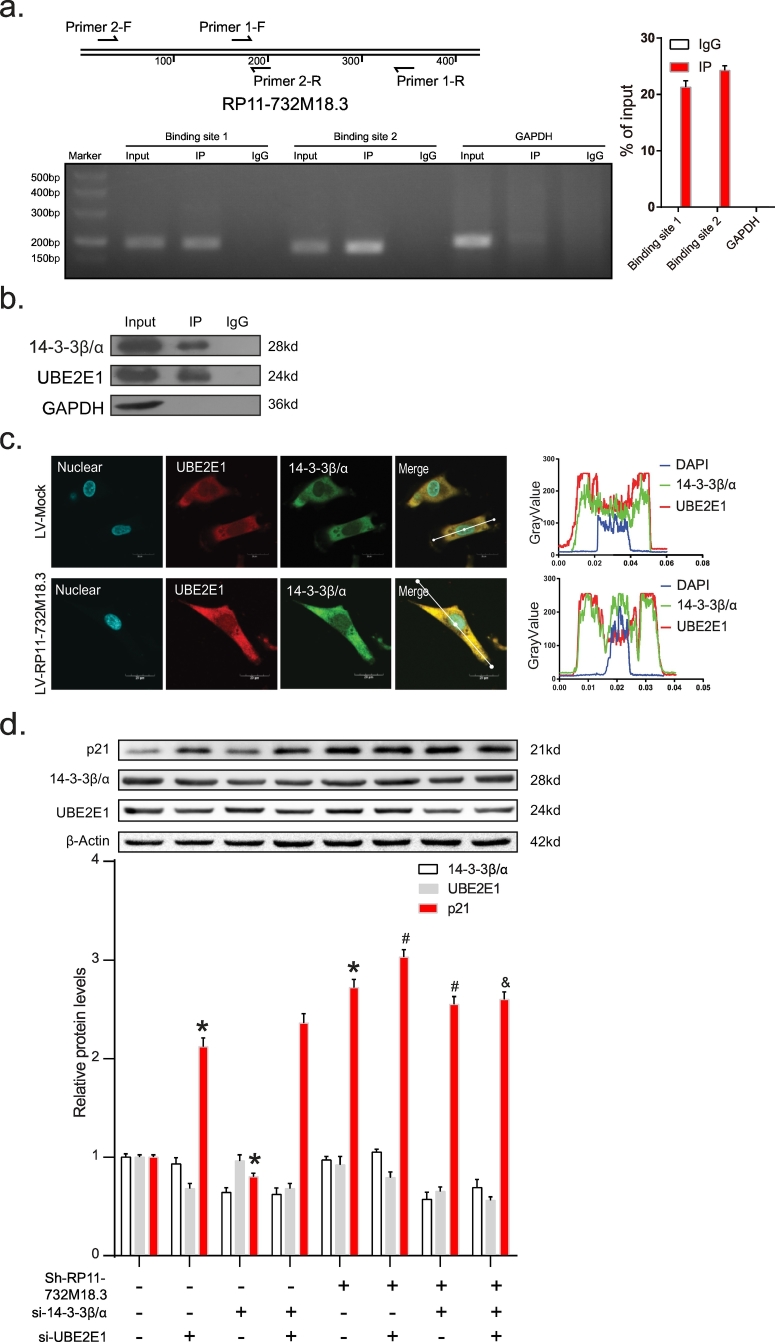
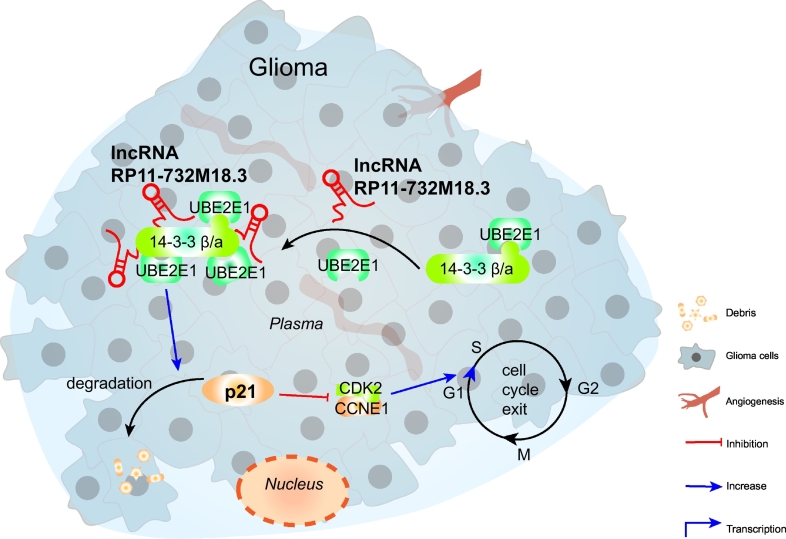
Findings: Here, we describe the newly discovered noncoding RNA RP11-732M18.3, which is highly overexpressed in glioma cells and interacts with 14-3-3β/α to promote glioma growth, acting as an oncogene. Overexpression of lncRNA RP11-732 M18.3 was associated with the proliferation of glioma cells and tumor growth in vitro and in vivo. Remarkably, lncRNA RP11-732M18.3 promoted cell proliferation and G1/S cell cycle transition. lncRNA RP11-732M18.3 is predominately localized in the cytoplasm. Mechanistically, the interaction of lncRNA RP11-732M18.3 with 14-3-3β/α increases the degradation of the p21 protein. lncRNA RP11-732M18.3 promoted the recruitment of ubiquitin-conjugating enzyme E2 E1 to 14-3-3β/α and the binding of 14-3-3β/α with ubiquitin-conjugating enzyme E2 E1 (UBE2E1) promoted the degradation of p21.

Interpretation: Overall these data demonstrated that lncRNA RP11-732M18.3 regulates glioma growth through a newly described lncRNA-protein interaction mechanism. The inhibition of lncRNA RP11-732M18.3 could provide a novel therapeutic target for glioma treatment.

Keywords: 14-3-3β/α; Glioma; Tumorigenesis; lncRNA RP11-732M18.3; p21.


Conflict of interest statement

The authors declare no competing financial interests.

Figures

Fig. 1
Fig. 1
lncRNA-RP11-732 M18.3 overexpression in glioma tissues. (a) lncRNA-RP11-732 M18.3 expression in glioma samples and normal tissues was analyzed by qRT-PCR. The log10 transformation was applied to the expression levels, which were normalized to that of U6 (**p < .01, Student's t-test). (b) Representative images of lncRNA-RP11-732 M18.3 expression from paired non-tumor and tumor tissues by RNA FISH. All experiments were performed in triplicate (n = 6). (c) Quantification of immunofluorescence RNA FISH. Data are presented as the mean ± standard deviation (SD) (n = 6, *p < .05, Student's t-test).
Fig. 2
Fig. 2
Knockdown of lncRNA-RP11-732 M18.3 inhibits glioma growth in vivo. (a) Representative fluorescence intensity images of mice over time after axilla injection with the indicated cell clones (n = 4). (b) Effects of lncRNA-RP11-732 M18.3 knockdown on tumor growth in vivo. Left: Representative images of nude mice injected subcutaneously with U87MG cells with knockdown of lncRNA-RP11-732 M18.3. Middle: Representative images of tumors. Right: Tumor growth curves. All experiments were performed in triplicate (n = 4, *p < .05, Student's t-test). (c) Effects of lncRNA-RP11-732 M18.3 knockdown on tumor growth in vivo. Left: Representative images of nude mice injected subcutaneously with U251 cells with knockdown of lncRNA RP11-732 M18.3. Middle: Representative images of tumors. Right: Tumor growth curves. All experiments were performed in triplicate (n = 4, *p < .05, Student's t-test). (d) Quantification of tumor weights from (b) and (c). All experiments were performed in triplicate (n = 4, *p < .05, Student's t-test). (e) Representative images of hematoxylin and eosin staining of xenografts. (f) Left: Representative images of Ki67 staining of xenografts. Right: Quantification of Ki67+ cells (*p < .05, Student's t-test). (g) Nude mice were implanted intracranially with U87MG cells stably knocking down lncRNA RP11-732 M18.3. Left: Representative, contrast-enhanced, T2-weighted images of the mouse brain were obtained using a small animal MRI system (PharmaScan 70/16 US; Bruker, Billerica, MA, USA). Right: An hematoxylin-eosin stained histological section showing tumor cells.
Fig. 3
Fig. 3
lncRNA-RP11-732 M18.3 promotes the G1/S transition. (a) Cell growth rates were determined with the cell counting kit-8 assay. Knockdown of lncRNA-RP11-732 M18.3 in U87MG and U251 cells significantly inhibited cell proliferation, relative to control cells. All experiments were performed in triplicate (n = 3, *p < .05, Student's t-test). (b) lncRNA-RP11-732 M18.3 overexpression enhanced the proliferation of U87MG and U251 cells. All experiments were performed in triplicate. (n = 3, *p < .05, Student's t-test). (c) lncRNA-RP11-732 M18.3 depletion inhibited the clonal formation, overexpression enhanced. All experiments were performed in triplicate. (n = 3, *p < .05, Student's t-test). (d) FACS analysis showing significant increases or decreases of U87MG and U251 cells with knockdown of lncRNA-RP11-732 M18.3 in the G1 or S phase, respectively. All experiments were performed in triplicate. (n = 3, *p < .05, Student's t-test). (e) U87MG and U251 cells in S phase increased significantly by overexpression of lncRNA-RP11-732 M18.3 (n = 3, *p < .05, Student's t-test). (f and g) Western blot analysis of the phosphorylation level of G1/S checkpoint key proteins in U87MG and U251 cells with lncRNA-RP11-732 M18.3 depletion or overexpression. All experiments were performed in triplicate (n = 3, *p < .05, Student's t-test).
Fig. 4
Fig. 4
lncRNA-RP11-732 M18.3 promotes G1/S transition via p21 regulation. (a) lncRNA-RP11-732 M18.3 inhibits the expression of p21, CCNE1, and CDK2 after lncRNA-RP11-732 M18.3 silencing in U87MG and U251 cells. All experiments were performed in triplicate (n = 3, *p < .05, Student's t-test). (b) Overexpression of lncRNA-RP11-732 M18.3 decreased the levels of p21, CCNE1, and CDK2 in U87MG and U251 cells. All experiments were performed in triplicate (n = 3, *p < .05, Student's t-test). (c) Western blot analysis of p21 following the indicated treatments showing successful overexpression. All experiments were performed in triplicate (n = 3, *p < .05, Student's t-test). (d) Enforced expression of the p21 rescue of the proliferation phenotype caused by RP11-732 M18.3. pcDNA3.1 = plasmid control vector. P21 = enforced p21 expression plasmid vector. All experiments were performed in triplicate (n = 3, *p < .05, Student's t-test). (e) Enforced expression of p21 rescued G1/S transition caused by RP11-732 M18.3. Representative images of cell cycle distribution in U87MG and U251 cells following the indicated treatments. Enforced expression of p21 rescued G1/S transition caused by RP11-732 M18.3. The results are expressed as the mean ± SD. All experiments were performed in triplicate (n = 3, *p < .05, Student's t-test) vs. the first group, #p < .05 vs. the second group.
Fig. 5
Fig. 5
The interaction of lncRNA-RP11-732 M18.3 with 14–3-3β/α promoted p21 degradation. (a) lncRNA-RP11-732 M18.3 had no effect on the mRNA level of p21. All experiments were performed in triplicate in U87MG cell lines (n = 3, *p < .05, Student's t-test). (b) Endogenous p21 protein levels in U87MG cells overexpressing lncRNA-RP11-732 M18.3 were monitored at the indicated time points after cycloheximide (CHX) (10 μg/ml) treatment in U87MG cell lines. The upper panels are western blots using the antibodies indicated to the left and the lower graph represents a quantification of p21 normalized to β-actin as a function of time after CHX treatment. The half degradation of lncRNA-RP11-732 M18.3 overexpression, as compared with the control group (3.62 ± 0.25 vs. 6.45 ± 0.42 h, respectively). All experiments were performed in triplicate (n = 3, *p < .05, Student's t-test). (c) Ubiquitin-dependent degradation of p21. Knockdown of lncRNA-RP11-732 M18.3 inhibited the ubiquitin level of p21 in U87MG cell lines. (d) Image showing RNA FISH targeting lncRNA-RP11-732 M18.3 in U87MG cells. The graph below shows the overlap of fluorescence intensity peaks along with profiles spanning the cells. Scale bars, 10 mm. DAPI, 4′,6-diamidino-2-phenylindole. (n = 3). (e) Schematic outline of the pull-down strategy. The 5′-end (0–150 nt) of lncRNA-RP11-732 M18.3 is essential for the association between lncRNA-RP11-732 M18.3 and 14–3-3β/α. (f) Co-localization analysis: RNA FISH assay of lncRNA-RP11-732 M18.3 combined with immunofluorescence detection of 14–3-3β/α in U87MG cells. The graph below shows the overlap of fluorescence intensity peaks along with profiles spanning the cells. Scale bars, 10 mm. DAPI. (n = 3). (g) Western blot analysis of p21 in U87MG cells with the indicated treatments. Sh = lentiviruses encoding lncRNA-RP11-732 M18.3 short hairpin RNA; Lv = lentiviruses encoding lncRNA-RP11-732 M18.3 overexpress RNA; Si = small interfering RNAs. The results are expressed as the mean ± SD. All experiments were performed in triplicate. (n = 3, *p < .05 vs. the first group, #p < .05 vs. the second group, &p < .05 vs. the fifth group, and %p < .05 vs. the sixth group, One-Way ANOVA).
Fig. 6
Fig. 6
lncRNA-RP11-732 M18.3 promoted the recruitment of UBE2E1 to 14–3-3β/α. (a) U87MG total cell lysates were immunoprecipitated with either UBE2E1 antibody or immunoglobulin (IgG) as a control group. RNAs were detected by qRT-PCR as indicated. (b) Co-IP of endogenous UBE2E1 and 14–3-3β/α in U87MG cell lysates using antibodies specific for UBE2E1. (c) Colocalization analysis: Immunofluorescence assay of UBE2E1 combined with immunofluorescence detection of 14–3-3β/α in U87MG cells. The graph on the right shows the overlap of fluorescence intensity peaks along with profiles spanning the cells. Blue = nuclear; Green = 14–3-3β/α, and Red = UBE2E1. Scale bars, 20 mm. DAPI. (n = 3). (d) Western blot analysis of p21 in U87MG cells following the indicated treatments. Si = small interfering RNAs. The results are expressed as the mean ± SD. All experiments were performed in triplicate (n = 3, *p < .05, One-Way ANOVA) vs. the first group, #p < .05 vs. the fifth group, and &p < .05 vs. the seventh group. (For interpretation of the references to colour in this figure legend, the reader is referred to the web version of this article.)
Fig. 7
Fig. 7
Model depicting the roles of lncRNA-RP11-732 M18.3 in the regulation of the cell cycle and tumor growth. lncRNA-RP11-732 M18.3 promotes the recruitment of UBE2E1 to 14–3-3β/α, which promotes the degradation activity of UBE2E1 on p21, and promotes cell proliferation and glioma development.

References

    1. Engreitz J.M. Local regulation of gene expression by lncRNA promoters, transcription and splicing. Nature. 2016;539:452–455. - PMC - PubMed
    1. Kato M. An endoplasmic reticulum stress-regulated lncRNA hosting a microRNA megacluster induces early features of diabetic nephropathy. Nat Commun. 2016;7 - PMC - PubMed
    1. Parikshak N.N. Genome-wide changes in lncRNA, splicing, and regional gene expression patterns in autism. Nature. 2016;540 423-+ - PMC - PubMed
    1. Gloss B.S., Dinger M.E. The specificity of long noncoding RNA expression. Biochim Biophys Acta. 2016;1859:16–22. - PubMed
    1. Kato M. An endoplasmic reticulum stress-regulated lncRNA hosting a microRNA megacluster induces early features of diabetic nephropathy. Nat Commun. 2016;7:16. - PMC - PubMed

MeSH terms