. 2019 Sep;62(9):1601-1615.
doi: 10.1007/s00125-019-4906-1. Epub 2019 Jun 15.

Discovery of biomarkers for glycaemic deterioration before and after the onset of type 2 diabetes: descriptive characteristics of the epidemiological studies within the IMI DIRECT Consortium

Affiliations

Discovery of biomarkers for glycaemic deterioration before and after the onset of type 2 diabetes: descriptive characteristics of the epidemiological studies within the IMI DIRECT Consortium

Robert W Koivula et al. Diabetologia. 2019 Sep.

Abstract

Aims/hypothesis: Here, we describe the characteristics of the Innovative Medicines Initiative (IMI) Diabetes Research on Patient Stratification (DIRECT) epidemiological cohorts at baseline and follow-up examinations (18, 36 and 48 months of follow-up).

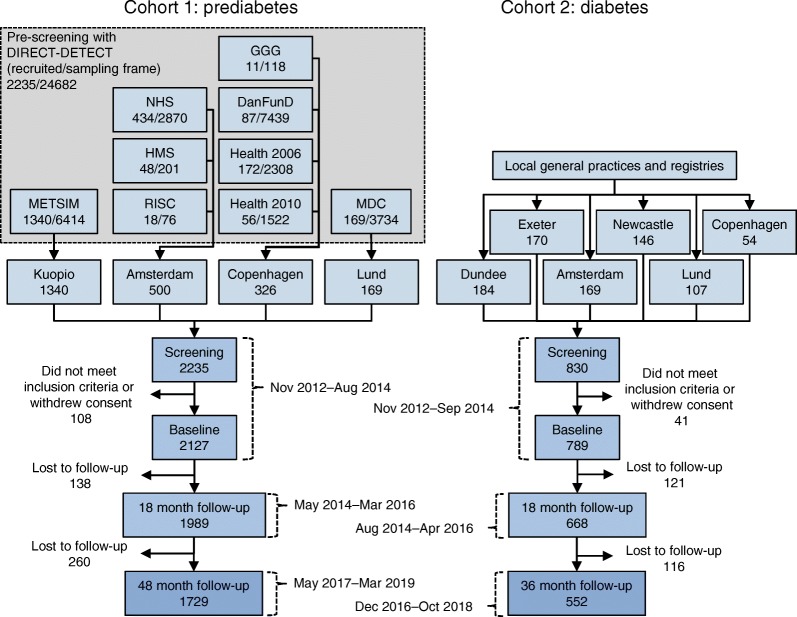
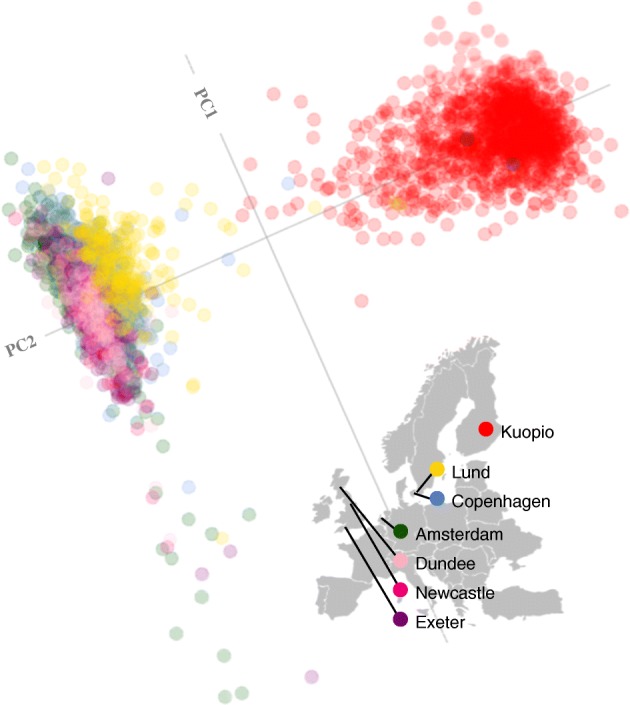
Methods: From a sampling frame of 24,682 adults of European ancestry enrolled in population-based cohorts across Europe, participants at varying risk of glycaemic deterioration were identified using a risk prediction algorithm (based on age, BMI, waist circumference, use of antihypertensive medication, smoking status and parental history of type 2 diabetes) and enrolled into a prospective cohort study (n = 2127) (cohort 1, prediabetes risk). We also recruited people from clinical registries with type 2 diabetes diagnosed 6-24 months previously (n = 789) into a second cohort study (cohort 2, diabetes). Follow-up examinations took place at ~18 months (both cohorts) and at ~48 months (cohort 1) or ~36 months (cohort 2) after baseline examinations. The cohorts were studied in parallel using matched protocols across seven clinical centres in northern Europe.

Results: Using ADA 2011 glycaemic categories, 33% (n = 693) of cohort 1 (prediabetes risk) had normal glucose regulation and 67% (n = 1419) had impaired glucose regulation. Seventy-six per cent of participants in cohort 1 was male. Cohort 1 participants had the following characteristics (mean ± SD) at baseline: age 62 (6.2) years; BMI 27.9 (4.0) kg/m2; fasting glucose 5.7 (0.6) mmol/l; 2 h glucose 5.9 (1.6) mmol/l. At the final follow-up examination the participants' clinical characteristics were as follows: fasting glucose 6.0 (0.6) mmol/l; 2 h OGTT glucose 6.5 (2.0) mmol/l. In cohort 2 (diabetes), 66% (n = 517) were treated by lifestyle modification and 34% (n = 272) were treated with metformin plus lifestyle modification at enrolment. Fifty-eight per cent of participants in cohort 2 was male. Cohort 2 participants had the following characteristics at baseline: age 62 (8.1) years; BMI 30.5 (5.0) kg/m2; fasting glucose 7.2 (1.4) mmol/l; 2 h glucose 8.6 (2.8) mmol/l. At the final follow-up examination, the participants' clinical characteristics were as follows: fasting glucose 7.9 (2.0) mmol/l; 2 h mixed-meal tolerance test glucose 9.9 (3.4) mmol/l.

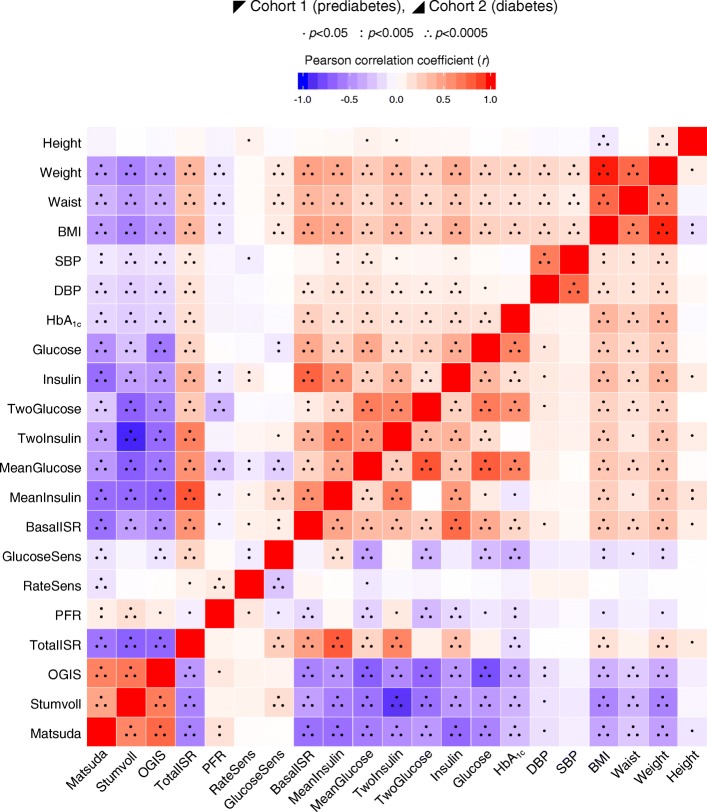
Conclusions/interpretation: The IMI DIRECT cohorts are intensely characterised, with a wide-variety of metabolically relevant measures assessed prospectively. We anticipate that the cohorts, made available through managed access, will provide a powerful resource for biomarker discovery, multivariate aetiological analyses and reclassification of patients for the prevention and treatment of type 2 diabetes.

Keywords: Diet; Ectopic fat; Genome; Glycaemic control; Insulin secretion; Insulin sensitivity; Personalised medicine; Physical activity; Prediabetes; Type 2 diabetes.


Figures

Fig. 1
Fig. 1
Participant flow of cohorts 1 and 2. DanFunD, Danish Functional Disability study; GGG, Gut, Grain and Greens study; HMS, Hoorn Meal Study; METSIM, Metabolic Syndrome in Men study; NHS, New Hoorn Study; RISC, Relationship between Insulin Sensitivity and Cardiovascular disease cohort
Fig. 2
Fig. 2
Pairwise correlation matrix. Fill colour indicates Pearson correlation coefficient (r), where positive is denoted by red fill, inverse by blue fill and magnitude by intensity. Cohorts 1 and 2 are separate, above and below the diagonal, respectively. All continuous variables were normally transformed and adjusted for age, sex and study centre. ActGLP1min0, fasting intact GLP-1 concentration; BasalISR, fasting insulin secretion; CHOI, carbohydrate intake; Chol, total cholesterol; DBP, diastolic blood pressure; FatI, fat intake; FibreI, fibre intake; Glucagonmin0, fasting glucagon; Glucose, fasting glucose; GlucoseSens, glucose sensitivity; HDL, fasting HDL-cholesterol; IncGLP1min60, 1 h GLP-1 increment; IncGlucagonmin60, 1 h glucagon increment; Insulin, fasting insulin; LDL, fasting LDL-cholesterol; LiverFat, liver fat; LiverIron, liver iron content; LPA, light physical activity (% of time); Matsuda, Matsuda insulin sensitivity index; MeanGlucose, mean 2 h glucose; MeanInsulin, mean 2 h insulin; MPA, moderate physical activity (% of time); MUFatI, monounsaturated fat intake; OGIS, 2 h insulin sensitivity; PA, mean physical activity intensity; hpfVM; PancFat, pancreatic fat; PancIron, pancreatic iron content; PFR, potentiation factor ratio; ProInsmin60, 1 h intact proinsulin; ProteinI, protein intake; PUFatI, polyunsaturated fat intake; RateSens, rate sensitivity; SatFatI, saturated fat intake; SBP, systolic blood pressure; SPA, sedentary (% of time); Stumvoll, Stumvoll insulin sensitivity index; SugarI, sugar intake; TEI, total energy intake; TG, fasting triacylglycerol; TotalISR, integral of total insulin secretion; TotGLP1min0, fasting total GLP-1 concentration; TwoGlucose, 2 h glucose; TwoInsulin, 2 h insulin; VPA, vigorous physical activity (% of time)
Fig. 3
Fig. 3
Pairwise correlation matrix of follow-up Δ (difference between 48 month follow-up assessment and baseline visit). Fill colour indicates Pearson correlation coefficient (r), where positive is denoted by red fill, inverse by blue fill and magnitude by intensity. Cohorts 1 and 2 are separate, above and below diagonal, respectively. All continuous variables were normally transformed and adjusted for age, sex and study centre. BasalISR, fasting insulin secretion; DBP, diastolic blood pressure; Glucose, fasting glucose; GlucoseSens, glucose sensitivity; Insulin, fasting insulin; Matsuda, Matsuda insulin sensitivity index; MeanGlucose, mean 2 h glucose; MeanInsulin, mean 2 h insulin; OGIS, insulin sensitivity (2 h OGIS); PFR, potentiation factor ratio; RateSens, rate sensitivity; SBP, systolic blood pressure; Stumvoll, Stumvoll insulin sensitivity index; TotalISR, integral of total insulin secretion; TwoGlucose, 2 h glucose; TwoInsulin, 2 h insulin.
Fig. 4
Fig. 4
Genetic population structure within the cohorts. A statistical summary of genetic data from cohorts 1 and 2 (combined) based on principal component axis one (PC1) and axis two (PC2). Points are coloured according to recruitment centre

References

    1. Cho NH, Shaw JE, Karuranga S, et al. IDF diabetes atlas: global estimates of diabetes prevalence for 2017 and projections for 2045. Diabetes Res Clin Pract. 2018;138:271–281. doi: 10.1016/j.diabres.2018.02.023. - DOI - PubMed
    1. American Diabetes Association Standards of medical care in diabetes--2011. Diabetes Care. 2011;34(Suppl 1):S11–S61. doi: 10.2337/dc11-S011. - DOI - PMC - PubMed
    1. Weyer C, Bogardus C, Mott DM, Pratley RE. The natural history of insulin secretory dysfunction and insulin resistance in the pathogenesis of type 2 diabetes mellitus. J Clin Invest. 1999;104(6):787–794. doi: 10.1172/JCI7231. - DOI - PMC - PubMed
    1. Ringborg A, Lindgren P, Yin DD, Martinell M, Stalhammar J. Time to insulin treatment and factors associated with insulin prescription in Swedish patients with type 2 diabetes. Diabetes Metab. 2010;36(3):198–203. doi: 10.1016/j.diabet.2009.11.006. - DOI - PubMed
    1. Rathmann W, Strassburger K, Heier M, et al. Incidence of type 2 diabetes in the elderly German population and the effect of clinical and lifestyle risk factors: KORA S4/F4 cohort study. Diabet Med. 2009;26(12):1212–1219. doi: 10.1111/j.1464-5491.2009.02863.x. - DOI - PubMed

Publication types