. 2020 Mar;16(3):435-450.
doi: 10.1080/15548627.2019.1628536. Epub 2019 Jun 16.

Inactivation of MTOR promotes autophagy-mediated epithelial injury in particulate matter-induced airway inflammation

Affiliations

Inactivation of MTOR promotes autophagy-mediated epithelial injury in particulate matter-induced airway inflammation

Yin-Fang Wu et al. Autophagy. 2020 Mar.

Abstract

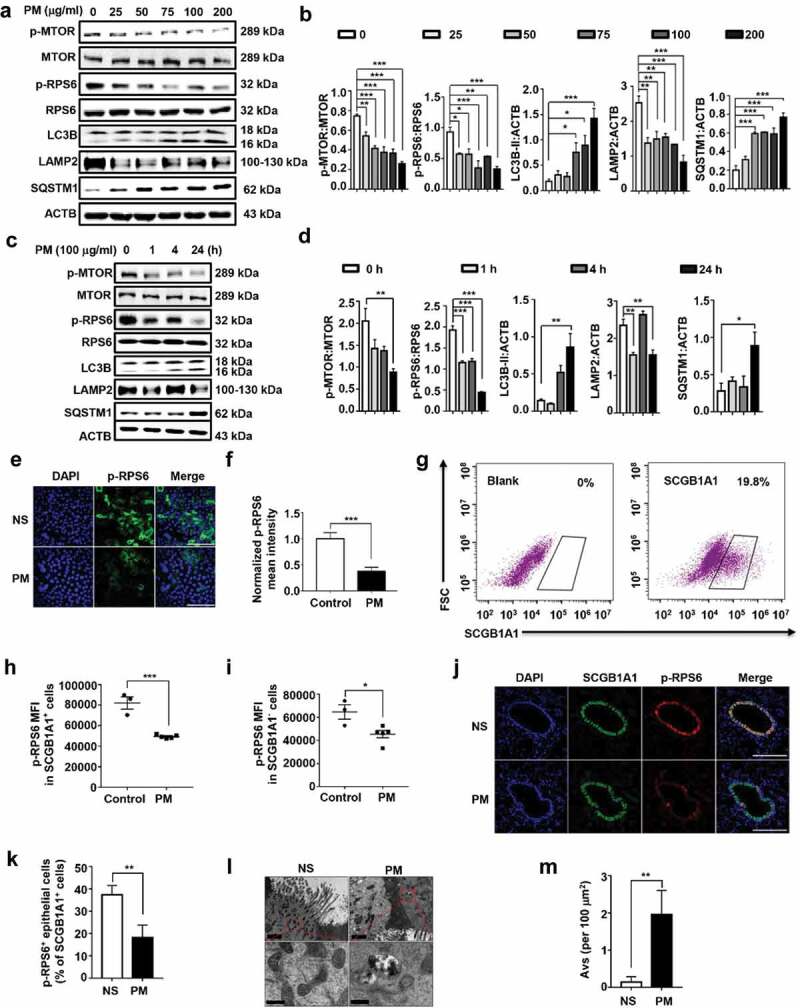
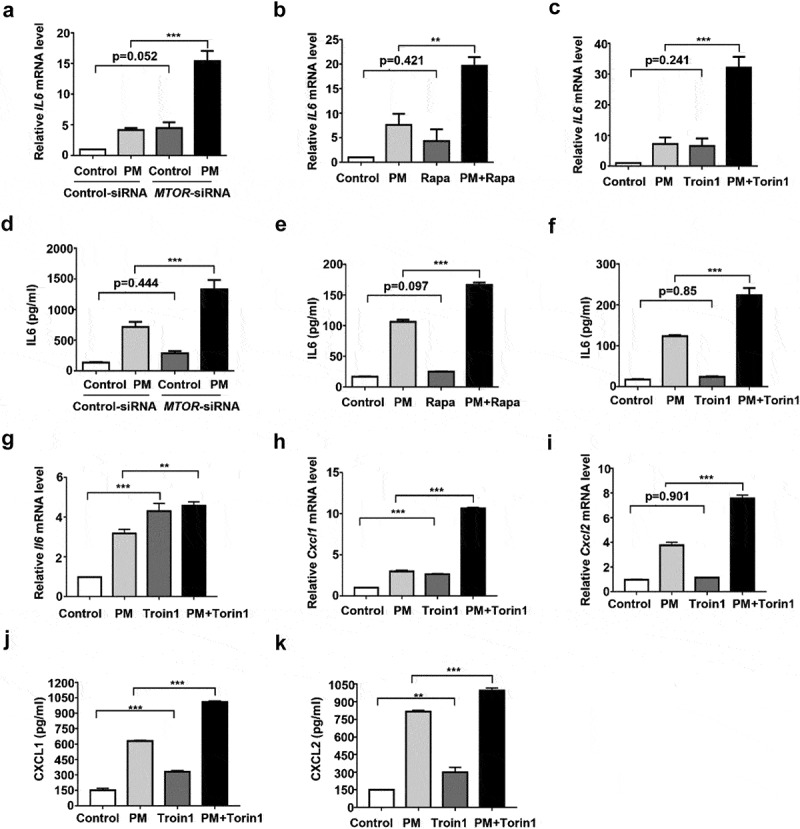
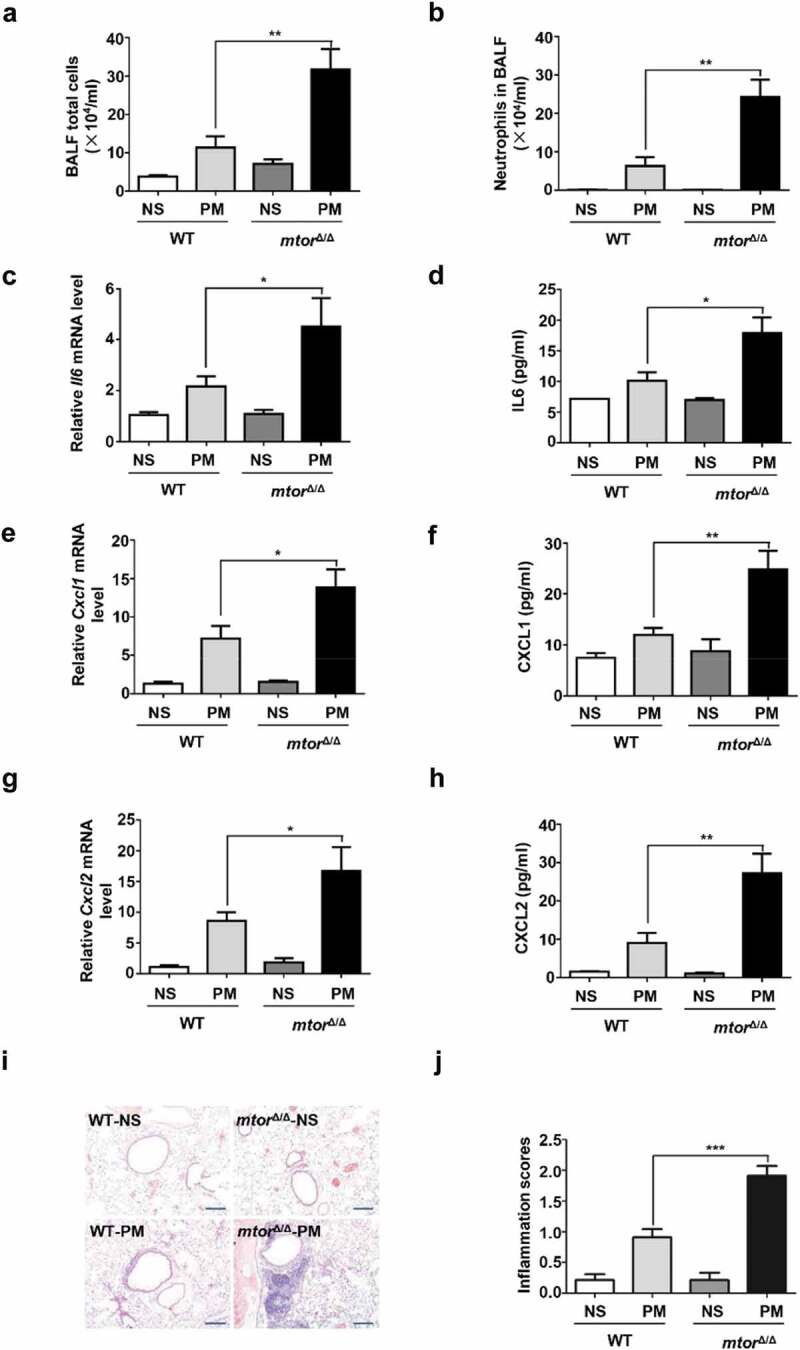
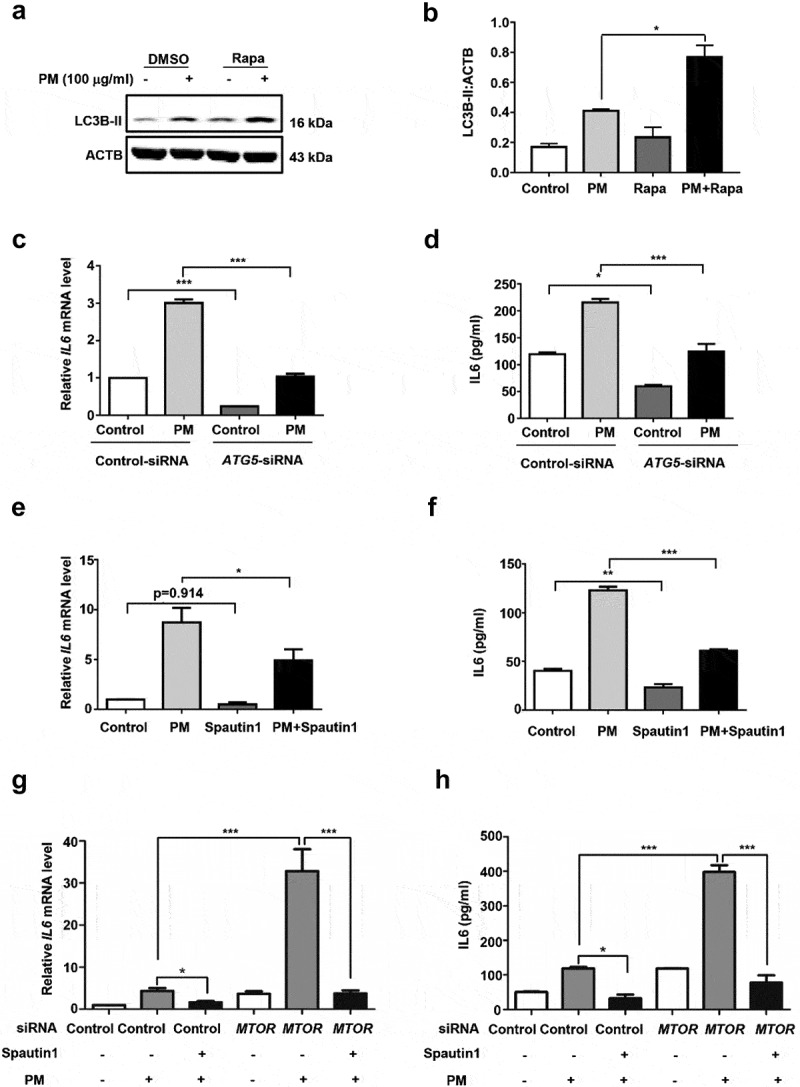
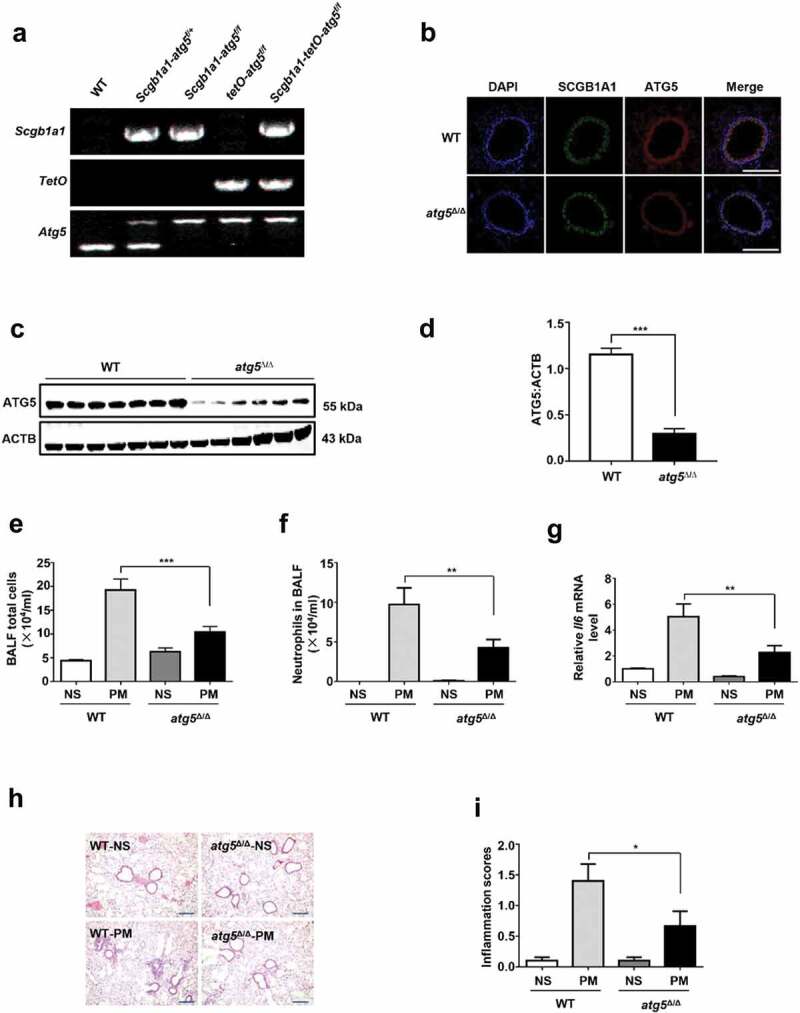
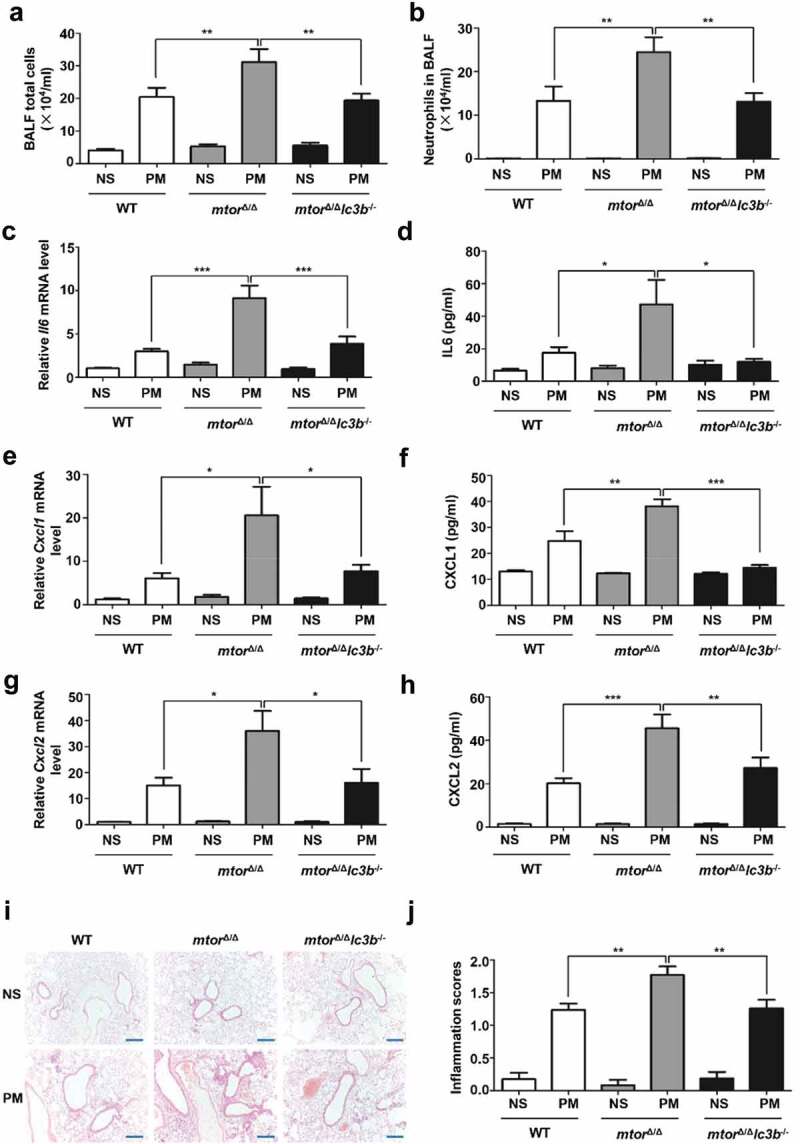
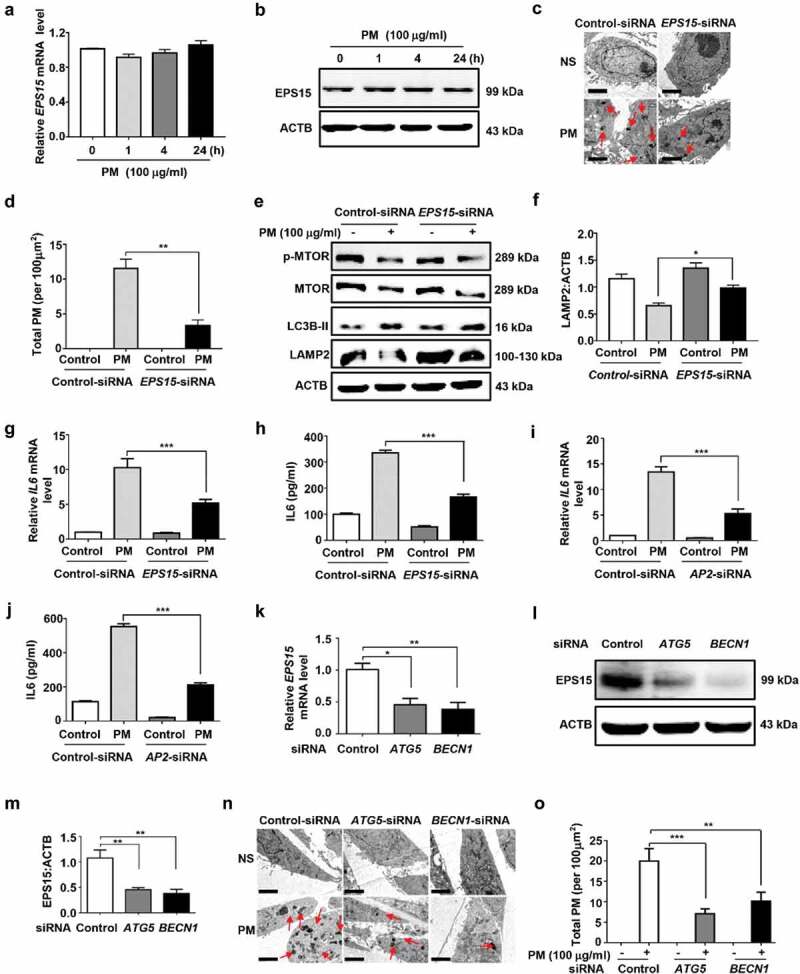
Particulate matter (PM) is able to induce airway epithelial injury, while the detailed mechanisms remain unclear. Here we demonstrated that PM exposure inactivated MTOR (mechanistic target of rapamycin kinase), enhanced macroautophagy/autophagy, and impaired lysosomal activity in HBE (human bronchial epithelial) cells and in mouse airway epithelium. Genetic or pharmaceutical inhibition of MTOR significantly enhanced, while inhibition of autophagy attenuated, PM-induced IL6 expression in HBE cells. Consistently, club-cell-specific deletion of Mtor aggravated, whereas loss of Atg5 in bronchial epithelium reduced, PM-induced airway inflammation. Interestingly, the augmented inflammatory responses caused by MTOR deficiency were markedly attenuated by blockage of downstream autophagy both in vitro and in vivo. Mechanistically, the dysregulation of MTOR-autophagy signaling was partially dependent on activation of upstream TSC2, and interacted with the TLR4-MYD88 to orchestrate the downstream NFKB activity and to regulate the production of inflammatory cytokines in airway epithelium. Moreover, inhibition of autophagy reduced the expression of EPS15 and the subsequent endocytosis of PM. Taken together, the present study provides a mechanistic explanation for how airway epithelium localized MTOR-autophagy axis regulates PM-induced airway injury, suggesting that activation of MTOR and/or suppression of autophagy in local airway might be effective therapeutic strategies for PM-related airway disorders.Abbreviations: ACTB: actin beta; AKT: AKT serine/threonine kinase; ALI: air liquid interface; AP2: adaptor related protein complex 2; ATG: autophagy related; BALF: bronchoalveolar lavage fluid; COPD: chronic obstructive pulmonary disease; CXCL: C-X-C motif chemokine ligand; DOX: doxycycline; EGF: epidermal growth factor; EGFR: epidermal growth factor receptor; EPS15: epidermal growth factor receptor pathway substrate 15; HBE: human bronchial epithelial; H&E: hematoxylin & eosin; IKK: IKB kinase; IL: interleukin; LAMP2: lysosomal-associated membrane protein 2; LPS: lipopolysaccharide; MAP1LC3B/LC3B: microtubule-associated protein 1 light chain 3 beta; MTEC: mouse tracheal epithelial cells; MTOR: mechanistic target of rapamycin kinase; MYD88: MYD88 innate immune signal transduction adaptor; NFKB: nuclear factor of kappa B; NFKBIA: NFKB inhibitor alpha; PM: particulate matter; PtdIns3K: phosphatidylinositol 3-kinase; Rapa: rapamycin; RELA: RELA proto-oncogene, NFKB subunit; SCGB1A1: secretoglobin family 1A member 1; siRNA: small interfering RNAs; SQSTM1: sequestosome 1; TEM: transmission electronic microscopy; TLR4: toll like receptor 4; TSC2: TSC complex subunit 2.

Keywords: Airway epithelial injury; MTOR; airway inflammation; autophagy; particulate matter.


Figures

Figure 1.
Figure 1.
PM exposure causes MTOR inactivation and induces autophagy in HBE cells and in mouse airway epithelium. (A and B) Representative immunoblots (A) and semi-quantification (B) of dose-dependent levels of p-MTOR, MTOR, p-RPS6, RPS6, LC3B, LAMP2, and SQSTM1 in HBE cells exposed to PM for 24 h. (C and D) Representative immunoblots (C) and semi-quantification (D) of time-dependent expression of indicated proteins in HBE cells exposed to PM at 100 μg/ml. Blots from 3–5 independent experiments were quantified by ImageJ software. (E to I) MTECs were differentiated in an air-liquid interface culture system. After well differentiation, cells were treated with PM at 100 μg/ml for 24 h. (E and F) Representative images (n = 10–14 images for each group) of p-RPS6 staining (E) and semi-quantification (F) in PM-treated MTECs. Scale bar: 60 μm. (G) Representative images of SCGB1A1 staining in MTECs. (H and I) PM exposure decreased the levels of p-RPS6 in both SCGB1A1-positive (H) and -negative (I) MTECs. (J and K) Representative images (n = 10–14 images for each group) (J) and semi-quantification (K) of p-RPS6 in mouse airway epithelial cells exposed to PM. Lung sections stained for SCGB1A1 or p-RPS6 24 h after last PM exposure. Scale bar: 150 μm. (L and M) TEM images (n = 5–8 images for each group) (L) and semi-quantified level (M) of autophagic vacuoles in isolated mouse bronchus. Scale bar: upper panels, 2 μm; lower panels, 0.4 μm. Error bars, mean ± SEM. Differences between two groups were identified using the Student t-test (F, H, I, K, and M) and multiple groups using one-way ANOVA (B and D). *P < 0.05, **P < 0.01, ***P < 0.001.
Figure 2.
Figure 2.
MTOR impairment enhances PM-induced IL6 expression in HBE cells. HBE cells were transfected with MTOR-siRNA (A and D) for 24 h, and then stimulated with PM (100 μg/ml) for an addition 24 h, or treated with Rapa (5 nM) (B and E) or Torin1 (250 nM) (C and F) together with PM (100 μg/ml) for 24 h. The relative mRNA levels of IL6 (A to C) were measured by quantitative real-time PCR, and the secretion of IL6 (D to F) in cell culture supernatants was determined by ELISA. (G to K) MTECs were differentiated in an air-liquid interface culture system. After well differentiation, cells were treated with Torin1 (250 nM) together with PM (100 μg/ml) for 24 h. The relative mRNA levels of Il6 (G), Cxcl1 (H), and Cxcl2 (I) were measured by quantitative real-time PCR, while the protein levels of CXCL1 (J) and CXCL2 (K) were detected by ELISA. Data are representative of 3–5 independent experiments. Error bars, mean ± SEM. Differences were identified using one-way ANOVA. **P < 0.01, ***P < 0.001.
Figure 3.
Figure 3.
Selective disruption of MTOR in airway epithelial cells exacerbates PM-induced airway inflammation. mtor∆/∆ mice (defined as mice with specific knockdown of MTOR in club cells) and WT (control) littermates (n = 4 to 13 for each group) were exposed to PM at 100 μg/d for 4 days. 24 h after last PM exposure, the total inflammatory cells (A) and the number of neutrophils (B) in the BALF were assessed. The relative mRNA levels of Il6 (C) Cxcl1 (E), and Cxcl2 (G) in lung tissue were measured by quantitative PCR. Protein levels of IL6 (D), CXCL1 (F), and CXCL2 (H) in the BALF were detected by ELISA. (I and J) Representative images (I) and semi-quantification (J) of lung sections stained with H&E (n = 19–22 images for each group). Scale bar: 200 μm. Data are presented as mean ± SEM. Differences were identified using one-way ANOVA. *P < 0.05, **P < 0.01, ***P < 0.001.
Figure 4.
Figure 4.
The role of MTOR in PM-induced IL6 production is dependent on the downstream signaling autophagy in HBE cells. (A) Cells were treated with Rapa, together with PM (100 μg/ml) for 10 h, then harvested for western blot analysis of LC3B. (B) Quantification of the immunoblots presented in Figure 4A, and blots from 3 independent experiments were quantified by ImageJ software. Cells were infected with indicated Control- or ATG5-siRNA (C and D) for 24 h, and then stimulated with PM (100 μg/ml) for an addition 24 h, or treated with or without spautin1 (E and F) together with PM (100 μg/ml) for 24 h. The relative mRNA level of IL6 (C and E) were measured by quantitative real-time PCR, and IL6 (D and F) in cell culture supernatants was detected by ELISA. (G and H) Cells were transfected with indicated Control- or MTOR-siRNA for 24 h, and then exposed to PM (100 μg/ml), co-treated with or without spautin1 for an addition 24 h to measure the mRNA levels (G) and protein levels (H) of IL6. Data are representative of 3–7 independent experiments. Error bars, mean ± SEM. Differences were identified using one-way ANOVA. *P < 0.05, **P < 0.01, ***P < 0.001.
Figure 5.
Figure 5.
Club-cell-specific knockdown of ATG5 attenuates PM-induced airway inflammation. (A) Genotyping of atg5∆/∆ mice by PCR using genomic DNA from mouse tails. (B) Representative immunofluorescence images of mouse lung sections stained with SCGB1A1 (Green), ATG5 (red), and nuclei (DAPI, blue). Scale bar: 150 μm. (C and D) Representative immunoblots (C) and semi-quantification (D) of ATG5 in mouse lung tissues. (E–I) atg5∆/∆ mice (defined as mice with specific knockdown of ATG5 in club cells) and WT (control) littermates (n = 5 to 8 for each group) were exposed to PM at 100 μg/d for 4 days. 24 h after last PM exposure, the total inflammatory cells (E) and the number of neutrophils (F) in the BALF were assessed. The relative mRNA levels of Il6 (G) in lung tissue were measured by quantitative PCR. (H and I) Representative images (H) and semi-quantification (I) of lung sections stained with H&E (n = 20–30 images for each group). Scale bar: 200 μm. Data are presented as mean ± SEM of 3 independent experiments. Differences between two groups were identified using the Student t-test (D) and multiple groups using one-way ANOVA (E, F, G, and I). *P < 0.05, **P < 0.01, ***P < 0.001.
Figure 6.
Figure 6.
LC3B deletion ameliorates the exacerbated PM-induced inflammation caused by MTOR deficiency. Mice (n = 7 to 19 for each group) were exposed to PM at 100 μg/d for 4 days. 24 h after last PM exposure, the total inflammatory cells (A) and the number of neutrophils (B) in the BALF were assessed. The relative mRNA levels of Il6 (C) Cxcl1 (E), and Cxcl2 (G) in lung tissue were measured by quantitative PCR. Protein levels of IL6 (D), CXCL1 (F), and CXCL2 (H) in the BALF were detected by ELISA. (I and J) Representative images (I) and semi-quantification (J) of lung sections stained with H&E (n = 12–22 images for each group). Scale bar: 200 μm. Data are presented as mean ± SEM of 3 independent experiments. Differences were identified using one-way ANOVA. *P < 0.05, **P < 0.01, ***P < 0.001.
Figure 7.
Figure 7.
Upstream TSC2 mediates PM-induced dysregulation of MTOR-autophagy in airway epithelial cells. (A) Dose-dependent levels of p-TSC2 and TSC2 in HBE cells exposed to PM for 24 h. (B) HBE cells, exposed to PM at 100 μg/ml, were harvested 0, 1, 4, and 24 h after exposure and analyzed for protein levels of p-TSC2 and TSC2 by western blot analysis. (C and D) Quantification of the immunoblots presented in Figure 6A (C) and 6B (D), and blots from 3–4 independent experiments were quantified by ImageJ software. (E) Representative images of lung sections stained for p-TSC2. Scale bar: 50 μm. (F) Cells were transfected with indicated Control- or TSC2-siRNA for 24 h, and then stimulated with PM (100 μg/ml) for an addition 24 h to analyze the levels of MTOR and p-MTOR by western blot. (G) Quantification of the immunoblots presented in Figure 6F. (H and I) Cells were infected with indicated TSC2-siRNA-1 or TSC2-siRNA-2 for 24 h, and then stimulated with PM (100 μg/ml) for an addition 24 h to measure the IL6 mRNA levels by Q-PCR (H). Cell culture supernatants were examined for IL6 by ELISA (I). (J and K) Cells were transfected with indicated Control- or TSC2-siRNA for 24 h, and then exposed to PM (100 μg/ml), co-treated with or without Rapa for an addition 24 h to measure the mRNA levels (J) and protein levels (K) of IL6. Data are representative of 3–7 independent experiments. Error bars, mean ± SEM. Differences were identified using one-way ANOVA. *P < 0.05, **P < 0.01, ***P < 0.001.
Figure 8.
Figure 8.
MTOR suppresses PM-induced inflammation via the NFKB pathway in airway epithelium. (A to F) Cells were treated with Rapa (A), spautin1 (C), or ATG5-siRNA (E) together with PM (100 μg/ml) for 24 h, then harvested for western blot analysis of p-RELA, RELA, and NFKBIA. Quantification of the immunoblots presented in Figure 8A (B), 8C (D) or 8E (F). (G) mtor∆/∆ mice and WT littermates were exposed to PM at 100 μg/d for 4 days, 24 h after last PM exposure, the protein levels of p-RELA and RELA in lung tissue were examined by western blot. (H) Quantification of the immunoblots presented in Figure 8G. (I and J) Flow cytometric analysis of NFKBIA in HBE cells treated with PM for 24 h. (K and L) Representative images (n = 8–11 images for each group) and semi-quantification of NFKBIA in HBE cells exposed to PM for 24 h. Scale bar: 100 μm. (M) Co-localization of NFKBIA (red) and autophagic vesicles (GFP-LC3 punctations) in PM-treated HBE cells. HBE cells were transfected with GFP-LC3 for 24 h, and were treated with PM at 100 μg/d for 4 h. Scale bar: 25 μm. (N and P) Cells were treated with spautin1 (N) or ATG5-siRNA (P), together with PM (100 μg/ml) for 24 h, then harvested for western blot analysis of p-CHUK/p-IKBKB (p-IKK) and p-NFKBIA. (O and Q) Quantification of the immunoblots presented in Figure 8N (O) and 8P (Q). Data are representative of 3–6 independent experiments. Error bars, mean ± SEM. Differences were identified using one-way ANOVA. *P < 0.05, **P < 0.01, ***P < 0.001.
Figure 9.
Figure 9.
Autophagy modulates basal expression of EPS15 and regulates PM endocytosis in HBE cells. (A and B) PM treatment exerted no effects on EPS15 expression, as determined by mRNA (A) or protein (B) expression. (C and D) Effects of EPS15-siRNA on PM endocytosis. Cells were transfected with indicated Control- or EPS15-siRNA for 24 h, and then treated with PM (100 μg/ml) for an addition 24 h. Total PM in cells were observed by electron microscopy. Representative images (C) and the semi-quantification results (D) were shown. Scale bar: 2 μm. (E to H) Effects of EPS15-siRNA on PM-induced expression of p-MTOR, MTOR, LC3B, and LAMP2, and production of IL6 in HBE cells. The protein expression (E and F) was determined by western blotting analysis, the relative mRNA level of IL6 (G) were measured by Q-PCR, and IL6 (H) in cell culture supernatants was detected by ELISA. (I and J) Effects of AP2-siRNA on PM-induced expression of IL6 in HBE cells. (K to O) Effects of autophagy in regulation of the expression of EPS15 and PM endocytosis. (K to M) Cells were transfected with siRNA for 24 h, and were harvested for analysis of mRNA (K), and protein levels (L) with semi-quantification (M). (N and O) After siRNA transfection, cells were treated with PM (100 μg/ml) for an addition 24 h. Representative images of the incidence of black particles in cells (N) and the semi-quantification results (O) were shown. Scale bar: 2 μm. Data are representative of 3–6 independent experiments. Error bars, mean ± SEM. Differences were identified using one-way ANOVA. *P < 0.05, **P < 0.01, ***P < 0.001.
Figure 10.
Figure 10.
Summarization of the role of MTOR-autophagy axis in PM-induced airway inflammation. PM exposure inactivates MTOR and induces autophagy through activation of upstream TSC2 in airway epithelium. The dysregulated MTOR-autophagy axis cross-regulates with TLR4-MYD88 signaling to orchestrate PM-induced NFKB activation and subsequent airway inflammation likely through NFKBIA direct degradation by autophagy or its phosphorylation. Autophagy also modulates PM endocytosis, and both endocytosis and TLR4 pathways contribute to the impairment of lysosomal functions.

References

    1. Guan WJ, Zheng XY, Chung KF, et al. Impact of air pollution on the burden of chronic respiratory diseases in China: time for urgent action. Lancet. 2016;388(10054):1939–1951. - PubMed
    1. Gordon SB, Bruce NG, Grigg J, et al. Respiratory risks from household air pollution in low and middle income countries. Lancet Respir Med. 2014;2(10):823–860. - PMC - PubMed
    1. Santibanez-Andrade M, Quezada-Maldonado EM, Osornio-Vargas A, et al. Air pollution and genomic instability: the role of particulate matter in lung carcinogenesis. Environ Pollut. 2017;229:412–422. - PubMed
    1. Oberdörster G, Oberdörster E, Oberdörster J.. Nanotoxicology: an emerging discipline evolving from studies of ultrafine particles. Environ Health Perspect. 2005;113(7):823–839. - PMC - PubMed
    1. Saxton RA, Sabatini DM.. MTOR signaling in growth, metabolism, and disease. Cell. 2017;168(6):960–976. - PMC - PubMed

Publication types

MeSH terms