. 2019 Aug 7;103(3):489-505.e7.
doi: 10.1016/j.neuron.2019.05.029. Epub 2019 Jun 13.

A Discrete Dorsal Raphe to Basal Amygdala 5-HT Circuit Calibrates Aversive Memory

Affiliations

A Discrete Dorsal Raphe to Basal Amygdala 5-HT Circuit Calibrates Aversive Memory

Ayesha Sengupta et al. Neuron. .

Abstract

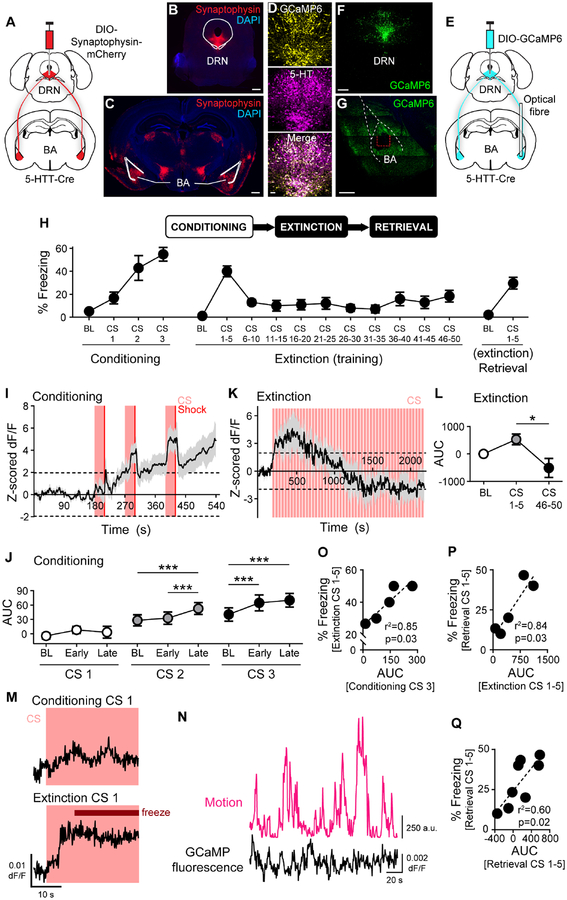
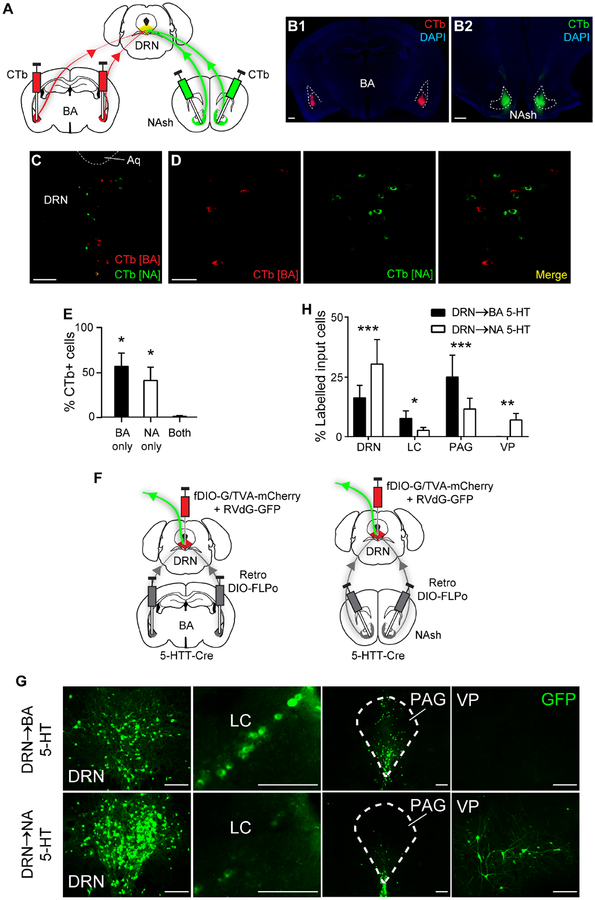
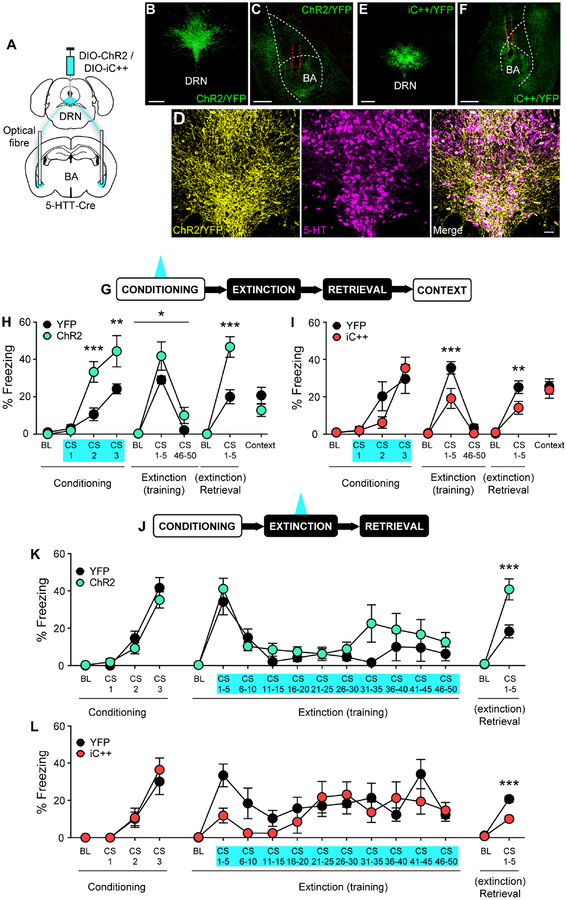
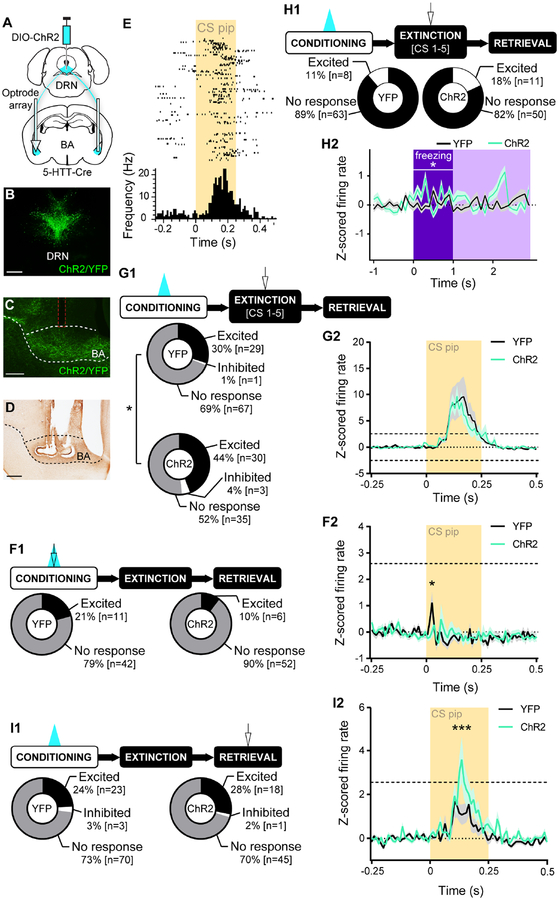
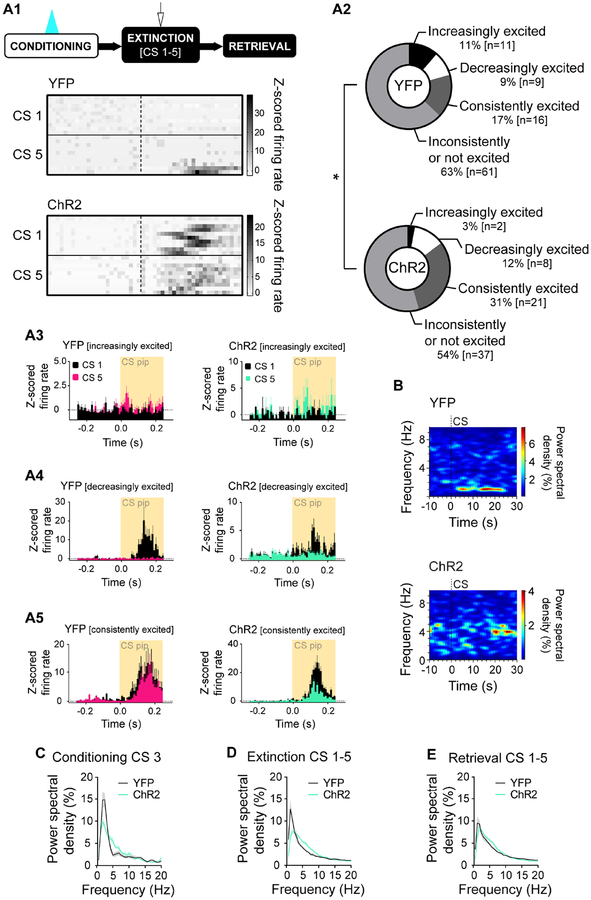
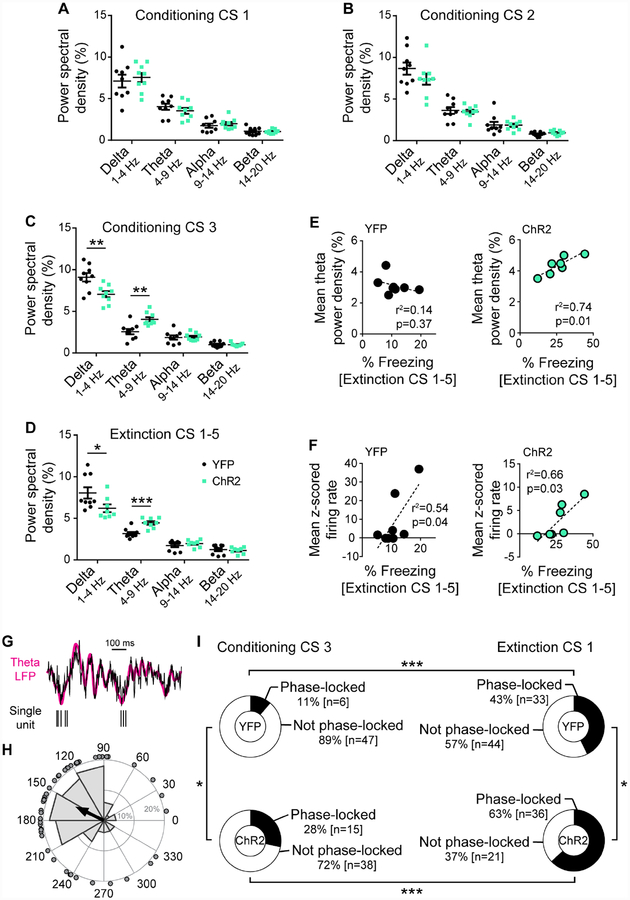
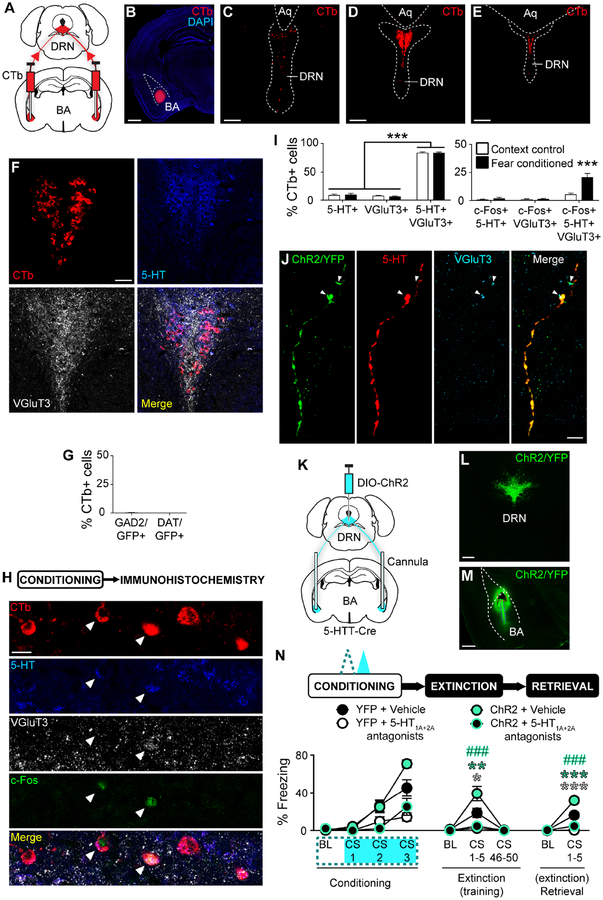
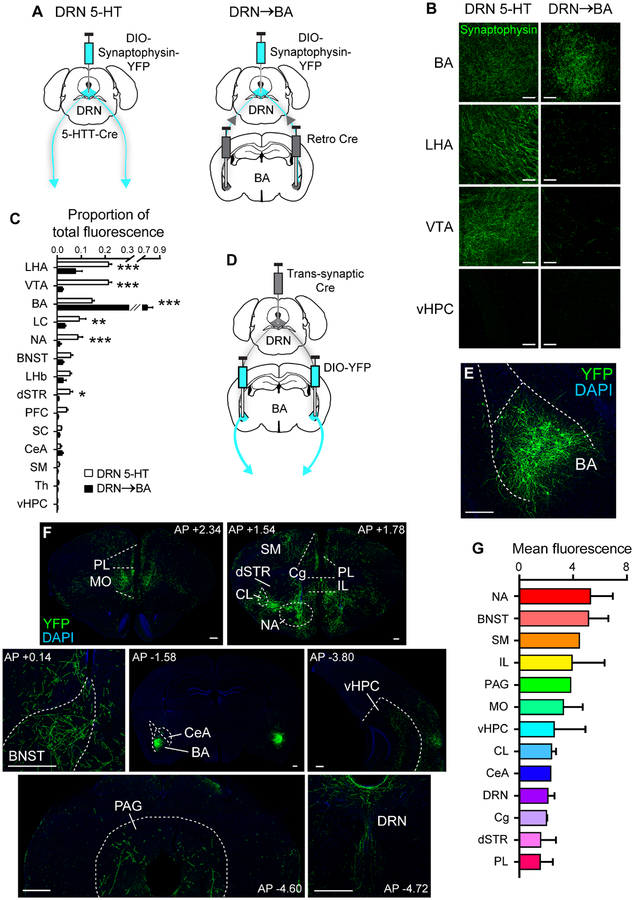
Despite a wealth of clinical and preclinical data implicating the serotonin (5-HT) system in fear-related affective disorders, a precise definition of this neuromodulator's role in fear remains elusive. Using convergent anatomical and functional approaches, we interrogate the contribution to fear of basal amygdala (BA) 5-HT inputs from the dorsal raphe nucleus (DRN). We show the DRN→BA 5-HT pathway is engaged during fear memory formation and retrieval, and activity of these projections facilitates fear and impairs extinction. The DRN→BA 5-HT pathway amplifies fear-associated BA neuronal firing and theta power and phase-locking. Although fear recruits 5-HT and VGluT3 co-expressing DRN neurons, the fear-potentiating influence of the DRN→BA 5-HT pathway requires signaling at BA 5-HT1A/2A receptors. Input-output mapping illustrates how the DRN→BA 5-HT pathway is anatomically distinct and connected with other brain regions that mediate fear. These findings reveal how a discrete 5-HT circuit orchestrates a broader neural network to calibrate aversive memory.

Keywords: 5-HT; basal amygdala; dorsal raphe nucleus; fear conditioning; fear extinction; nucleus accumbens; serotonin.


Conflict of interest statement

Declaration of Interests

The authors declare no competing interests.

Figures

Figure 1.
Figure 1.. DRN→BA 5-HT pathway activity tracks fear acquisition, expression, and extinction
(A-C) Cre-dependent fluorescent synaptophysin injection into DRN of 5-HTT-Cre mice (A). Fluorescent synaptophysin expression in DRN (B). Scale bar=500 μm. Fluorescent synaptophysin expression in DRN 5-HT projections in BA (C). Scale bar=500 μm. (D-G) Overlap of GCaMP6(m) expression and 5-HT immunoreactivity in DRN (D). Scale bar=50 μm. Cre-dependent GCaMP6 injection into DRN and unilateral optical fibre implantation into BA of 5-HTT-Cre mice (E). GCaMP6 expression in DRN (F). Scale bar=500 μm. GCaMP6 expression in DRN 5-HT projections in BA (G). Dashed red lines=optical fibre tract. Scale bar=500 μm. (H) Top: Behavioural task. Bottom: Freezing in DRN GCaMP6-injected and BA optical fibre-implanted 5-HTT-Cre mice (n=8 mice). (I and K) DRN→BA 5-HT pathway activity increased during FC (n=7 mice) (I) and temporarily rose during FE (n=5 mice) (K). Traces show mean±SEM of z-scored dF/F GCaMP fluorescence. Dashed lines at ±1.96 demarcate statistically significant change from baseline (2-tailed, α=0.05). (J and L) DRN→BA 5-HT activity increased during FC CSs (n=7 mice) (J) and decreased during FE (n=5 mice) (L). Data are mean±SEM of AUC of activity traces from (I) and (K). (M) Representative traces showing a rise in DRN→BA 5-HT activity preceding a freezing event early in FE, but not during the lack of freezing early in FC. Traces show dF/F GCaMP fluorescence. (N) Representative traces showing changes in motion (magenta) and dF/F GCaMP fluorescence (black) during pre-FC baseline. (O-Q) DRN→BA 5-HT pathway activity during FC correlated with freezing behaviour during FE (n=5 mice) (O). DRN→BA 5-HT pathway activity during FE correlated with freezing behaviour during ER (n=5 mice) (P). DRN→BA 5-HT pathway activity correlated with freezing behaviour during ER (n=8 mice) (Q). AUC—area under the curve, BL—baseline. *p<0.05, ***p<0.001. See also Figures S1, S2.
Figure 2.
Figure 2.. DRN→BA and DRN→NA 5-HT pathways are anatomically distinct
(A–C) Bilateral CTb injections into BA and NA (A). CTb in BA (B1) and NA (B2). Scale bars=500 μm. Dual CTb-labelled cells in DRN (C). Scale bar=250 μm. (D) Overlay of dual CTb-labelled cells in DRN. Scale bar=40 μm. (E) Most BA- and NA-projecting DRN neurons were distinct (BA and NA n=5 mice). Data are mean±SEM. *p<0.05 compared to theoretical zero. (F) Bilateral retro Cre-dependent FLPo injection into BA (left) or NA (right) and FLPo-dependent rabies GFP injection into DRN of 5-HTT-Cre mice. (G) GFP+ neurons that input onto DRN 5-HT projections to BA and NA. Scale bars=200 μm. (H) Differing percentages of input cells to BA- and NA-projecting DRN 5-HT neurons (BA n=5 mice, NA n=5 mice). See also Table S1 for complete distribution of identified input cells. Data are mean±SEM. Aq—aqueduct, LC—locus coeruleus, NAsh—nucleus accumbens shell, PAG—periaqueductal grey, VP—ventral pallidum. *p<0.05, **p<0.01, ***p<0.001. See also Figure S3, Table S1.
Figure 3.
Figure 3.. DRN→BA 5-HT pathway bidirectionally regulates fear and extinction learning.
(A-F) Cre-dependent opsin injection into DRN and bilateral optical fibre implantation into BA of 5-HTT-Cre mice (A). ChR2 expression in DRN (B) and in DRN 5-HT projections in BA (C). Scale bars=500 μm. Overlap of ChR2 expression and 5-HT immunoreactivity in DRN (D). Scale bar=50 μm. iC++ expression in DRN (E) and DRN 5-HT projections in BA. (F). Scale bars=500 μm. Dashed red lines=optical fibre tract. (G-I) Behavioural task. 20 Hz (ChR2) or continuous (iC++) laser stimulation was delivered during FC CSs (G). ChR2 mice froze more than YFP controls during FC, FE, and ER (YFP n=11 mice, ChR2 n=9 mice) (H). iC++ mice froze less than YFP controls during FE and ER (YFP n=9 mice, iC++ n=8 mice) (I). Data are mean±SEM. (J-L) Behavioural task. 20 Hz (ChR2) or continuous (iC++) laser stimulation was delivered during FE CSs (J). ChR2 mice froze more than YFP controls during ER (YFP n=8 mice, ChR2 n=9 mice) (K). iC++ mice froze less than YFP controls during ER (YFP n=10 mice, iC++ n=11 mice) (L). Data are mean±SEM. BL—baseline. *p<0.05, **p<0.01, ***p<0.001. See also Figures S3, S4, S5.
Figure 4.
Figure 4.. DRN→BA 5-HT pathway sculpts BA neuronal fear encoding
(A-D) Cre-dependent ChR2 injection into DRN and unilateral optrode array implantation into BA of 5-HTT-Cre mice (A). ChR2 expression in DRN (B). ChR2 expression in DRN 5-HT projections in BA (sagittal); dashed red lines=optical fibre tract (C). Bright field image of optrode array placement in BA (sagittal) (D). Scale bars=500 μm. (E) Raster plot of a BA single unit firing during CS pips in early FE. (F1) Top: Behavioural task. 20 Hz laser stimulation was delivered during FC CSs. In vivo electrophysiology data from FC. Bottom: No difference in proportion of BA single unit responses to CS pips (YFP n=53 units, 9 mice; ChR2 n=58 units, 9 mice). (F2) Firing rates of BA single units were lower in ChR2 vs. YFP mice during CS pips (YFP n=53 units, 9 mice; ChR2 n=58 units, 9 mice). Traces show mean±SEM of z-scored firing rate. Dashed lines at +2.58 demarcate statistically significant change from baseline (2-tailed, α=0.01). (G1) Top: Behavioural task. 20 Hz laser stimulation was delivered during FC CSs. In vivo electrophysiology data from early FE (CS1–5). Bottom: A greater proportion of BA single units was excited during CS pips in ChR2 vs. YFP mice (YFP n=97 units, 9 mice; ChR2 n=68 units, 8 mice). (G2) Firing rates of BA single units in ChR2 and YFP mice increased during CS pips (YFP n=97 units, 9 mice; ChR2 n=68 units, 8 mice). Traces show mean±SEM of z-scored firing rate. Dashed lines at ±2.58 demarcate statistically significant change from baseline (2-tailed, α=0.01). (H1) Top: Behavioural task. 20 Hz laser stimulation was delivered during FC CSs. In vivo electrophysiology data is from early FE (CS1–5). Bottom: No difference in proportion of BA single unit firing during freezing onset (YFP n=71 units, 9 mice; ChR2 n=61 units, 8 mice). (H2) Firing rates of BA single units were higher overall in ChR2 vs. YFP mice during freezing onset (YFP n=71 units, 9 mice; ChR2 n=61 units, 8 mice). Traces show mean±SEM of z-scored firing rate. ±1.96 represents statistically significant change from baseline (2-tailed, α=0.05). (I1) Top: Behavioural task. 20 Hz laser stimulation was delivered during FC CSs. In vivo electrophysiology data from ER. Bottom: No difference in proportion of BA single unit responses to CS pips (YFP n=96 units, 9 mice; ChR2 n=64 units, 9 mice). (I2) Firing rates of BA single units were higher in ChR2 vs. YFP mice during CS pips (YFP n=96 units, 9 mice; ChR2 n=64 units, 9 mice). Traces show mean±SEM of z-scored firing rate. Dashed lines at +2.58 demarcate statistically significant change from baseline (2-tailed, α=0.01). *p<0.05, ***p<0.001. See also Figures S3 and S6.
Figure 5.
Figure 5.. DRN→BA 5-HT pathway alters BA neuronal fear encoding dynamics
(A1) Top: Behavioural task. 20 Hz laser stimulation was delivered during FC CSs. In vivo electrophysiology data from early FE (CS1–5). Bottom: Colour plot showing increasingly excited BA single units in YFP vs. consistently excited BA single units in ChR2 mice during CS pips over the course of CSs. Rows are individual single units. (A2) A smaller proportion of BA single units became increasingly excited and a larger proportion remained consistently excited in ChR2 vs. YFP mice over the course of CSs (YFP n=97 units, 9 mice; ChR2 n=68 units, 8 mice). (A3) Increasingly excited BA single units whose firing did not change during CS1 but increased by CS5. ±1.96 represents statistically significant change from baseline (2-tailed, α=0.05). Histograms show mean±SEM of z-scored firing rate. (A4) Decreasingly excited BA single units whose firing increased during CS1 but no longer changed by CS5. ±1.96 represents statistically significant change from baseline (2-tailed, α=0.05). Histograms show mean±SEM of z-scored firing rate. (A5) Consistently excited BA single units whose firing increased during CS1 and still increased by CS5. ±1.96 represents statistically significant change from baseline (2-tailed, α=0.05). Histograms show mean±SEM of z-scored firing rate. (B) BA LFPs during FE CSs. (C-E) Power spectral densities of BA LFPs during CSs (FC, YFP n=9 mice, ChR2 n=9 mice; FE, YFP n=9 mice, ChR2 n=8 mice; ER, YFP n=9 mice, ChR2 n=9 mice). Data are mean±SEM. *p<0.05. See also Figures S3, S6, S7.
Figure 6.
Figure 6.. DRN→BA 5-HT pathway accentuates fear-related BA theta power
(A-D) Power spectral densities of BA LFPs in delta, theta, alpha, and beta oscillation ranges at FC CS1–3 (A-C) (YFP n=9 mice, ChR2 n=9 mice) and FE CS1–5 (D) (YFP n=9 mice, ChR2 n=8 mice). Data are mean±SEM. (E-F) Theta power of BA LFPs (E) and z-scored firing rates of BA single units (F) correlated against freezing behaviour during FE in ChR2 and YFP mice (YFP theta n=9 mice, ChR2 theta n=8 mice, YFP units n=9 mice, ChR2 units n=8 mice). (G) Representative raw (black) and theta filtered (magenta) BA LFP trace (top), and simultaneously recorded BA single unit action potentials (bottom) during a CS. (H) Distribution (grey bars) and mean (black arrow) of theta phases of a BA single unit’s action potentials during a CS. Dots depict individual action potentials. (I) A greater proportion of BA single units were phase-locked to theta during FE vs. FC CSs, and in ChR2 vs. YFP mice (FC YFP n=53 units, 9 mice; FC ChR2 n=53 units, 9 mice; FE YFP n=77 units, 9 mice; FE ChR2 n=57 units, 8 mice). *p<0.05, **p<0.01, ***p<0.001. See also Figures S3, S6, S7.
Figure 7.
Figure 7.. DRN→BA 5-HT neurons co-express VGluT3 but regulate fear via BA 5-HT-R.
(A-E) Bilateral CTb injections into BA (A). CTb in BA (B). Scale bar=1 mm. CTb-labelled cells in rostral (C), middle (D), and caudal (E) DRN. Scale bars=150 μm. (F) Overlay of CTb+, 5-HT+, and VGluT3+ cells in DRN. Scale bar=50 μm. (G) Almost no CTb+ DRN neurons expressed GAD2 or DAT (GAD2 n=6 mice, DAT n=5 mice). Data are mean±SEM. (H) Overlay (single optical section, 1 μm thickness) of CTb+, 5-HT+, VGluT3+, and c-Fos+ cells in DRN post-FC. Scale bar=20 μm. (I) Left: Majority of CTb+ DRN neurons contained 5-HT and VGluT3. Right: 5-HT and VGluT3 co-expressing CTb+ DRN neurons were preferentially activated during FC (context control n=6 mice, fear conditioned n=6 mice). Data are mean±SEM. (J) Overlap of ChR2 expression and immunoreactivity for 5-HT and VGluT3 in axons in BA. VGluT3 (white arrows) and 5-HT appear at slightly different parts of ChR2+ axons. Scale bar=10 μm. (K-M) Cre-dependent ChR2 injection into DRN and bilateral opto-fluid cannula or optical fibre implantation into BA of 5-HTT-Cre mice (K). ChR2 expression in DRN (L) and DRN 5-HT projections in BA (M). Dashed red lines=cannula tract, dashed purple lines=infusion needle tract. Scale bars=500 μm. (N) Top: Behavioural task. A cocktail of 5-HT1A (WAY100635, 0.37 nmol) and 5-HT2A (MDL100907, 0.54 nmol) antagonists was infused into BA prior to FC. 20 Hz laser stimulation was delivered during FC CSs. Bottom: 5-HT-R antagonism prevented increased freezing in ChR2 vs. YFP mice during FE and ER (YFP+VEH n=7 mice; YFP+drug n=7 mice, ChR2+VEH n=8 mice, ChR2+drug n=8 mice). Data are mean±SEM. *p<0.05, **p<0.01, ***p<0.001 compared to YFP+VEH mice; ###p<0.001 compared to. ChR2+VEH mice. See also Figure S7.
Figure 8.
Figure 8.. DRN→BA 5-HT pathway is positioned within a broader fear-mediating network
(A) Left: Cre-dependent fluorescent synaptophysin injection into DRN of 5-HTT-Cre mice. Right: Bilateral retro Cre injection into BA and Cre-dependent fluorescent synaptophysin injection into DRN. (B) Fluorescent synaptophysin-expressing DRN projections (maximum intensity projections; z-stack: 10 μm, 1 μm optical sections). Scale bars=50 μm. (C) Proportion of total fluorescence from fluorescent synaptophysin-expressing DRN projections (DRN 5-HT n=3 mice, DRN→BA n=3 mice). Data are mean±SEM. (D-E) Trans-synaptic Cre injection into DRN and bilateral Cre-dependent YFP injection into BA (D). YFP expression in BA neurons (E). Scale bar=250 μm. (F) YFP+ BA projections. Scale bars=250 μm. (G) Fluorescence from YFP+ BA projections (n=4 mice). Data are mean±SEM. BNST—bed nucleus of the stria terminalis, CeA—central amygdala, Cg—cingulate cortex, CL—claustrum, dSTR—dorsal striatum, IL—infralimbic cortex, LC—locus coeruleus, LHA—lateral hypothalamus, LHb—lateral habenula, MO—medial orbitofrontal cortex, PAG—periaqueductal grey, PFC—prefrontal cortex, PL—prelimbic cortex, SC—superior colliculus, SM—sensory/motor cortices, Th—thalamus, vHPC—ventral hippocampus, VTA—ventral tegmental area. *p<0.05, **p<0.01, ***p<0.001. See also Figure S8.

Comment in

Similar articles

Cited by

References

    1. Akirav I, Raizel H, and Maroun M (2006). Enhancement of conditioned fear extinction by infusion of the GABA A agonist muscimol into the rat prefrontal cortex and amygdala. Eur. J. Neurosci 23, 758–764. - PubMed
    1. Allers KA, and Sharp T (2003). Neurochemical and anatomical identification of fast- and slow-firing neurones in the rat dorsal raphe nucleus using juxtacellular labelling methods in vivo. Neuroscience 122, 193–204. - PubMed
    1. Amilhon B, Lepicard E, Renoir T, Mongeau R, Popa D, Poirel O, Miot S, Gras C, Gardier AM, Gallego J, et al. (2010). VGLUT3 (Vesicular Glutamate Transporter Type 3) Contribution to the Regulation of Serotonergic Transmission and Anxiety. J. Neurosci 30, 2198–2210. - PMC - PubMed
    1. Anglada-Figueroa D, and Quirk G (2005). Lesions of the Basal Amygdala Block Expression of Conditioned Fear But Not Extinction. J. Neurosci 25, 9680–9685. - PMC - PubMed
    1. Ansorge MS, Zhou M, Lira A, Hen R, and Gingrich JA (2004). Early-life blockade of the 5-HT transporter alters emotional behavior in adult mice. Science (80-. ) 306, 879–881. - PubMed

Publication types

MeSH terms