. 2019 Jun 27;178(1):216-228.e21.
doi: 10.1016/j.cell.2019.05.025. Epub 2019 Jun 13.

Human Antibodies that Slow Erythrocyte Invasion Potentiate Malaria-Neutralizing Antibodies

Affiliations

Human Antibodies that Slow Erythrocyte Invasion Potentiate Malaria-Neutralizing Antibodies

Daniel G W Alanine et al. Cell. .

Abstract

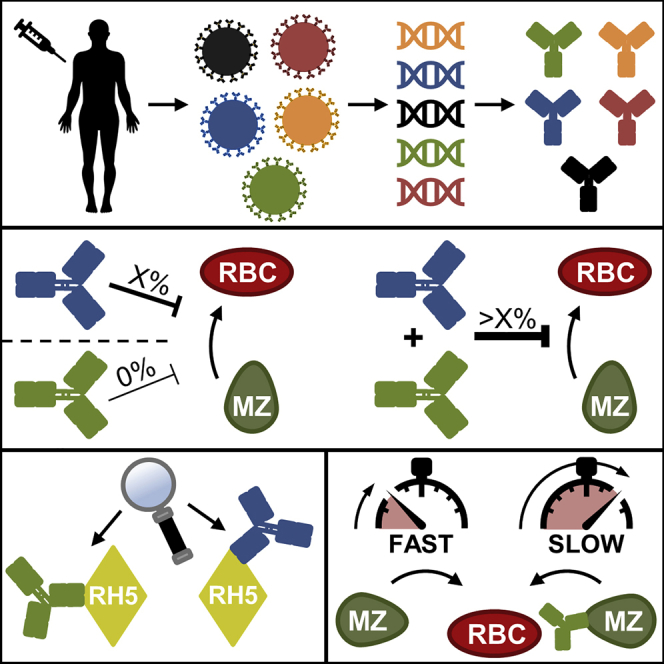
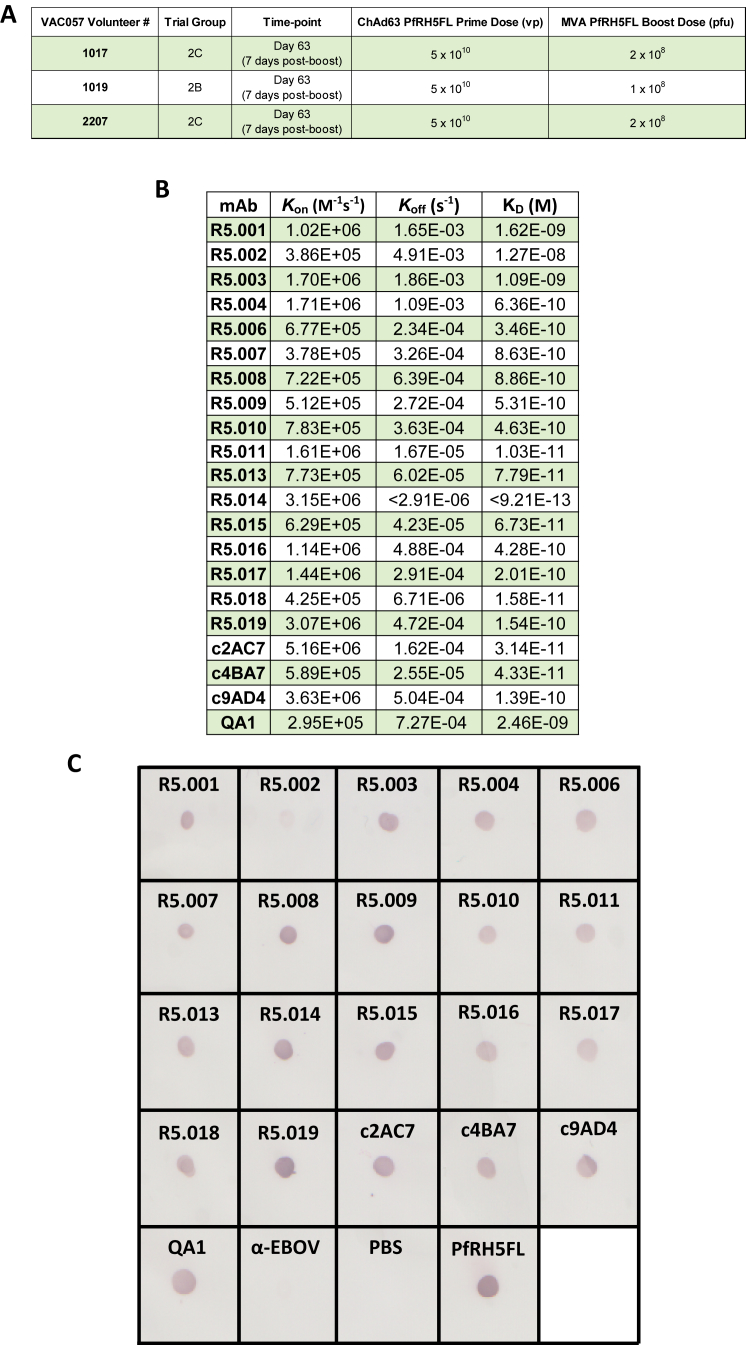
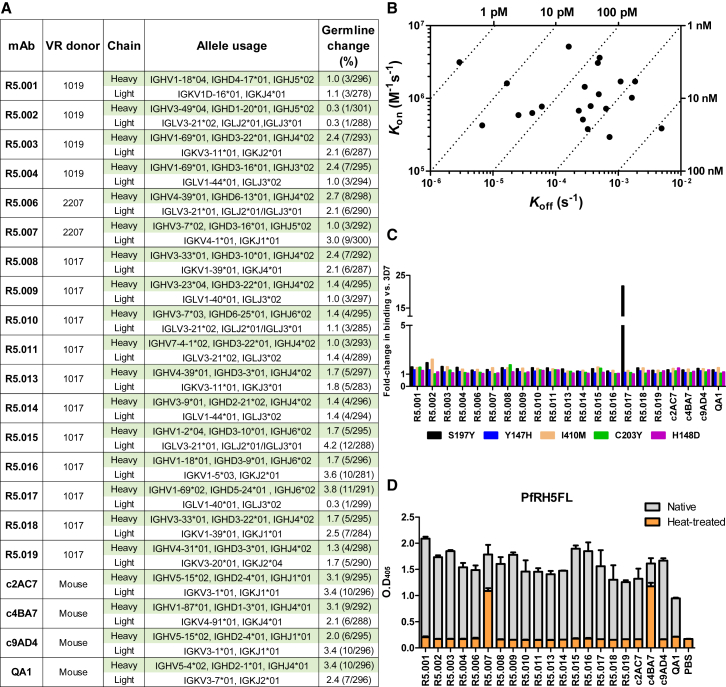
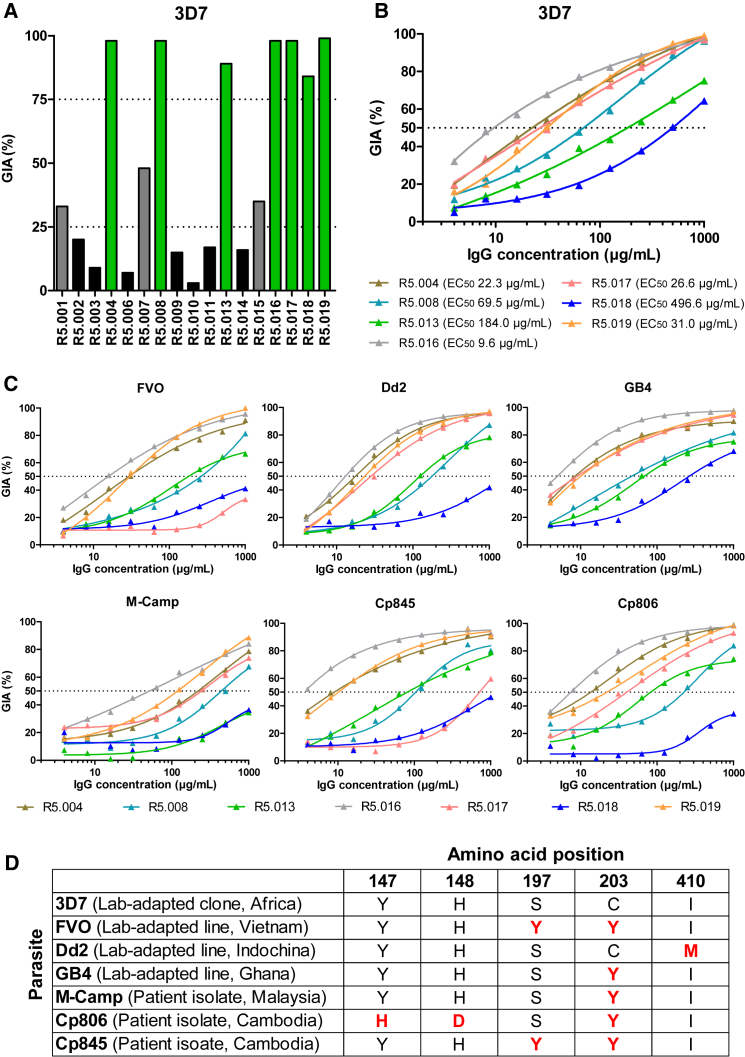
The Plasmodium falciparum reticulocyte-binding protein homolog 5 (PfRH5) is the leading target for next-generation vaccines against the disease-causing blood-stage of malaria. However, little is known about how human antibodies confer functional immunity against this antigen. We isolated a panel of human monoclonal antibodies (mAbs) against PfRH5 from peripheral blood B cells from vaccinees in the first clinical trial of a PfRH5-based vaccine. We identified a subset of mAbs with neutralizing activity that bind to three distinct sites and another subset of mAbs that are non-functional, or even antagonistic to neutralizing antibodies. We also identify the epitope of a novel group of non-neutralizing antibodies that significantly reduce the speed of red blood cell invasion by the merozoite, thereby potentiating the effect of all neutralizing PfRH5 antibodies as well as synergizing with antibodies targeting other malaria invasion proteins. Our results provide a roadmap for structure-guided vaccine development to maximize antibody efficacy against blood-stage malaria.

Keywords: RH5; X-ray crystallography; blood-stage; live-cell microscopy; malaria; merozoite; monoclonal antibody; neutralization; structural vaccinology; synergy.


Figures

None
Graphical abstract
Figure S1
Figure S1
Clinical Trial (VAC057) Volunteer Information and Additional PfRH5 mAb Binding Data, Related to Figure 1 (A) Vaccination details of the three volunteers from which anti-PfRH5FL mAbs were isolated. (B) List of anti-PfRH5 mAb binding properties. Association-rate (Kon), dissociation-rate (Koff) and affinity (KD) are shown. (C) Dot blot showing anti-PfRH5 mAbs binding to parasite-derived PfRH5. PBS, PfRH5FL and a recombinant anti-Ebolavirus IgG1 mAb (α-EBOV) were used as controls.
Figure 1
Figure 1
Description and Binding Characteristics of Anti-PfRH5 mAbs (A) Genetic lineage of variable regions from PfRH5-specific mAbs and their donor origin, showing percentage of nucleotide substitutions relative to germline. (B) Iso-affinity plot showing kinetic rate constants for binding of mAbs to PfRH5FL as determined by SPR. Diagonal dotted lines represent equal affinity at equilibrium. (C) Real-time analysis by BLI of mAb binding to PfRH5FL variants with the five most common naturally occurring amino acid substitutions. Bars represent fold-change compared to wild type PfRH5FL (3D7 sequence) binding. (D) Assessment of binding of PfRH5-specific mAbs to heat-treated PfRH5FL protein by ELISA. Bars show the mean and error bars show the SEM (n = 2). See also Figure S1.
Figure 2
Figure 2
Growth Inhibitory Properties of Human PfRH5-Specific mAbs (A) In vitro GIA of each mAb tested at 3 mg/mL against 3D7 clone P. falciparum. Bars are color-coded to reflect potency (“GIA-high” [≥75%] in green, “GIA-low” [75% > GIA > 25%] in gray and “GIA-negative” [≤25%] in black). (B) In vitro GIA dilution series against the 3D7 reference clone. EC50 values were determined by interpolation after fitting data to a four-parameter dose-response curve. (C) In vitro GIA dilution series of GIA-high mAbs against heterologous parasite laboratory lines and isolates. (D) Amino acids at the five most common polymorphic sites of PfRH5 for the seven parasite lines. Deviations from the 3D7 reference sequence are highlighted in red. All GIA data points are the mean of duplicate wells, with each dataset fitted to a four-parameter dose-response curve. See also Figure S2.
Figure S2
Figure S2
Correlation between nAb Kinetic Binding Parameters and GIA, Related to Figures 2 and S1B The binding parameters of nAbs (Kon, Koff and KD) were correlated with growth inhibition using the GIA EC30 as a measure of potency. Only GIA-high nAbs were included in this analysis because of their overt ability to bind merozoite-bound PfRH5, as evidenced by their growth inhibitory properties. EC30 values were calculated from data shown in Figure 2B. Reported P-values are two-tailed and considered significant if P <0.05.
Figure S3
Figure S3
Further Investigations into Anti-PfRH5 mAb Binding Activity, Related to Figure 3 and Table S1 (A) Example graph of raw BLI data used to generate the epitope bins shown in Figure 3A. (B) Table of epitope bin exceptions. “Competing mAbs from separate epitope bins” are mAb pairs in which mAb1 was able to reduce mAb2 binding by ≥ 95% on a one-to-one basis but whose binding profile correlation coefficient was too low to reach the 0.7 threshold. “Incompletely competing mAbs form the same epitope bin” are mAb pairs in which mAb1 was not able to reduce mAb2 binding by ≥ 95% on a one-to-one basis but whose binding profile correlation coefficient was above the 0.7 threshold. (C) AVEXIS assays to determine mAb inhibition of PfRH5FL binding to associated proteins basigin, PfCyRPA and PfP113. In these plate-based assays, monobiotinylated PfRH5FL bait was coated to wells of streptavidin coated microtiter plates. Binding in the presence of each mAb was probed with pentameric prey proteins of either basigin, PfCyRPA or PfP113. Data points are the mean, error bars show the SEM. (D) Example graphs of raw SPR data used to make graphs in Figure 3C. Each assay setup was different for technical reasons. (E) Biotinylated 20-mer peptides overlapping by ten residues and spanning the whole PfRH5 sequence were assayed for mAb binding by ELISA on streptavidin-coated plates. Only two mAbs (R5.007 and c4BA7) were able to bind any of these overlapping peptides. (F) Binding of anti-PfRH5 mAbs to PfRH5Nt by ELISA. “Anti-PfRH5FL IgG” is PfRH5-vaccinated polyclonal IgG of human origin included as a positive control. Data in panels E and F are representative of singlicate wells.
Figure 3
Figure 3
Epitope Binning Reveals that All Relevant Neutralizing Epitopes Lie within PfRH5ΔNL (A) Epitope bins determined by BLI from a matrix of sequential PfRH5FL-binding assays for different mAbs, with data used to construct these bins in Figure S3A and Table S1. (B) Potency of anti-PfRH5 mAb invasion inhibition grouped by epitope bin. EC30 values were interpolated from data in Figure 2B. (C) The effect of mAbs on binding of PfRH5FL to BSG, PfCyRPA, and PfP113Nt, as determined by SPR. Black bars show binding in the absence of mAb as a control. The colors used in (B) and (C) match those of the epitope bins in (A). (D) Binding of anti-PfRH5 mAbs to PfRH5ΔNL by ELISA. Bars show the mean of 4 replicate wells. (E) GIA of purified total IgG from seven different PfRH5FL-vaccinated human volunteers alone or with 0.5 μM of PfRH5FL or PfRH5ΔNL protein (30 μg/mL and 20 μg/mL, respectively). Bars show the mean of duplicate wells. (F) GIA of purified total IgG from rabbits immunized with PfRH5FL or PfRH5ΔNL (n = 6 rabbits per group). Concentrations of PfRH5FL-specific polyclonal IgG were measured by ELISA using a conversion factor determined by calibration-free concentration analysis. Individual data points show the mean of triplicate wells. (G) Comparison of EC50 for rabbit sera. EC50 values were determined for each rabbit by interpolation after fitting the data from (F) to a four-parameter dose-response curve. Black horizontal bars represent the mean. (H) Intravital luminescence signal of humanized mice infected with transgenic P. falciparum (NF54-luciferase) following passive transfer of 15 mg of pre-vaccination or PfRH5ΔNL-vaccinated rabbit IgG at day (d)6 post-infection. Starting groups were n = 2 for the PBS group and n = 4 for the IgG passive transfer groups. Mice that died before the experiment endpoint (d13) were: one at d7 and one at d13 in the PBS group, one at d9 and one at d12 in the pre-vaccination IgG group and one at d6, one at d10 and one at d12 in the vaccinated IgG group. Individual data points are connected by a line representing the mean. (I) Concentration time course of PfRH5-specific rabbit IgG in the passive transfer experiment shown in (H), as determined by ELISA binding to PfRH5FL. Data points show the mean. All GIAs used 3D7 clone P. falciparum. All error bars show the SEM.
Figure 4
Figure 4
Structures of R5.004 and R5.016 Epitopes (A) Structure of PfRH5ΔNL bound to R5.004 and R5.016 Fab fragments. Insets show close-up views of epitopes. (B) The top PfRH5 peptides protected in HDX-MS by R5.004 mAb (blue) and R5.016 mAb (red) binding, are highlighted on the structure of PfRH5ΔNL. Positions of Fab fragments are overlaid as faded cartoons. (C) Overlay of PfRH5ΔNL:BSG (PDB: 4U0Q, BSG in teal) with R5.004 Fab or R5.016 Fab structures at their respective binding sites in the PfRH5ΔNL:R5.004:R5.016 structure. See also Figure S4 and Tables S2 and S3.
Figure S4
Figure S4
PfRH5 Peptide Protection in HDX-MS by R5.004 and R5.016 and Description of Bound R5.004 and R5.016 Fab Fragments, Related to Figure 4 (A) PfRH5 peptide map showing PfRH5FL protection from deuteration upon R5.004 (left) and R5.016 (right) binding. Secondary structure is shown in gray. Examples of highly protected peptides are shown in the mass spectra below (NIWRTFQKDEL for R5.004 and IAVDAF for R5.016). Black mass spectra show non-deuterated peptide, red show the same peptide after unbound (apo) PfRH5FL labeling and blue after PfRH5FL-mAb complex labeling. HDX-MS data for R5.004 were generated following 20 s of labeling and R5.016 after 2 h. (B) 2Fo-Fc electron density maps of the R5.004 and R5.016 variable domains in the bound state, taken from the PfRH5ΔNL:R5.004:R5.016 co-complex structure. The electron density map is contoured at 1.0 σ. (C) Structural alignments of R5.004 and R5.016 Fab fragments unbound (white) and bound to PfRH5ΔNL (R5.004 in blue, R5.016 in red). Light chain and heavy chain CDR loops are annotated.
Figure 5
Figure 5
Non-neutralizing mAb R5.011 Potentiates the Growth Inhibitory Effect of Anti-PfRH5 nAbs (A) GIA of nAbs R5.008 (300 μg/mL), R5.016 (150 μg/mL), and R5.018 (400 μg/mL) alone (colored data points) or in the presence of an equimolar concentration of a mAb that blocks its binding to PfRH5FL in vitro (gray data points). (B) GIA of human anti-PfRH5 mAbs at 150 μg/mL alone (colored data points) or in the presence of 150 μg/mL R5.011 (gray data points). (C) GIA of total human IgG from five PfRH5FL-vaccinated volunteers (1017, 1020, 2205, 2207, and 2210) at 5 mg/mL, alone (red data points) in the presence of 300 μg/mL of R5.011 or R5.003. (D) GIA of a dilution series of mAbs R5.004, R5.016, and R5.011 alone (blue, red, and green, respectively) as well as a dilution series of the R5.004 and R5.016 nAbs in the presence of an excess of R5.011 (500 μg/mL) (gray) to determine the maximal effect of R5.011. “Concentration of test mAb” refers to the concentration of nAb in mAb combinations. (E) GIA of total IgG from rabbits immunized with PfMSP1 (5 mg/mL, green), PfRH4 (10 mg/mL, black), PfCyRPA (5 mg/mL, yellow), PfRipr (10 mg/mL, orange), or PfAMA1 (3.25 mg/mL, pink) with the addition of 300 μg/mL of R5.011 or R5.009 (gray data points). Concentrations were chosen to achieve ∼30%–60% GIA in the absence of mAb. All data points are the mean of 3 replicates and all error bars show the SEM. Parasites used were 3D7 clone P. falciparum. See also Figure S5.
Figure S5
Figure S5
Investigations into the Effect of R5.011, Related to Figure 5 (A) GIA of 150 μg/mL of R5.016 alone or in combination with 150 μg/mL of each mAb from the green epitope bin (and R5.015 as a negative control) to determine whether the potentiating effect of R5.011 occurs with similar mAbs. (B) GIA of polyclonal IgG from a PfRH5FL-vaccinated rabbit at 7 mg/mL alone (red) or mixed with increasing concentrations of R5.011 (gray). (C) GIAs of nAbs R5.004 and R5.016 alone or with R5.011 as various mAb + Fab fragment combinations. x axis concentration values are plotted as the concentration of nAb binding site. mAb-mAb combinations are equimolar and mAb-Fab combinations are equimolar in terms of binding sites. (D) mAb R5.011 is titrated in increasing concentrations into three fixed concentrations of nAb R5.004 or R5.016 to determine the concentration at which R5.011 enhancement reaches a maximum. (E) GIA of titration curves of R5.016 + R5.011 combinations in different molar ratios. (F) GIA of total IgG from a PfRH4-vaccinated rabbit (black), a PfCyRPA-vaccinated rat (yellow), a PfRipr-vaccinated rabbit (orange) and a PfAMA1-vaccinated rabbit (pink) in the presence of an excess of R5.011 mAb (1.5 mg/mL, all gray data points) showing the maximal extent of R5.011-mediated synergy. The x axis shows the concentration of animal-derived IgG only and does not include the R5.011 concentration. (G) GIA of the most potent single human anti-PfRH5 mAb (R5.016), the most potent combination of two human anti-PfRH5 mAbs (R5.016 + R5.011) and of a 1611 bispecific DVD-Ig. The cartoon shows a schematic of the 1611 DVD-Ig comprising R5.011 and R5.016 variable regions. All data points are the mean of 3 replicate wells, all error bars show the SEM. Parasites used were 3D7 clone P. falciparum.
Figure 6
Figure 6
Structure of PfRH5ΔNL in Complex with R5.011 and R5.016 (A) Crystal structure of PfRH5ΔNL bound to Fab fragments from R5.011 and R5.016. The top left inset shows a close-up of the R5.011 epitope. The bottom left inset shows PfRH5 as a gray surface with the peptide most protected by R5.011 mAb in a HDX-MS assay in green. R5.011 is overlaid as a faded cartoon. (B) Overlay of R5.004, R5.011 and R5.016 structures bound to PfRH5ΔNL. See also Figure S6 and Tables S2 and S3.
Figure S6
Figure S6
PfRH5 Peptide Protection in HDX-MS by R5.011 and Description of R5.011 Fab Fragment Interaction with PfRH5, Related to Figure 6 (A) Peptide map showing protection of PfRH5FL from deuteration during R5.011 binding. Secondary structure is shown in gray. An example of a highly protected peptide is shown in the mass spectra below (peptide NIANS). Black mass spectra show non-deuterated NIANS peptide, red show the same peptide after unbound (apo) PfRH5FL labeling and blue after PfRH5FL-mAb complex labeling. HDX-MS data for R5.011 was generated following 20 s of labeling. (B) Structural alignment of PfRH5 from the PfRH5ΔNL:R5.004:R5.016 co-complex (in beige), the PfRH5ΔNL:R5.011:R5.016 co-complex (in magenta) and the PfRH5 from PDB entry 4WAT (in light purple), to highlight differences in conformation of the N terminus. (C) Structural alignment of R5.011 Fab fragment unbound (white) and bound to PfRH5ΔNL (green). Light chain and heavy chain CDR loops are annotated. (D) 2Fo-Fc electron density map of the R5.011 variable domains in the bound state, taken from the PfRH5ΔNL:R5.011:R5.016 co-complex structure. The electron density map is contoured at 1.0 σ. (E) SPR sensorgrams of R5.004 (left) or R5.016 (right) binding to PfRH5FL (top) or PfRH5FL-R5.011 Fab fragment complex (bottom). Reported KD and Kon values are the average of three independent experiments.
Figure 7
Figure 7
R5.011 Increases Parasite Invasion Time (A) Total time for RBC invasion in the presence of R5.011 or an irrelevant isotype-matched antibody control (α-EBOV). (B) Time for early invasion (pre-penetration) and late invasion (penetration). Data are presented as box-and-whiskers plots showing the interquartile range and total range overlaid on individual data points. Solid black lines show the mean for each group. 3D7 clone P. falciparum parasites were used. Both mAbs were used at 500 μg/mL and 21 and 22 invasion events were recorded for α-EBOV and R5.011, respectively. ∗∗∗∗p < 0.0001; n.s., non-significant. See also Figure S7 and Videos S1, S2, and S3.
Figure S7
Figure S7
Additional Information from Live-Cell Microscopy Experiments, Related to Figure 7 and Videos S1, S2, and S3 (A) Mean and median early (pre-penetration), late (penetration) and total invasion times of merozoites incubated with 500 μg/mL of R5.011 or α-EBOV. (B) Total invasion times of merozoites in the presence of neutralizing mAb R5.016 (red), synergistic mAb combination R5.011 + R5.016 (gray), non-neutralizing, non-potentiating mAb R5.009 (orange) or α-EBOV (black) mAb at the concentrations indicated. Data are representative of n = 9 invasions for R5.009, R5.016 10 μg/mL and R5.016 + R5.011, n = 12 for R5.016 500 μg/mL, n = 21 for α-EBOV and are presented as box-and-whiskers plots showing the interquartile range and total range overlaid on individual data points. Solid black lines show the mean for each group. 3D7 clone P. falciparum parasites were used. n.s = non-significant.

Comment in

Similar articles

Cited by

References

    1. Afonine P.V., Grosse-Kunstleve R.W., Echols N., Headd J.J., Moriarty N.W., Mustyakimov M., Terwilliger T.C., Urzhumtsev A., Zwart P.H., Adams P.D. Towards automated crystallographic structure refinement with phenix.refine. Acta Crystallogr. D Biol. Crystallogr. 2012;68:352–367. - PMC - PubMed
    2. Afonine, P.V., Grosse-Kunstleve, R.W., Echols, N., Headd, J.J., Moriarty, N.W., Mustyakimov, M., Terwilliger, T.C., Urzhumtsev, A., Zwart, P.H., and Adams, P.D. (2012). Towards automated crystallographic structure refinement with phenix.refine. Acta Crystallogr. D Biol. Crystallogr. 68, 352-367. - PMC - PubMed
    1. Balazs A.B., Chen J., Hong C.M., Rao D.S., Yang L., Baltimore D. Antibody-based protection against HIV infection by vectored immunoprophylaxis. Nature. 2011;481:81–84. - PMC - PubMed
    2. Balazs, A.B., Chen, J., Hong, C.M., Rao, D.S., Yang, L., and Baltimore, D. (2011). Antibody-based protection against HIV infection by vectored immunoprophylaxis. Nature 481, 81-84. - PMC - PubMed
    1. Bates J.T., Keefer C.J., Slaughter J.C., Kulp D.W., Schief W.R., Crowe J.E., Jr. Escape from neutralization by the respiratory syncytial virus-specific neutralizing monoclonal antibody palivizumab is driven by changes in on-rate of binding to the fusion protein. Virology. 2014;454-455:139–144. - PMC - PubMed
    2. Bates, J.T., Keefer, C.J., Slaughter, J.C., Kulp, D.W., Schief, W.R., and Crowe, J.E., Jr. (2014). Escape from neutralization by the respiratory syncytial virus-specific neutralizing monoclonal antibody palivizumab is driven by changes in on-rate of binding to the fusion protein. Virology 454-455, 139-144. - PMC - PubMed
    1. Baum J., Chen L., Healer J., Lopaticki S., Boyle M., Triglia T., Ehlgen F., Ralph S.A., Beeson J.G., Cowman A.F. Reticulocyte-binding protein homologue 5 - an essential adhesin involved in invasion of human erythrocytes by Plasmodium falciparum. Int. J. Parasitol. 2009;39:371–380. - PubMed
    2. Baum, J., Chen, L., Healer, J., Lopaticki, S., Boyle, M., Triglia, T., Ehlgen, F., Ralph, S.A., Beeson, J.G., and Cowman, A.F. (2009). Reticulocyte-binding protein homologue 5 - an essential adhesin involved in invasion of human erythrocytes by Plasmodium falciparum. Int. J. Parasitol. 39, 371-380. - PubMed
    1. Beernink P.T., Welsch J.A., Bar-Lev M., Koeberling O., Comanducci M., Granoff D.M. Fine antigenic specificity and cooperative bactericidal activity of monoclonal antibodies directed at the meningococcal vaccine candidate factor h-binding protein. Infect. Immun. 2008;76:4232–4240. - PMC - PubMed
    2. Beernink, P.T., Welsch, J.A., Bar-Lev, M., Koeberling, O., Comanducci, M., and Granoff, D.M. (2008). Fine antigenic specificity and cooperative bactericidal activity of monoclonal antibodies directed at the meningococcal vaccine candidate factor h-binding protein. Infect. Immun. 76, 4232-4240. - PMC - PubMed

Publication types

MeSH terms