. 2019 Jul 22;50(2):197-211.e5.
doi: 10.1016/j.devcel.2019.05.027. Epub 2019 Jun 13.

Mechanical Function of the Nucleus in Force Generation during Epithelial Morphogenesis

Affiliations

Mechanical Function of the Nucleus in Force Generation during Epithelial Morphogenesis

Arnaud Ambrosini et al. Dev Cell. .

Abstract

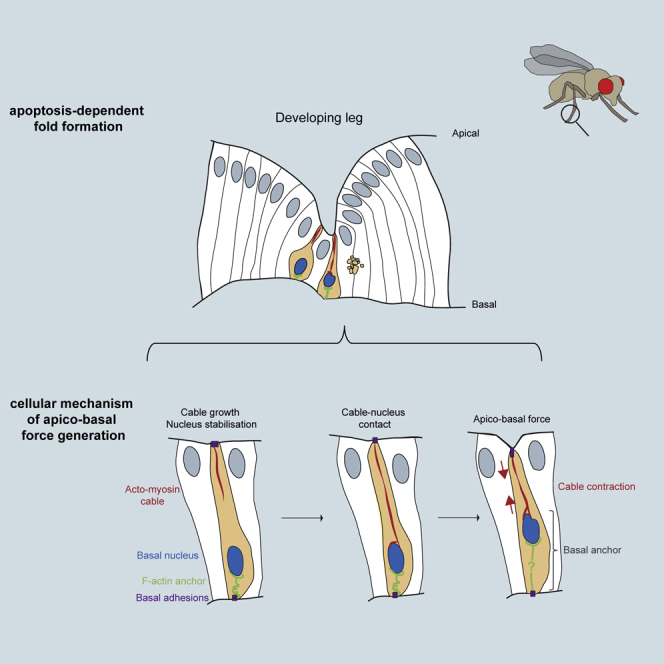
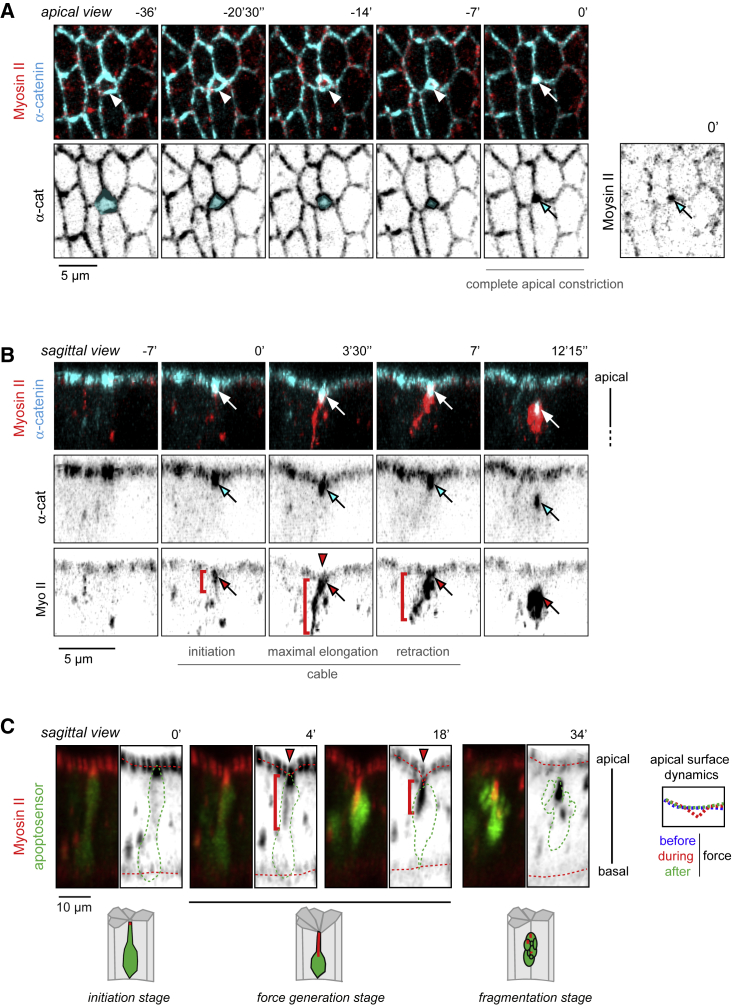
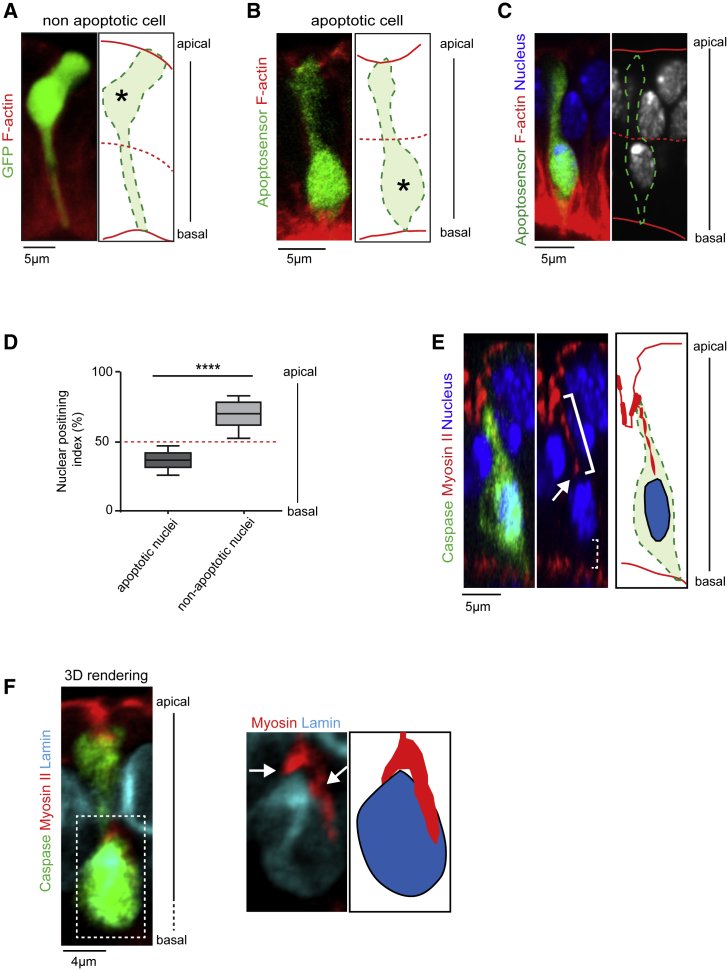
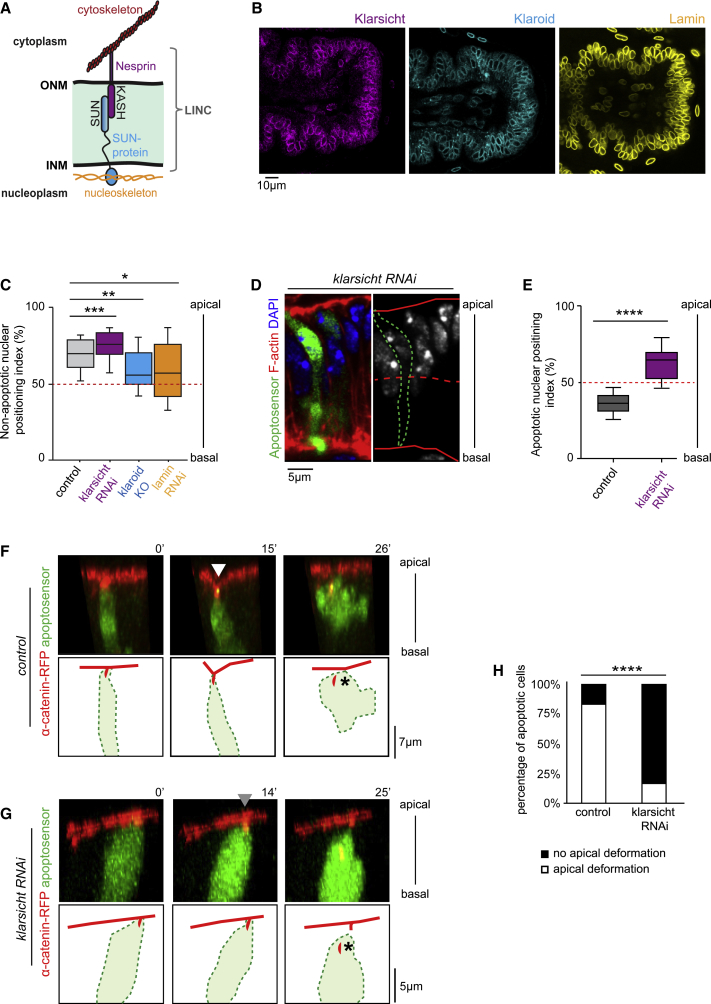
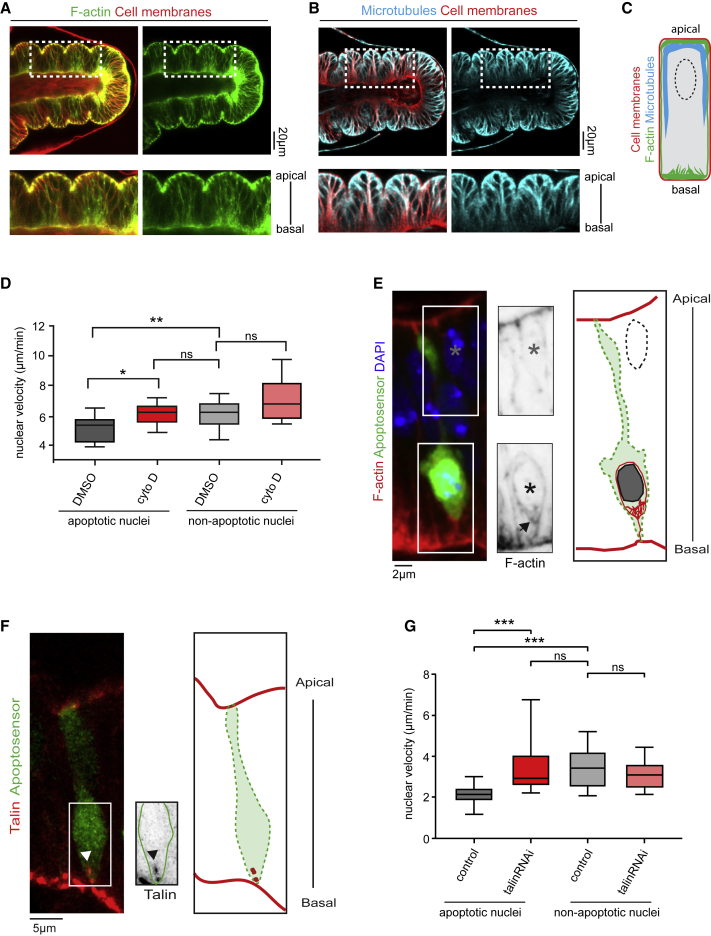
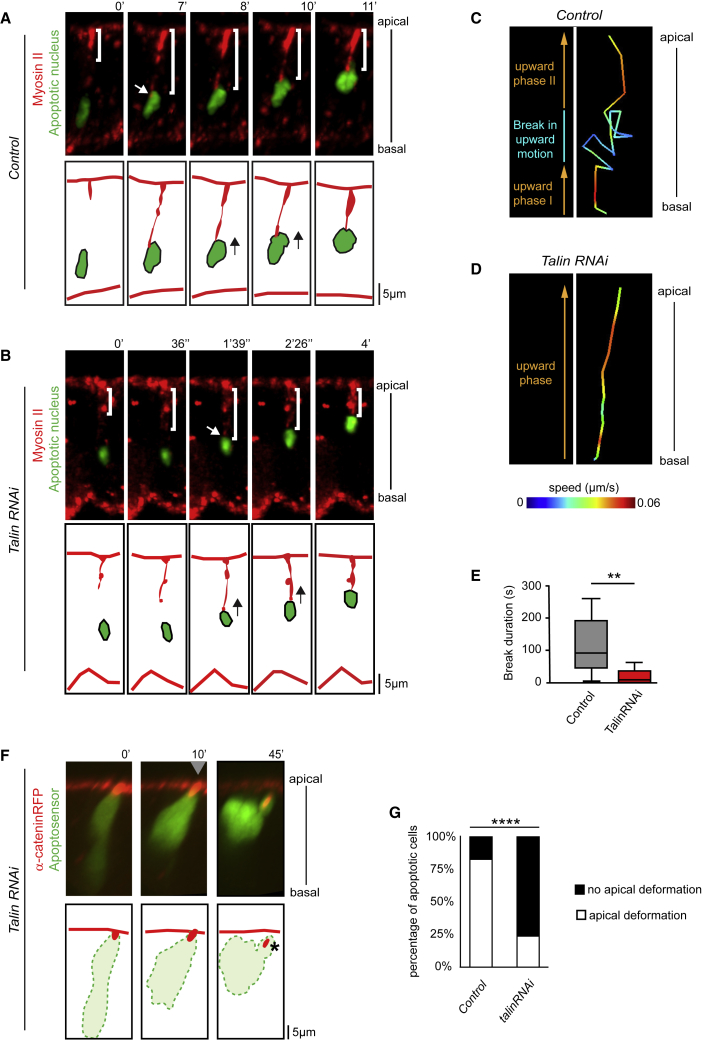
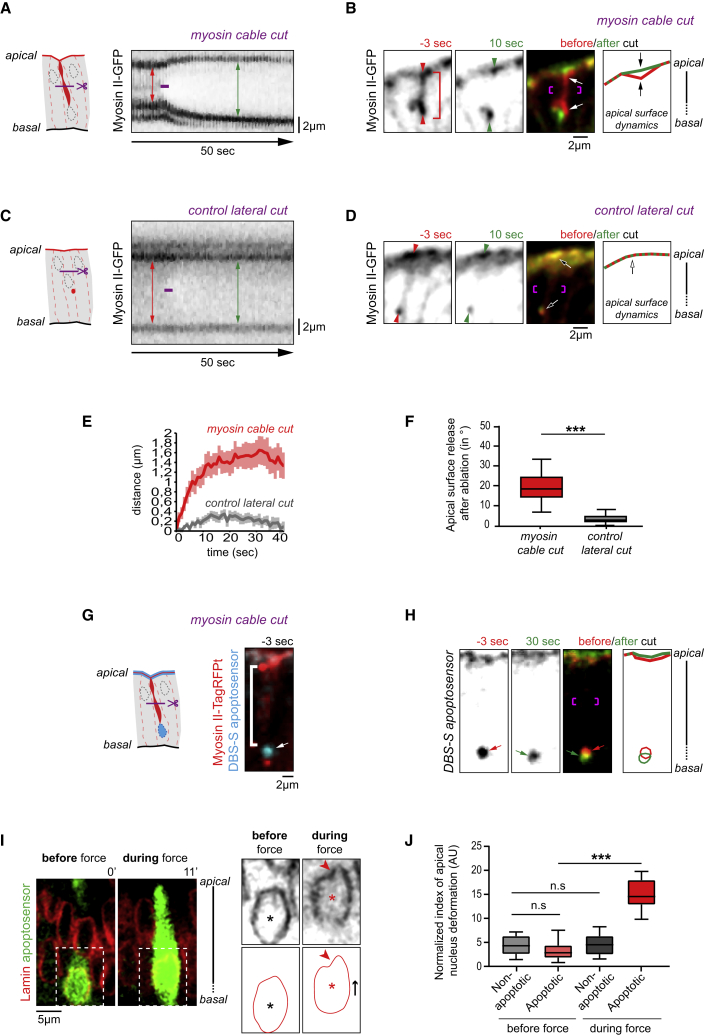
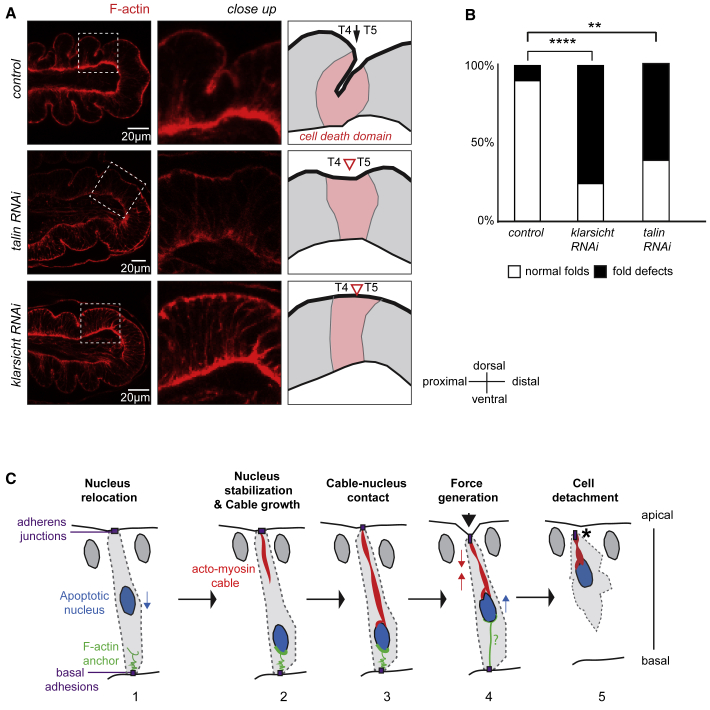
Mechanical forces are critical regulators of cell shape changes and developmental morphogenetic processes. Forces generated along the epithelium apico-basal cell axis have recently emerged as essential for tissue remodeling in three dimensions. Yet the cellular machinery underlying those orthogonal forces remains poorly described. We found that during Drosophila leg folding cells eventually committed to die produce apico-basal forces through the formation of a dynamic actomyosin contractile tether connecting the apical surface to a basally relocalized nucleus. We show that the nucleus is anchored to basal adhesions by a basal F-actin network and constitutes an essential component of the force-producing machinery. Finally, we demonstrate force transmission to the apical surface and the basal nucleus by laser ablation. Thus, this work reveals that the nucleus, in addition to its role in genome protection, actively participates in mechanical force production and connects the contractile actomyosin cytoskeleton to basal adhesions.

Keywords: Drosophila; LINC; Live imaging; Talin; actomyosin; apoptosis; basal adhesion; linker of nucleoskeleton and cytoskeleton complex; mechanical forces; morphogenesis; nucleus.


Conflict of interest statement

The authors declare no competing interests.

Figures

None
Graphical abstract
Figure 1
Figure 1
Coordinated Dynamics of Adherens Junction and Myosin II in Apoptotic Cells (A and B) Stills from a movie showing apical (A) and sagittal views (B) of the same cell stained with the adherens junction marker α-catenin (cyan) and myosin (red) (n = 11). (A) White arrowheads on the merge images show apoptotic cell apical constriction until the apex is completely closed. Apoptotic cell is colored in cyan on the black and white images. Myosin starts to accumulate at adherens junctions when they are closed (white and cyan arrows). (B) White, cyan, and red arrows show the colocalization between Myosin II and α-catenin during the apoptotic process. The red arrowhead points at the transient deformation of the apical surface of the epithelium triggered by the apico-basal force. The red brackets follow the myosin cable. (C) Stills form a movie showing the myosin cable (red) inside the apoptotic cell (green) (n = 15) and the corresponding schemes. The red brackets follow the myosin cable whose maximal extension reaches the middle of the cell (4′). The apoptotic cell is outlined in green and the apical and basal surfaces are highlighted by red dotted lines on the black and white images. The red arrowhead points at the transient deformation of the apical surface. The panel on the right illustrates apical surface dynamics (color-coded) during apoptosis.
Figure 2
Figure 2
Proximity between the Myosin Cable and the Basal Apoptotic Nucleus (A and B) Sagittal views and schematic representations showing the localization of cell bodies (asterisk) in individual nonapoptotic (A) and apoptotic (B) cells (n = 24 and 23). Cells are outlined in dotted green lines in the schematic representations. (C) Sagittal view showing nuclei positioning (blue or white) in apoptotic (green or dashed green line) and nonapoptotic cells. Only the apoptotic nucleus is located in the basal half of the epithelium. In (A–C), apical and basal surfaces are schematized by a red line and the midplane of the epithelium by a red dashed line. (D) Box plot representation of the quantification of nuclei localization along the apico-basal cell axis in apoptotic (n = 25) and nonapoptotic (n = 115) cells. Wilcoxon statistical test: p value < 0.0001 (∗∗∗∗). The midplane of the epithelium is indicated by a dashed red line. (E) Sagittal view and schematic representation showing the myosin cable (highlighted by the white bracket) which extends toward the basal apoptotic nucleus (arrow) (n = 13). No myosin accumulation can be detected between the apoptotic nucleus and the basal-most region of the cell (dashed bracket). (F) (Left) 3D reconstructions of a general view of an apoptotic cell (green) and a close-up of the nucleus (Lamin-TagRFPt in cyan) (n = 9). (Right) Schematic representation. The myosin cable (red) contacts the apical side of the nucleus (white arrows). (E and F) Apoptotic cells are stained in green with an anti-cleaved Dcp1 antibody. See also Figure S1.
Figure 3
Figure 3
Basal Positioning of the Nucleus Is Essential for Apico-basal Force Generation (A) Scheme describing the LINC complex made of SUN- and KASH-domain proteins. The color-code for Nesprin, SUN-protein, and nucleoskeleton is used in (B) and (C). ONM, outer nuclear membrane; INM, inner nuclear membrane. (B) Perinuclear localization of LINC members (Klarsicht and Klaroid) and Lamin in the leg tissue. (C) Box plot of the apico-basal distribution of nonapoptotic nuclei in the epithelium of control (n = 115), klarsicht RNAi (n = 67), lamin RNAi (n = 24), and klaroid mutant (n = 21). The red dotted line indicates the midplane of the epithelium in the graph. Mann & Whitney test: p value < 0.0001 for ∗∗∗, <0.0024 for ∗∗, and <0.0144 for . (D) Sagittal views showing that the apoptotic nucleus is located apically in a klarsicht RNAi context. Nuclei are in blue or white and the apoptotic cell is indicated in green or with a green dotted line. Apical and basal surfaces of the epithelium are outlined in red and the midplane of the epithelium with a red dotted line. (E) Box plot of apoptotic nucleus distribution in the apico-basal cell axis in control (n = 25) and klarsicht RNAi (n = 33) contexts. The red dotted line indicates the midplane of the epithelium in the graph. Mann & Whitney test: p value < 0.0001 (∗∗∗∗). (F and G) Stills from time-lapse movies and corresponding schemes showing apoptotic cell dynamics in control (F) and klarsicht RNAi (G) contexts. Arrowheads mark the presence (F, in white) or the absence (G, in gray) of deformation of the apical surface. Black stars indicate the adherens junction apical accumulation detachment. t = 0′ is set at the end of the apoptotic apical constriction. (H) Histogram showing the proportion of apoptotic cells deforming or not the apical surface of the epithelium in control (n = 23) and klarsicht RNAi (n = 12) contexts. Fisher statistical test: p value < 0.0003 for ∗∗∗∗. See also Figure S2.
Figure 4
Figure 4
A Basal Adhesion-F-Actin Network Stabilizes the Basal Apoptotic Nucleus (A and B) Confocal images showing distribution of F-actin (Utrophin-GFP reporter, green, A) and microtubules (MAP205::GFP protein trap, cyan, B) in live leg discs. The cell membranes are stained in red using the lipid dye FM4-64 to visualize the leg epithelium. (C) Schematization of F-actin and microtubules distribution in the leg disc observed in (A) and (B). F-actin is enriched in the cell’s apical and basal domains and, to a lesser extent, in the lateral domain. Microtubules accumulate mainly in apical and lateral domains. They are essentially absent from the cell’s basal pole. (D) Box plot representation of apoptotic and nonapoptotic nuclei displacement per minute in control (DMSO; n = 9 and 9) and after treatment by Cytochalasin D (n = 21 and 21). Wilcoxon statistical test: p value < 0.0039 for ∗∗ and Mann Whitney statistical test: p value < 0.0246 for and nonsignificant for n.s. (E) Sagittal view and scheme showing the presence of a basal F-actin structure (black arrow) contacting the apoptotic nucleus (black star), but not a nonapoptotic nucleus (gray star). F-actin is in red (left) or black (right), nuclei in blue, and the apoptotic cell in green (n = 24). (F) Sagittal view and scheme showing the presence of Talin (in red and black, arrowheads) in an apoptotic cell (green) (n = 4). (G) Box plot representation of apoptotic and nonapoptotic nuclei displacement per minute in control (n = 12 and 11) and talin RNAi (n = 11 and 10). Wilcoxon statistical test: p value < 0.001 for ∗∗∗, and Mann Whitney statistical test: p value < 0.0007 for ∗∗∗, and nonsignificant for n.s. (D and G) A non-paired Mann Whitney test was used to compare nuclei displacement between conditions, except for comparison of apoptotic versus nonapoptotic nuclei in DMSO (D) or control (G) for which we used a paired Wilcoxon test. In (D–G), apoptotic cells are at the initiation stage, before the generation of the apico-basal force. See also Figure S3.
Figure 5
Figure 5
Basal Apoptotic Nucleus Stabilization Is Essential for Efficient Apico-basal Force Generation (A and B) Stills from time-lapse movies and schematic representations showing the dynamics of Myosin II (red) and the apoptotic nucleus (green) after post-acquisition treatment (see Figure S4 and STAR Methods for details) in control (A, n = 12) and talin RNAi context (B, n = 10). White brackets highlight the dynamics of apoptotic myosin cable, white arrows indicate cable-nucleus contact, and black arrows on the schemes indicate nuclei movements. (C and D) Comparison of apoptotic nuclei upward movements in control (C, n = 12) and talin RNAi (D, n = 10) contexts. Trajectories are color-coded to reveal nuclei speed. (E) Box plot representation of the duration of the break in nucleus upward movement in control and talin RNAi contexts based on the movement observed in (C) and (D). Mann Whitney test: p value < 0.0039 for ∗∗. (F) Still from a time-lapse movie and corresponding schemes showing apoptotic cell dynamics in talin RNAi context. No apical surface deformation, indicative of an absence of apico-basal force, is observed (gray arrowhead). Adherens junction apical accumulation detaches normally (star). t = 0′ is set at the end of the apoptotic apical constriction (n = 23). (G) Histogram showing the proportion of apoptotic cells deforming or not the apical surface of the epithelium in control (n = 23) and in talin RNAi (n = 25). Fisher statistical test: p value < 0.0001 for ∗∗∗∗. See also Figure S4.
Figure 6
Figure 6
Forces Generated by the Apoptotic Myosin Cable Are Transmitted to the Apical Surface and the Nucleus (A–D) Laser ablation of apico-basal myosin cable (A and B) and control lateral cut in nonapoptotic cells (C and D). In kymographs, red and green double arrows indicate the distance between two dots before and after cut respectively. Cuts were performed at the level of the apico-basal myosin cable (A) or at control lateral site (C). The timing of laser cut is indicated by the purple line. (B and D) Stills extracted from movies showing sagittal views of the epithelium before (red) and after (green) laser cut at the level of the apico-basal myosin cable (B) or at a control lateral site (D). The myosin cable and the localization of the cut are shown by red and purple brackets respectively. Apico-basal recoil is observed in 13 out of 14 cases following cable cut (B) and 3 out of 17 following control lateral cut (D). (E) Curves of the average apico-basal recoil +/− SEM over time (cable cut n = 14; control cut n = 17). (F) Box plot representation of the apical surface release following apico-basal ablation in the indicated contexts. It corresponds to the variation in the angle made by the apical surface 25 s after ablation, compared to 1 s prior ablation (cable cut n = 15; control cut n = 17). Wilcoxon test: p value < 0.0002 (∗∗∗). (G and H) Stills extracted from a movie showing apoptotic nucleus behavior upon laser ablation of apico-basal myosin cable. (G) The DBS-S apoptosensor (cyan on the left panel) labels the nucleus in dying cells (arrow) and is enriched in the apical membrane in nonapoptotic cells. Myosin is shown in red and the apico-basal cable is highlighted by the white bracket. (H) Merge of DBS-S signal before (red) and after (green) myosin cable cut and associated schematization. Site of ablation is indicated by purple brackets. Individual images are shown in black and white on the left. The apoptotic nucleus moves basally after ablation in 9 cases out of 16, leading to an average basal displacement of 0.6 +/− 0.14 μm. (I) Stills extracted from a movie showing nuclear envelope dynamics (red) of a dying cell (green) before (left) and during (right) the apoptotic nucleus upward movement associated with the force-generation stage. A close-up view of the apoptotic nuclear envelope is shown in black and schematized. Note that the apoptotic nucleus is apically deformed during the force-generation stage (arrowheads, n = 12/12). Asterisks identify the center of the nucleus, highlighting the upward nuclear movement (black arrow). (J) Normalized index of nuclear envelope apical deformation before and during the force-generation stage represented as box plots (see STAR Methods; apoptotic nuclei, n = 12; nonapoptotic nuclei, n = 35). AU: arbitrary unit. Wilcoxon statistical test was used for the comparison of nuclei before and during force transmission; apoptotic nuclei (p value < 0.0005 for ∗∗∗) and nonapoptotic nuclei (n.s., nonsignificant). Mann Whitney was used for comparison of apoptotic nuclei versus nonapoptotic nuclei before force transmission (n.s.).
Figure 7
Figure 7
Perturbation of Apico-basal Force-Generation Affects Fold Formation (A) General sagittal views of the distal leg (left), close up views on the T4/5 segments, and corresponding schemes of a control (top), talin RNAi (middle) and klarsicht RNAi (bottom) leg discs at 3–4 h after puparium formation. While deep folds form in the control (black arrow), shallow of absent folds are observed in knock-down contexts (open arrowheads). (B) Histogram representation of the quantification of fold defects observed in control (n = 20), klarsicht RNAi (n = 37), and talin RNAi (n = 13) contexts. Fisher's statistical test: p values: <0.0001 for ∗∗∗∗ and <0.0036 for ∗∗. (C) Model of the cellular organization responsible of apico-basal force generation in epithelial apoptotic cells: The apoptotic nucleus is first relocalized basally (1). It becomes anchored basally by an actin structure linked to basal adhesion (2). At the same stage, the Myosin II apico-basal cable starts its progression from the apical surface. Next, the myosin cable enters in contact with the nucleus, running along its apical surface (3). At this stage, basal adhesion, basal F-actin and the nucleus form a basal anchor to the cable. Subsequently, the Myosin II cable contracts deforming the apical surface of the epithelium and the apical side of the nucleus, thus transmitting force to the neighbors (4). Although the basal anchor is required at this stage, its organization is only speculative (question mark). Eventually, the force ends when the cell detaches from its neighbors (asterisk, 5).

Comment in

Similar articles

Cited by

References

    1. Alam S.G., Lovett D., Kim D.I., Roux K.J., Dickinson R.B., Lele T.P. The nucleus is an intracellular propagator of tensile forces in NIH 3T3 fibroblasts. J. Cell Sci. 2015;128:1901–1911. - PMC - PubMed
    1. Ambrosini A., Gracia M., Proag A., Rayer M., Monier B., Suzanne M. Apoptotic forces in tissue morphogenesis. Mech. Dev. 2017;144:33–42. - PubMed
    1. Andrade D., Rosenblatt J. Apoptotic regulation of epithelial cellular extrusion. Apoptosis. 2011;16:491–501. - PMC - PubMed
    1. Arsenovic P.T., Ramachandran I., Bathula K., Zhu R., Narang J.D., Noll N.A., Lemmon C.A., Gundersen G.G., Conway D.E. Nesprin-2G, a component of the nuclear LINC complex, is subject to myosin-dependent tension. Biophys. J. 2016;110:34–43. - PMC - PubMed
    1. Baena-Lopez L.A., Arthurton L., Bischoff M., Vincent J.P., Alexandre C., McGregor R. Novel initiator caspase reporters uncover previously unknown features of caspase-activating cells. Development. 2018;145 - PMC - PubMed

Publication types