. 2020 Mar;16(3):548-561.
doi: 10.1080/15548627.2019.1632104. Epub 2019 Jun 23.

Glucosamine promotes hepatitis B virus replication through its dual effects in suppressing autophagic degradation and inhibiting MTORC1 signaling

Affiliations

Glucosamine promotes hepatitis B virus replication through its dual effects in suppressing autophagic degradation and inhibiting MTORC1 signaling

Yong Lin et al. Autophagy. 2020 Mar.

Abstract

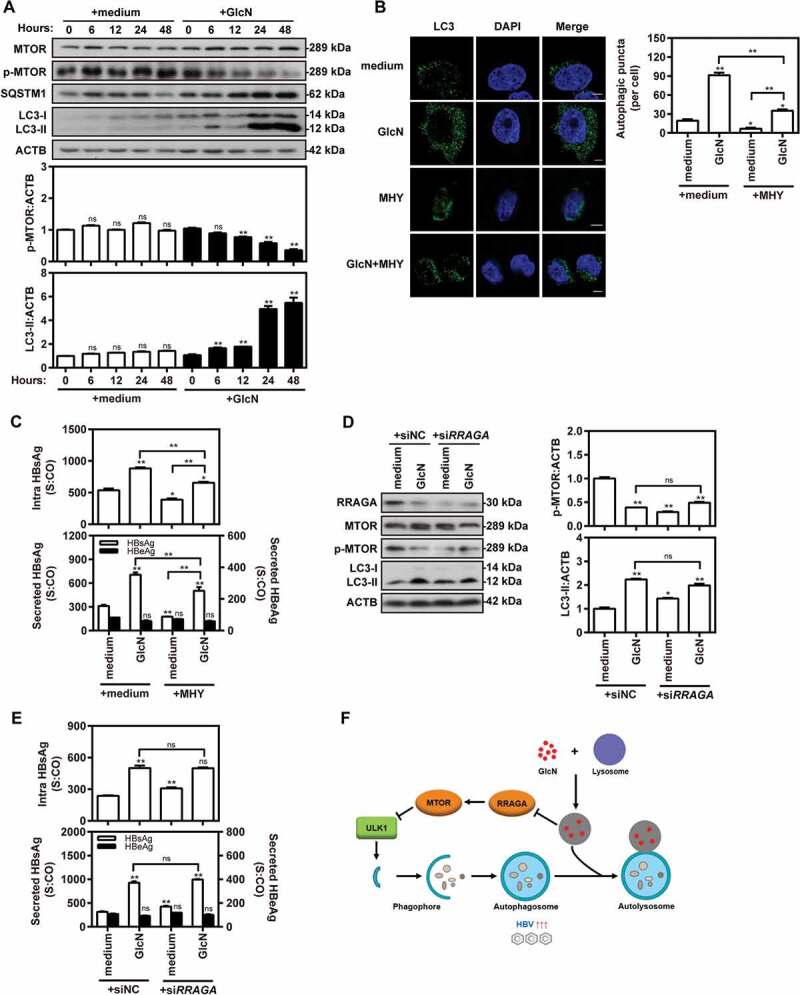
Glucosamine (GlcN), a dietary supplement widely utilized to promote joint health and effective in the treatment of osteoarthritis, is an effective macroautophagy/autophagy activator in vitro and in vivo. Previous studies have shown that autophagy is required for hepatitis B virus (HBV) replication and envelopment. The objective of this study was to determine whether and how GlcN affects HBV replication, using in vitro and in vivo experiments. Our data demonstrated that HBsAg production and HBV replication were significantly increased by GlcN treatment. Confocal microscopy and western blot analysis showed that the amount of autophagosomes and the levels of autophagic markers MAP1LC3/LC3-II and SQSTM1 were clearly elevated by GlcN treatment. GlcN strongly blocked autophagic degradation of HBV virions and proteins by inhibiting lysosomal acidification through its amino group. Moreover, GlcN further promoted HBV replication by inducing autophagosome formation via feedback inhibition of mechanistic target of rapamycin kinase complex 1 (MTORC1) signaling in an RRAGA (Ras related GTP binding A) GTPase-dependent manner. In vivo, GlcN application promoted HBV replication and blocked autophagic degradation in an HBV hydrodynamic injection mouse model. In addition, GlcN promoted influenza A virus, enterovirus 71, and vesicular stomatitis virus replication in vitro. In conclusion, GlcN efficiently promotes virus replication by inducing autophagic stress through its dual effects in suppressing autophagic degradation and inhibiting MTORC1 signaling. Thus, there is a potential risk of enhanced viral replication by oral GlcN intake in chronically virally infected patients.Abbreviations: ACTB: actin beta; ATG: autophagy-related; CMIA: chemiluminescence immunoassay; ConA: concanavalin A; CQ: chloroquine; CTSD: cathepsin D; DAPI: 4',6-diamidino-2-phenylindole; EV71: enterovirus 71; GalN: galactosamine; GFP: green fluorescence protein; GlcN: glucosamine; GNPNAT1: glucosamine-phosphate N-acetyltransferase 1; HBP: hexosamine biosynthesis pathway; HBV: hepatitis B virus; HBcAg: hepatitis B core antigen; HBsAg: hepatitis B surface antigen; HBeAg: hepatitis B e antigen; HBV RI: hepatitis B replicative intermediate; IAV: influenza A virus; LAMP1: lysosomal associated membrane protein 1; LAMTOR: late endosomal/lysosomal adaptor, MAPK and MTOR activator; ManN: mannosamine; MAP1LC3/LC3: microtubule associated protein 1 light chain 3; MTORC1: mechanistic target of rapamycin kinase complex 1; PHH: primary human hepatocyte; RAB7: RAB7A, member RAS oncogene family; RPS6KB1: ribosomal protein S6 kinase B1; RRAGA: Ras related GTP binding A; RT-PCR: reverse transcriptase polymerase chain reaction; SEM: standard error of the mean; siRNA: small interfering RNA; SQSTM1/p62: sequestosome 1; UAP1: UDP-N-acetylglucosamine pyrophosphorylase 1; VSV: vesicular stomatitis virus.

Keywords: Autophagy; HBV; MTORC1 signaling; glucosamine; lysosomal acidification.


Figures

Figure 1.
Figure 1.
GlcN promotes HBV replication and HBsAg expression. (A) PHHs infected with HBV virions (multiplicity of infection [MOI] = 30) were treated with 5 mM GlcN, ManN, or GalN and harvested after 48 h. (B) HepG2.2.15 cells were treated with 5 mM GlcN, ManN, or GalN for 48 h. HBsAg and HBeAg from culture supernatants and intracellular HBsAg from cell lysates were quantified by CMIA. (C) Cell viability was measured by CCK8 assay at 0, 24, 48, or 72 h after treatment with GlcN at different concentrations (1, 2, 5, and 10 mM). (D–E) HepG2.2.15 cells were treated with 0, 1, 2, or 5 mM GlcN for 48 h. (E) Encapsidated HBV replicative intermediates were detected by Southern blotting. The levels of HBV genomes in culture supernatants were determined by qPCR. (F) HBV RNA levels in HepG2.2.15 cells were analyzed by northern blotting. S:CO, signal to cutoff ratio; RC, relaxed circular DNA; SS, single-stranded DNA. *P < 0.05; **P < 0.01; ns, not significant.
Figure 2.
Figure 2.
GlcN promotes HBV replication by suppressing autophagic degradation. (A) HepG2.2.15 cells were treated with 5 mM GlcN with or without 100 µM OGT inhibitor PUGNAc or 10 µM OGA inhibitor OSMI-1 for 24 h. (B) HepG2.2.15 cells were transfected with specific siRNAs against UAP1 (siUAP1) and GNPNAT1/GNA1 (siGNPNAT1), or siRNA negative control (siNC) at 40 nM, followed by treatment with 5 mM GlcN for 48 h. HBsAg and HBeAg secreted in culture supernatants and intracellular HBsAg were quantified by CMIA. O-GlcNAc, UAP1, and GNPNAT1 expression was analyzed by western blotting, using ACTB as a loading control. (C and D) HepG2.2.15 cells were treated with 5 mM GlcN for 48 h. (C) The cells were fixed, incubated with primary antibody horse anti-HBsAg and rabbit anti-LC3, followed by staining with Alexa Fluor 488-conjugated anti-rabbit and Alexa Fluor 594-conjugated anti-horse secondary antibody IgG, respectively. Finally, the cells were imaged by confocal microscopy. Scale bar: 5 μm. (D) LC3, SQSTM1, and HBcAg expression were analyzed by western blotting. LC3-II:ACTB ratios were determined by densitometry. (E) Huh7 cells were transfected with mCherry-GFP-LC3 plasmid and then treated with 5 mM GlcN for 24 h. Cells cultured with 10 µM chloroquine (CQ) for 24 h were used as a positive control. The expression of mCherry and GFP was determined by confocal microscopy. Scale bar: 5 μm. (F) HepG2.2.15 cells were treated as in (C), followed by incubation with 10 μg/ml DQ-BSA for 30 min. The accumulating fluorescent signal of DQ-BSA was analyzed by confocal microscopy. Cells treated with EBSS for 2 h were used as a positive control. Scale bar: 5 μm. S:CO, signal to cutoff ratio. *P < 0.05; **P < 0.01; ns, not significant.
Figure 3.
Figure 3.
GlcN suppresses autophagic degradation mediated by suppressing lysosomal acidification. (A) Huh7 cells were transfected with HBV plasmid pSM2, followed by treatment with 5 mM GlcN for 24 h. Cells treated with 5 µM CID1067700 (CID) for 24 h were used as a positive control. The cells were fixed, incubated with horse anti-HBsAg and rabbit anti-LAMP1 antibodies, and stained with Alexa Fluor 488-conjugated anti-rabbit and Alexa Fluor 594-conjugated anti-horse secondary antibody IgG, respectively. Colocalization of HBsAg and LC3 or LAMP1 was imaged by confocal microscopy. Scale bar: 5 μm. (B) HepG2.2.15 cells were treated with 5 mM GlcN for 24 h. The cells were stained with 100 nM LysoTracker Red or 1 μM LysoBeacon Green for 1 h. Cells treated with EBSS for 2 h were used as a positive control. The fluorescence intensity of LysoTracker Red or LysoBeacon Green was analyzed by confocal microscopy. Scale bar: 5 μm. (C) HepG2.2.15 cells were treated with 5 mM GlcN for 24 h. The cells were stained with acridine orange (AO) for 15 min. AO fluorescence was detected by confocal microscopy using a 488-nm (green) or a 561-nm (red) laser. Scale bar: 5 μm. (D) HepG2.2.15 cells were treated with 5 mM GlcN for 48 h. The levels of mature CTSD expression were analyzed by western blotting, using ACTB as a loading control. CTSD:ACTB ratios were quantified by densitometry. (EG) HepG2.2.15 cells were treated with 5 mM GlcN with or without 10 µM CQ for 24 h. (E) Transfected cells were imaged by confocal microscopy using LC3-specific antibody. Scale bar: 5 μm. (F) LC3, SQSTM1, and HBcAg expression were analyzed by western blotting, using ACTB as a loading control. LC3-II:ACTB ratios were quantified by densitometry. (G) HBsAg and HBeAg secreted in culture supernatants were analyzed by CMIA. S:CO, signal to cutoff ratio. *P < 0.05; **P < 0.01; ns, not significant.
Figure 4.
Figure 4.
GlcN promotes HBV replication by inhibiting lysosomal degradation through its amino group. (A and B) HepG2.2.15 cells were treated with 5 mM GlcN or N-Acetyl-d-glucosamine (Ace-GlcN) for 48 h, respectively. (C and D) PHHs with HBV virion infection (MOI = 30) were treated with 5 mM GlcN or Ace-GlcN for 48 h. (A and C) LC3, SQSTM1, and HBcAg expression were analyzed by western blotting, using ACTB as a loading control. LC3-II:ACTB ratios were quantified by densitometry. (B and D) HBsAg and HBeAg secreted in culture supernatants were analyzed by CMIA. S:CO, signal to cutoff ratio. *P < 0.05; **P < 0.01; ns, not significant.
Figure 5.
Figure 5.
GlcN promotes HBV replication by inducing autophagy via feedback inhibition of MTOR signaling. (A) HepG2.2.15 cells were treated with 5 mM GlcN and harvested at 0, 6, 12, 24, and 48 h after treatment. Western blot analysis was conducted to detect MTOR, p-MTOR, LC3, and SQSTM1 expression, using ACTB as a loading control. LC3-II:ACTB and p-MTOR:ACTB ratios were quantified by densitometry. (B and C) HepG2.2.15 cells were treated with 5 mM GlcN with or without 2 µM MTOR activator MHY1485 (MHY) for 48 h. (B) Cells were fixed, incubated with rabbit anti-LC3 antibodies, followed by staining with Alexa Fluor 488-conjugated anti-rabbit secondary antibody IgG. Finally, the cells were imaged by confocal microscopy. Scale bar: 5 μm. (C) HBsAg and HBeAg secreted in culture supernatants and intracellular HBsAg from cell lysates were analyzed by CMIA. (DE) HepG2.2.15 cells were transfected with specific siRNAs against RRAGA (siRRAGA) or siNC at 40 nM. After 24 h, the transfected cells were treated with 5 mM GlcN for 48 h. (D) RRAGA, MTOR, p-MTOR, LC3, and SQSTM1 expression were analyzed by western blotting. The LC3-II:ACTB and p-MTOR:ACTB ratios were quantified as described above. (E) HBsAg and HBeAg secreted in culture supernatants and intracellular HBsAg from cell lysates were analyzed as described above. S:CO, signal to cutoff ratio. *P < 0.05; **P < 0.01; ns, not significant. (F) A proposed model of how GlcN effectively promotes virus replication by inducing autophagic stress through its dual effects in suppressing autophagic degradation and inhibiting MTORC1 signaling pathway. On the one hand, GlcN blocks autophagic degradation by inhibiting lysosomal acidification through its amino group. On the other hand, GlcN further induces autophagosome formation via feedback inhibition of MTORC1 signaling in a RRAGA GTPase-dependent manner.
Figure 6.
Figure 6.
Glucosamine promotes HBV replication in an HBV HI mouse model. (A) C57BL/6 mice received HI with 10 µg of plasmid pAAV-HBV1.2. At 14 days after HI, the mice were treated with PBS or 50 mg/kg/d GlcN by intraperitoneal injection for 3 weeks. Mouse serum samples were collected at 0, 1, 2, and 3 weeks after GlcN treatment. (B) Serological markers of HBV infection HBsAg, and HBV DNA were assayed at the indicated time points. Serum HBsAg was analyzed by CMIA. Positivity for HBsAg was defined as ≥ 1*. (C) Serum HBV DNA was quantified by qPCR. (DF) Liver tissues were collected on day 21 after GlcN treatment. Two samples from each group were separately labeled with the indicated numbers and were used in further experiments. (D) Liver tissue sections were stained with an anti-HBc antibody (magnification, 200×). HBcAg-positive hepatocytes were counted. (E) HBV replicative intermediates were extracted and detected by Southern blotting. HBV DNA levels in the mouse liver were also measured by qPCR. (F) Western blot analysis was conducted to detect the MTOR, LC3, and SQSTM1 proteins, using ACTB as a loading control. LC3-II:ACTB ratios were quantified by densitometry. *P < 0.05; **P < 0.01; ns, not significant.
Figure 7.
Figure 7.
GlcN enhances IAV, EV71, and VSV replication in vitro. (AC) MDCK, RD, and Huh7 cells were treated with 10, 1, or 1 mM GlcN and harvested at 24 h after treatment. The levels of LC3 and SQSTM1 were detected by western blotting, using ACTB as a loading control. LC3-II:ACTB ratios were quantified by densitometry. (D) MDCK cells were infected with IAV (H3N2; MOI = 0.1) and treated with 10 mM GlcN for 24 h. The mRNA levels of the IAV NP gene were quantified by RT-qPCR. (E) RD cells were infected with EV71 (MOI = 1) and treated with 1 mM GlcN for 12 h before harvesting the cells. EV71 RNA levels were determined by RT-qPCR with EV71 VP1-specific primers. (F) Huh7 cells were infected with VSV (MOI = 1) and treated with 1 mM GlcN for 24 h. The culture medium was harvested, and the viral loads were determined by RT-qPCR with VSV-specific primers. *P < 0.05; **P < 0.01; ns, not significant. IAV, influenza A virus; EV71, enterovirus 71; VSV, vesicular stomatitis virus.

Similar articles

Cited by

References

    1. Skarbek K, Milewska MJ.. Biosynthetic and synthetic access to amino sugars. Carbohydr Res. 2016;434:44–71. - PubMed
    1. Reginster JY, Deroisy R, Rovati LC, et al. Long-term effects of glucosamine sulphate on osteoarthritis progression: a randomised, placebo-controlled clinical trial. Lancet. 2001;357:251–256. - PubMed
    1. Galvin R, Cousins G, Boland F, et al. Prescribing patterns of glucosamine in an older population: a national cohort study. BMC Complement Altern Med. 2013;13:316. - PMC - PubMed
    1. Zahedipour F, Dalirfardouei R, Karimi G, et al. Molecular mechanisms of anticancer effects of Glucosamine. Biomed Pharmacother. 2017;95:1051–1058. - PubMed
    1. Liu X, Machado GC, Eyles JP, et al. Dietary supplements for treating osteoarthritis: a systematic review and meta-analysis. Br J Sports Med. 2018;52:167–175. - PubMed

Publication types

MeSH terms

Substances