. 2020 Mar;16(3):531-547.
doi: 10.1080/15548627.2019.1630224. Epub 2019 Jun 23.

WDR45 contributes to neurodegeneration through regulation of ER homeostasis and neuronal death

Affiliations

WDR45 contributes to neurodegeneration through regulation of ER homeostasis and neuronal death

Huida Wan et al. Autophagy. 2020 Mar.

Abstract

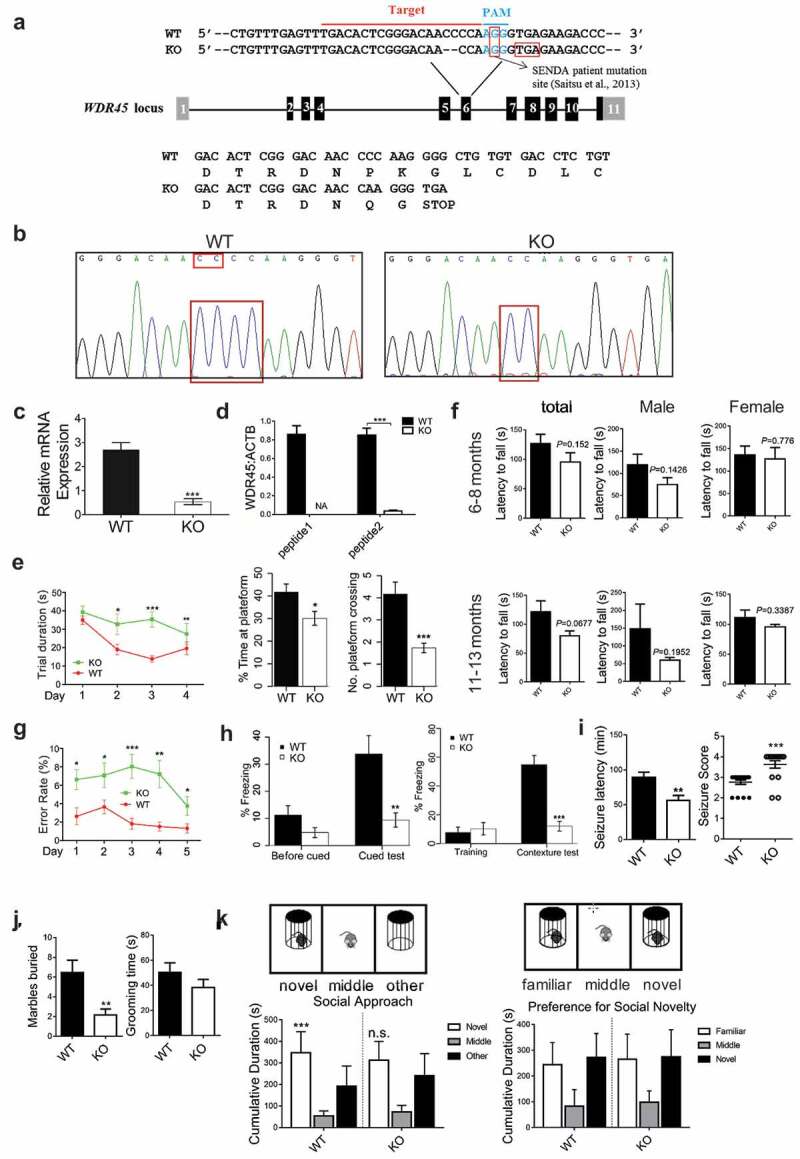
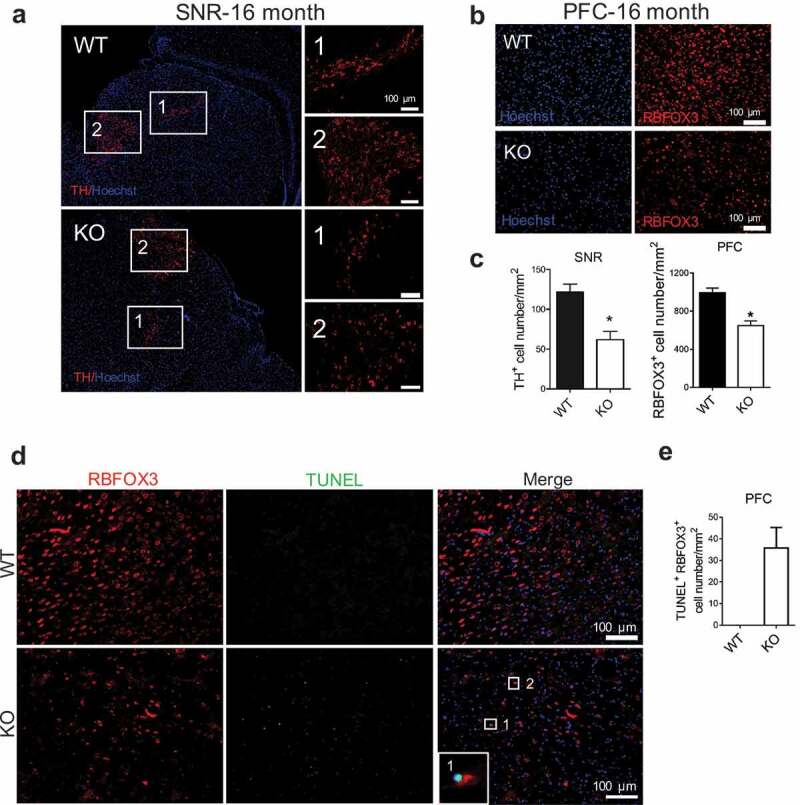
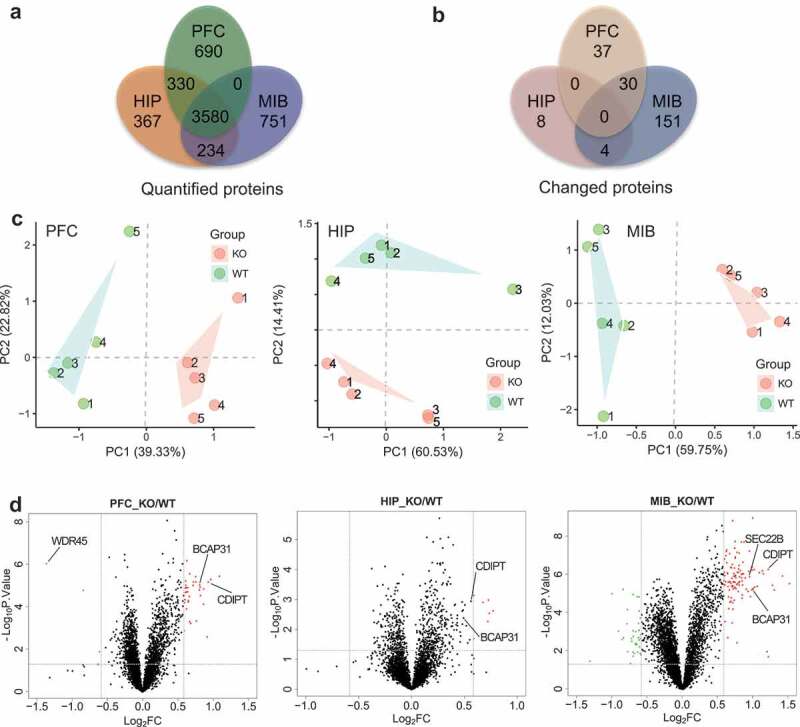
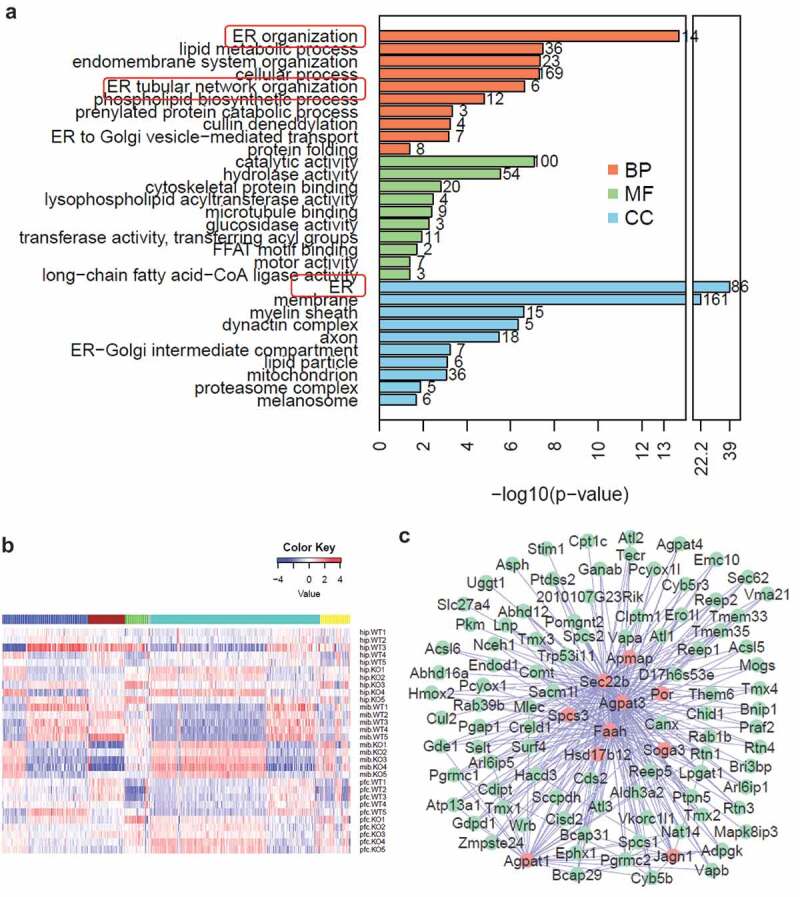
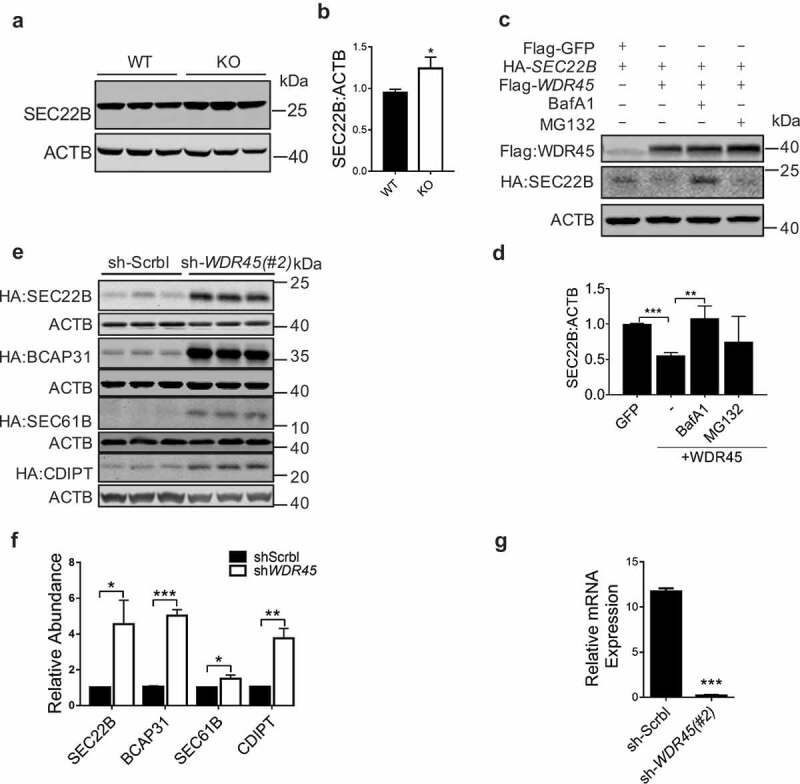
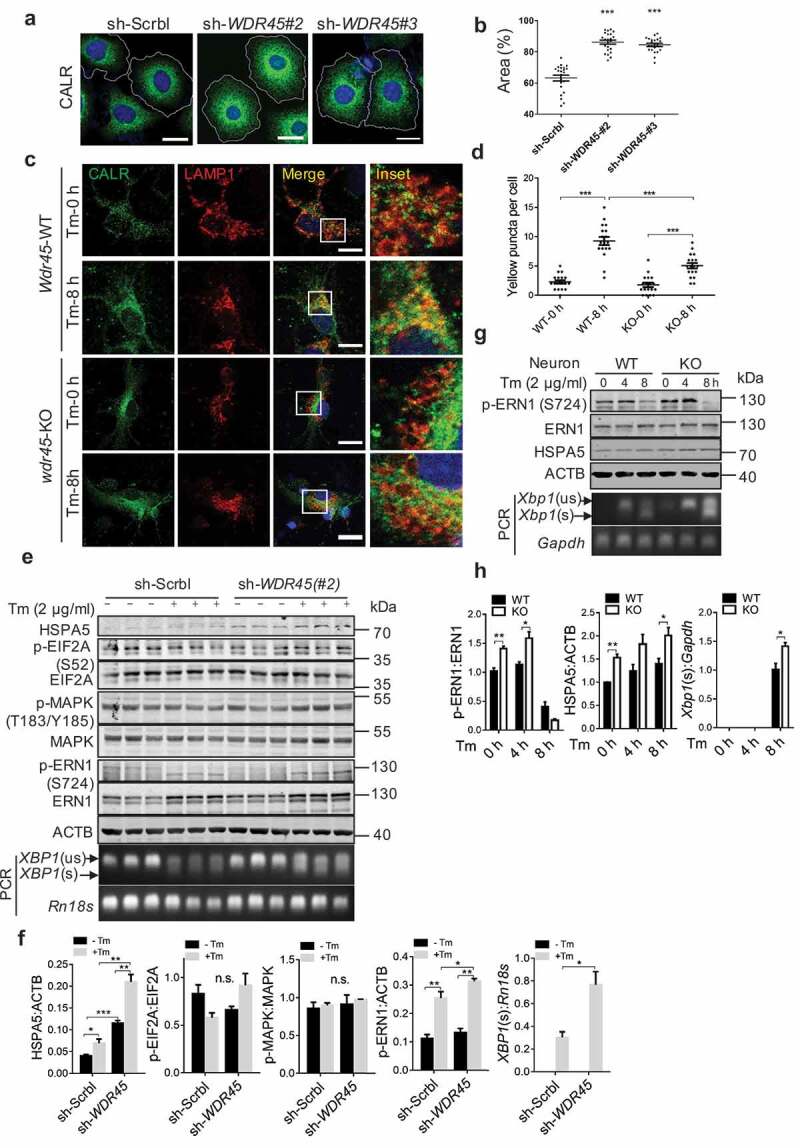
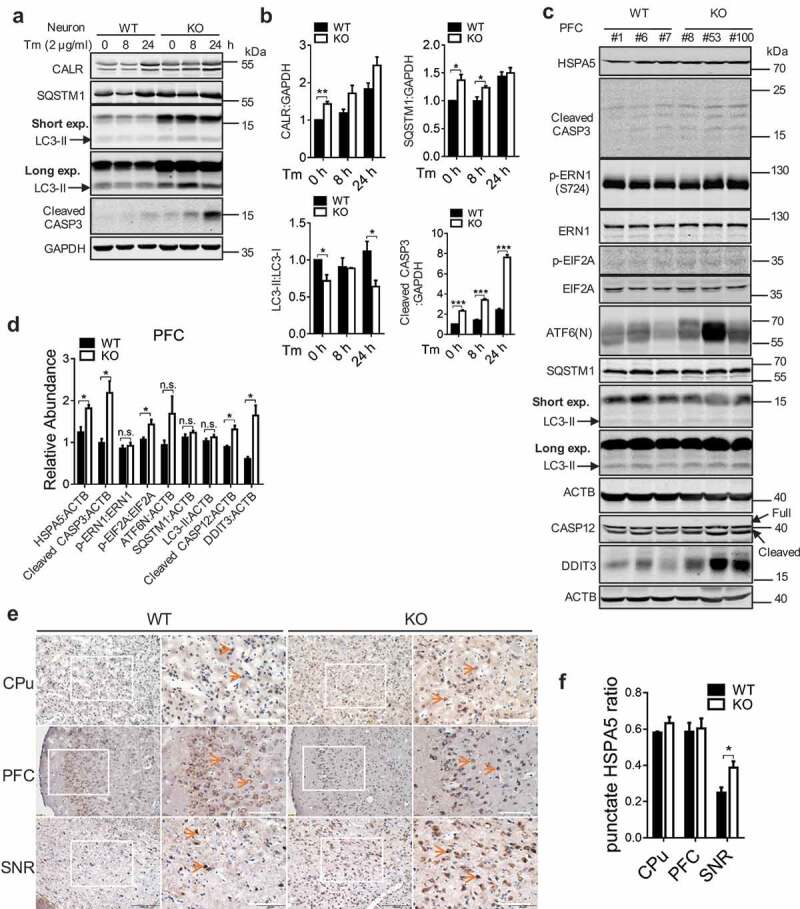
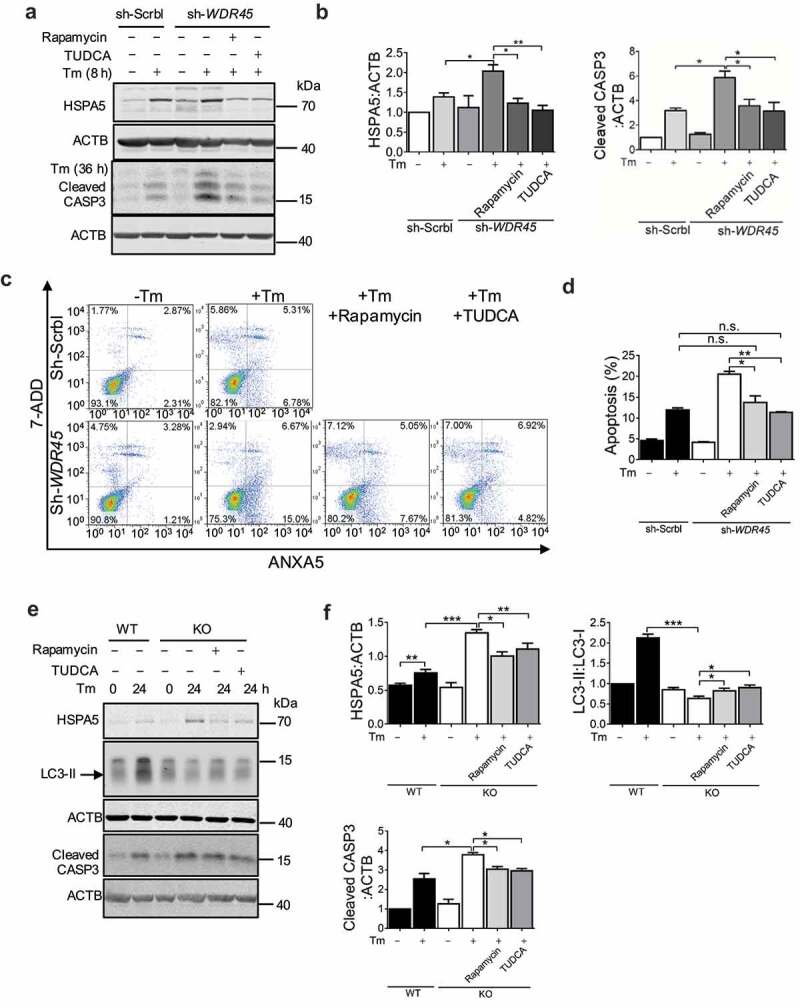
Mutations in the macroautophagy/autophagy gene WDR45 cause β-propeller protein-associated neurodegeneration (BPAN); however the molecular and cellular mechanism of the disease process is largely unknown. Here we generated constitutive wdr45 knockout (KO) mice that displayed cognitive impairments, abnormal synaptic transmission and lesions in several brain regions. Immunohistochemistry analysis showed loss of neurons in prefrontal cortex and basal ganglion in aged mice, and increased apoptosis in prefrontal cortex, recapitulating a hallmark of neurodegeneration. Quantitative proteomic analysis showed accumulation of endoplasmic reticulum (ER) proteins in KO mouse. At the cellular level, accumulation of ER proteins due to WDR45 deficiency resulted in increased ER stress and impaired ER quality control. The unfolded protein response (UPR) was elevated through ERN1/IRE1 or EIF2AK3/PERK pathway, and eventually led to neuronal apoptosis. Suppression of ER stress or activation of autophagy through MTOR inhibition alleviated cell death. Thus, the loss of WDR45 cripples macroautophagy machinery in neurons and leads to impairment in organelle autophagy, which provides a mechanistic understanding of cause of BPAN and a potential therapeutic strategy to treat this genetic disorder.Abbreviations: 7-ADD: 7-aminoactinomycin D; ASD: autistic spectrum disorder; ATF6: activating transcription factor 6; ATG: autophagy-related; BafA1: bafilomycin A1; BCAP31: B cell receptor associated protein 31; BPAN: β-propeller protein-associated neurodegeneration; CCCP: carbonyl cyanide m-chlorophenylhydrazone; CDIPT: CDP-diacylglycerol-inositol 3-phosphatidyltransferase (phosphatidylinositol synthase); DDIT3/CHOP: DNA-damage inducible transcript 3; EIF2A: eukaryotic translation initiation factor 2A; EIF2AK3/PERK: eukaryotic translation initiation factor 2 alpha kinase 3; ER: endoplasmic reticulum; ERN1/IRE1: endoplasmic reticulum to nucleus signaling 1; GFP: green fluorescent protein; HIP: hippocampus; HSPA5/GRP78: heat shock protein family A (HSP70) member 5; KO: knockout; LAMP1: lysosomal-associated membrane 1; mEPSCs: miniature excitatory postsynaptic currents; MG132: N-benzyloxycarbonyl-L-leucyl-L-leucyl-L-leucinal; MIB: mid-brain; MTOR: mechanistic target of rapamycin kinase; PCR: polymerase chain reaction; PFA: paraformaldehyde; PFC: prefrontal cortex; PRM: parallel reaction monitoring; RBFOX3/NEUN: RNA binding protein, fox-1 homolog [C. elegans] 3; RTN3: reticulon 3; SEC22B: SEC22 homolog B, vesicle trafficking protein; SEC61B: SEC61 translocon beta subunit; SEM: standard error of the mean; SNR: substantia nigra; SQSTM1/p62: sequestosome 1; TH: tyrosine hydroxylase; Tm: tunicamycin; TMT: tandem mass tag; TUDCA: tauroursodeoxycholic acid; TUNEL: terminal deoxynucleotidyl transferase dUTP nick-end labeling; UPR: unfolded protein response; WDR45: WD repeat domain 45; WT: wild type; XBP1: X-box binding protein 1.

Keywords: ER stress; UPR; WDR45; neuronal apoptosis; quantitative proteomics.


Figures

Figure 1.
Figure 1.
wdr45 knockout (KO) mice show cognitive impairments. (a) Generation of wdr45 KO mouse by deleting a CC dinucleotide at the exon 6 of Wdr45 gene. (b) DNA sequencing validation of the targeted sequence in WT and KO mouse. (c) Real-time PCR quantification of mRNA expression in WT (n = 3) and KO (n = 3) mice. (d) Protein expression quantified by parallel reaction monitoring (PRM) mass spectrometry of WDR45 peptides (peptide1:YVFTPDGNCNR, peptide2:SNLLALVGGGSSPK). NA, not available. (e) Morris water maze test of the trial period (left, P < 0.01, P = 0.006 and P < 0.001 on day 2, 3 and 4, respectively. WT: n = 16, KO; n = 16. All males), time spent at the platform and times of platform crossing (right bar graphs, P = 0.017 and P < 0.001 respectively). (f) Rotarod test showing the latency to fall at 6–8 and 11–13 month of age (WT: n = 10, 5 males, 5 females; KO: n = 10, 6 males, 4 females). (g) An 8-arm maze showing the error rate (*P < 0.05, **P < 0.001, ***P < 0.001. WT: n = 15, KO: n = 17, all males). (h) Freezing response to the shock in the cued test (left, P = 0.0023) and the contexture test (right, P < 0.001), compared to WT mice (n = 16 for both WT and KO, all males). (i) Seizure latency and severity in mice of 2 month old after pilocarpine administration (30 mg/kg) are shown (WT: n = 17, 10 males, 7 females; KO: n = 16, 8 males, 8 females). (j) Repetitive self-grooming and marble burying behavior were measured in mice of 2 month old (WT: n = 13, 8 males, 5 females; KO: n = 14, 7 males, 7 females). (k) Social approach test, WT mice spent significantly more time with novel conspecific compared to an empty test cage and no preference for novel conspecific was found for KO mice (WT: n = 13, 8 males, 5 females; KO: n = 14, 7 males, 7 females). Data shown are Mean ± SEM, P values: *P < 0.05, **P < 0.01, ***P < 0.001.
Figure 2.
Figure 2.
wdr45 KO mice show neuron loss in SNR and PFC at old age. (a and b) Immunofluorescence staining of brain sections from WT and KO mouse at 16 months of age. Scale bar: 100 μm. (c) Statistical analysis of TH-positive cells in SNR (a) and RBFOX3 positive cells in PFC (b), respectively. (d) TUNEL staining of brain sections from WT and KO mouse PFC at 16 months of age. (e) Statistical analysis of TUNEL positive- RBFOX3 positive cell number in PFC (d). Data were expressed as mean ± SEM (n = 3) and analyzed by two-tailed unpaired t-test. P values: * P < 0.05. PFC: prefrontal cortex, SNR: substantia nigra. Three mice brains per group and 3 sections per brain were used for quantification.
Figure 3.
Figure 3.
Quantitative proteomic analysis of brain regions from WT and KO mouse. (a) TMT-based mass spectrometry quantification of proteins in PFC, HIP, and MIB (n = 5, male, 6 months). (b) Significantly changed proteins in the three regions (P < 0.05 after Benjamini Hochberg correction, and fold change≥1.5). (c) Principal component analysis of proteins quantified in the three brain regions. (d) Volcano plots of quantified proteins in PFC, HIP and MIB, respectively. PFC: prefrontal cortex, HIP: hippocampus, MIB: mid-brain.
Figure 4.
Figure 4.
Bioinformatic analysis reveals accumulation of ER proteins in wdr45 KO mice. (a) Top ten significantly enriched gene ontology terms in biological process (BP, brown), molecular function (MF, green) and cellular component (CC, blue). (b) WGCNA of proteins quantified in the three brain regions separates the proteins into five distinct co-expressed modules. Color key represents log2-transformed intensity values of each protein. (c) Protein-protein interaction network of the proteins in green module, with red representing hub proteins that have the most network connectivity.
Figure 5.
Figure 5.
WDR45 mediates degradation of target ER proteins. (a and b) Western blot detection of endogenous SEC22B in mid-brain. Protein abundance was quantified in (b). (c and d) Co-expression of WDR45 and SEC22B in HeLa cells and protein levels were examined by western blot. Some groups of cells were treated with MG132 (20 μM, 12 h) or BafA1 (50 nM, 8 h), respectively. Protein abundances were quantified in (d). (e and f) Stability of exogenously expressed SEC22B, BCAP31, SEC61B and CDIPT in HeLa cells with WDR45 stably knocked down. Bar graph (f) shows statistics of protein expression levels. (g) Real-time PCR quantification of WDR45 mRNA in stable cell lines (#2). Data were expressed as mean ± SEM (n = 3). P values: *P < 0.05, **P < 0.01, ***P < 0.001.
Figure 6.
Figure 6.
WDR45-deficient cells display increased ER stress and ER area. (a) Representative confocal images of immunofluorescence labeled CALR, an ER resident protein, in HeLa cells. Scale bar: 20 μm. (b) Quantification of ER area, each dot in the graph represents one cell, n = 30. ***P<0.001, unpaired t test. (c) Immunofluorescence double labeling of CALR and LAMP1 in primary cortical neurons and imaged by confocal microscopy. Tm, 2 μg/ml, 8 h. Scale bar: 20 μm. (d) Yellow puncta in lysosome (c) was quantified. Each dot in the graph represents one cell, n = 18. (e and f) HeLa cells, (g and h), primary cortical neurons were treated with Tm, blotted with antibodies in the ER stress pathway. Data were expressed as mean ± SEM (n = 3). **P < 0.05, **P < 0.01, ***P < 0.001. n.s., not significant.
Figure 7.
Figure 7.
Loss of WDR45 results in increased cell death associated with ER stress. (a) Western blot analysis of CASP3 and autophagy proteins after Tm treatment in WT and KO primary neurons. (b) Bar graph shows statistical analysis of western blot data shown in (a). (c) Western blot analysis of CASP3, ER stress markers and autophagy proteins in the PFC from WT and KO mouse at 18–20 months of age. ‘Short’ and ‘long’ refer to the exposure time. (d) Statistical analysis of (c). (e) Immunohistochemistry of HSPA5 in mouse substantia nigra (SNR), prefrontal cortex (PFC), and caudate putamen (CPu) at 8 months of age. (f) Statistical analysis of (e), n = 3 per group and 3 sections per brain were used for quantification. Data were expressed as mean ± SEM (n = 3) and analyzed by two-tailed unpaired t-test. *P < 0.05, **P < 0.01, *** P < 0.001. n.s., not significant.
Figure 8.
Figure 8.
Activation of autophagy or inhibition of UPR rescues abnormal protein processing and increased cell death in WDR45-deficient cells. (a and b) Western blot analysis of endogenous HSPA5 and CASP3 levels after rapamycin (100 nM, 24 h) or TUDCA (100 μM, 24 h) treatment in HeLa cells with or without ER stress. (c and d) Flow cytometry analysis of apoptosis (ANXA5+ 7ADD and ANXA5+ 7ADD+) in WDR45-deficient HeLa cells after inducing ER stress (2 μg/ml Tm, 36 h). (e and f) Effects of rapamycin or TUDCA on HSPA5 accumulation (2 μg/ml Tm, for 8 h), CASP3 cleavage (2 μg/ml Tm, 24 h), and LC3-II production, in mouse neurons after inducing ER stress. Data were expressed as mean ± SEM (n = 3). *P < 0.05, **P < 0.01, *** P < 0.001. n.s., not significant.w.

References

    1. Choi AMK, Ryter SW, Levine B.. Autophagy in human health and disease. N Engl J Med. 2013;368(7):651–662. - PubMed
    1. Hara T, Nakamura K, Matsui M, et al. Suppression of basal autophagy in neural cells causes neurodegenerative disease in mice. Nature. 2006. 04/19/online;441:885. - PubMed
    1. Komatsu M, Waguri S, Chiba T, et al. Loss of autophagy in the central nervous system causes neurodegeneration in mice. Nature. 2006. 04/19/online;441:880. - PubMed
    1. Menzies FM, Fleming A, Caricasole A, et al. Autophagy and neurodegeneration: pathogenic mechanisms and therapeutic opportunities. Neuron. 2017;93(5):1015–1034. - PubMed
    1. Menzies FM, Fleming A, Rubinsztein DC. Compromised autophagy and neurodegenerative diseases [Review Article]. Nat Rev Neurosci. 2015. 05/20/online;16:345. - PubMed

Publication types

MeSH terms

Substances