

Microsecond Blinking Events in the Fluorescence of Colloidal Quantum Dots Revealed by Correlation Analysis on Preselected Photons
- PMID: 31204809
- PMCID: PMC6614792
- DOI: 10.1021/acs.jpclett.9b01348
Microsecond Blinking Events in the Fluorescence of Colloidal Quantum Dots Revealed by Correlation Analysis on Preselected Photons
Abstract
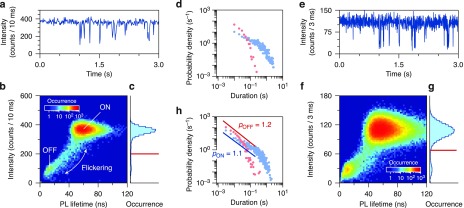
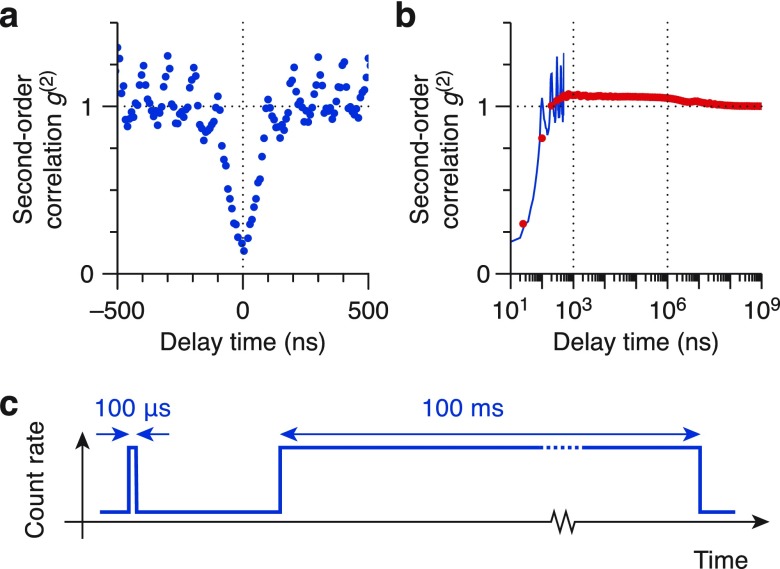
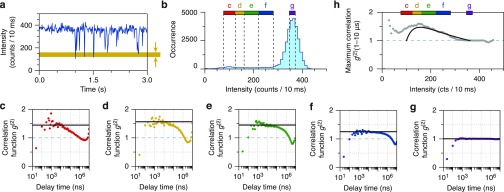
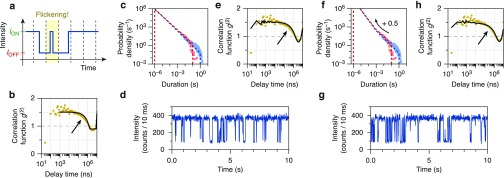
Nearly all colloidal quantum dots, when measured at the single-emitter level, exhibit fluorescence "blinking". However, despite over 20 years of research on this phenomenon, its microscopic origins are still debated. One reason is a gap in available experimental information, specifically for dynamics at short (submillisecond) time scales. Here, we use photon-correlation analysis to investigate microsecond blinking events in individual quantum dots. While the strongly distributed kinetics of blinking normally makes such events difficult to study, we show that they can be analyzed by excluding photons emitted during long bright or dark periods. Moreover, we find that submillisecond blinking events are more common than one might expect from extrapolating the power-law blinking statistics observed on longer (millisecond) time scales. This result provides important experimental data for developing a microscopic understanding of blinking. More generally, our method offers a simple strategy for analyzing microsecond switching dynamics in the fluorescence of quantum emitters.
Conflict of interest statement
The authors declare no competing financial interest.
Figures
Similar articles
-
Autocorrelation analysis for the unbiased determination of power-law exponents in single-quantum-dot blinking.ACS Nano. 2015 Jan 27;9(1):886-93. doi: 10.1021/nn506598t. Epub 2015 Jan 8. ACS Nano. 2015. PMID: 25549009
-
A guide to accurate measurement of diffusion using fluorescence correlation techniques with blinking quantum dot nanoparticle labels.J Chem Phys. 2008 Jun 14;128(22):225105. doi: 10.1063/1.2918273. J Chem Phys. 2008. PMID: 18554062
-
Robustness of quantum dot power-law blinking.Nano Lett. 2011 May 11;11(5):2137-41. doi: 10.1021/nl200782v. Epub 2011 Apr 18. Nano Lett. 2011. PMID: 21500822
-
Insights on heterogeneity in blinking mechanisms and non-ergodicity using sub-ensemble statistical analysis of single quantum-dots.J Chem Phys. 2019 Aug 28;151(8):084701. doi: 10.1063/1.5095870. J Chem Phys. 2019. PMID: 31470698
-
Evidence for a diffusion-controlled mechanism for fluorescence blinking of colloidal quantum dots.Proc Natl Acad Sci U S A. 2007 Sep 4;104(36):14249-54. doi: 10.1073/pnas.0706164104. Epub 2007 Aug 24. Proc Natl Acad Sci U S A. 2007. PMID: 17720807 Free PMC article.
Cited by
-
Biexciton Blinking in CdSe-Based Quantum Dots.J Phys Chem Lett. 2023 Jun 15;14(23):5353-5361. doi: 10.1021/acs.jpclett.3c00437. Epub 2023 Jun 5. J Phys Chem Lett. 2023. PMID: 37276380 Free PMC article.
-
Cd3P2/Zn3P2 Core-Shell Nanocrystals: Synthesis and Optical Properties.Nanomaterials (Basel). 2022 Sep 27;12(19):3364. doi: 10.3390/nano12193364. Nanomaterials (Basel). 2022. PMID: 36234492 Free PMC article.
-
Single Trap States in Single CdSe Nanoplatelets.ACS Nano. 2021 Apr 27;15(4):7216-7225. doi: 10.1021/acsnano.1c00481. Epub 2021 Mar 24. ACS Nano. 2021. PMID: 33759503 Free PMC article.
-
Bright Single-Photon Emitters with a CdSe Quantum Dot and Multimode Tapered Nanoantenna for the Visible Spectral Range.Nanomaterials (Basel). 2021 Apr 3;11(4):916. doi: 10.3390/nano11040916. Nanomaterials (Basel). 2021. PMID: 33916804 Free PMC article.
-
Room-Temperature, Highly Pure Single-Photon Sources from All-Inorganic Lead Halide Perovskite Quantum Dots.Nano Lett. 2022 May 11;22(9):3751-3760. doi: 10.1021/acs.nanolett.2c00756. Epub 2022 Apr 25. Nano Lett. 2022. PMID: 35467890 Free PMC article.
References
-
- Murray C. B.; Norris D. J.; Bawendi M. G. Synthesis and Characterization of Nearly Monodisperse CdE (E = S, Se, Te) Semiconductor Nanocrystallites. J. Am. Chem. Soc. 1993, 115, 8706–8715. 10.1021/ja00072a025. - DOI
-
- Hines M. A.; Guyot-Sionnest P. Synthesis and Characterization of Strongly Luminescing ZnS-Capped CdSe Nanocrystals. J. Phys. Chem. 1996, 100, 468–471. 10.1021/jp9530562. - DOI
-
- Chen O.; Zhao J.; Chauhan V. P.; Cui J.; Wong C.; Harris D. K.; Wei H.; Han H. S.; Fukumura D.; Jain R. K.; Bawendi M. G. Compact High-Quality CdSe-CdS Core-Shell Nanocrystals with Narrow Emission Linewidths and Suppressed Blinking. Nat. Mater. 2013, 12, 445–451. 10.1038/nmat3539. - DOI - PMC - PubMed
LinkOut - more resources
Full Text Sources
Miscellaneous
