. 2019 Jun 6;123(22):13458-13466.
doi: 10.1021/acs.jpcc.9b02371. Epub 2019 May 5.

Removal of Surface Oxygen Vacancies Increases Conductance Through TiO2 Thin Films for Perovskite Solar Cells

Affiliations

Removal of Surface Oxygen Vacancies Increases Conductance Through TiO2 Thin Films for Perovskite Solar Cells

Alexander Klasen et al. J Phys Chem C Nanomater Interfaces. .

Abstract

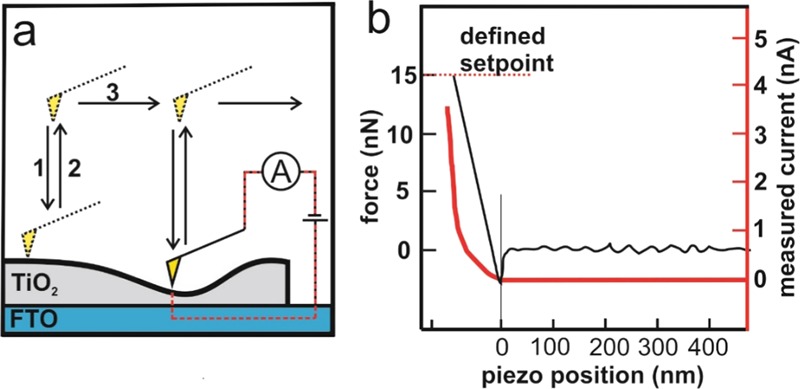
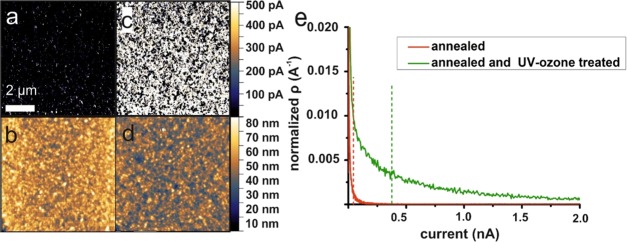
We report that UV-ozone treatment of TiO2 anatase thin films is an efficient method to increase the conductance through the film by more than 2 orders of magnitude. The increase in conductance is quantified via conductive scanning force microscopy on freshly annealed and UV-ozone-treated TiO2 anatase thin films on fluorine-doped tin oxide substrates. The increased conductance of TiO2 anatase thin films results in a 2% increase of the average power conversion efficiency (PCE) of methylammonium lead iodide-based perovskite solar cells. PCE values up to 19.5% for mesoporous solar cells are realized. The additional UV-ozone treatment results in a reduced number of oxygen vacancies at the surface, inferred from X-ray photoelectron spectroscopy. These oxygen vacancies at the surface act as charge carrier traps and hinder charge extraction from the adjacent material. Terahertz measurements indicate only minor changes of the bulk conductance, which underlines the importance of UV-ozone treatment to control surface-based defects.


Conflict of interest statement

The authors declare no competing financial interest.

Figures

Figure 1
Figure 1
(a) Working principle of the quantitative imaging peak fore-cSFM mode: for each pixel, a single force–distance curve is measured, consisting of an extension (1) and retraction curve (2), before the tip moves to the next pixel (3). A current image is compiled from the maximum current during the extension curves. (b) Exemplary force–distance curve with the respective current curve (red) for a high conducting pixel of an annealed and UV–ozone-treated TiO2 thin film on FTO. In this particular example, a maximum current of 3.6 nA was measured.
Figure 2
Figure 2
(a) Current image and (b) height image of cSFM measurement on the TiO2 thin film without UV–ozone treatment. (c) Current and height image (d) after 30 min of UV–ozone treatment. To visualize local current differences more clearly, we set the current scale to a value of 500 pA. (e) Current distributions before (red data points) and after 30 min UV–ozone treatment (green data points).
Figure 3
Figure 3
Normalized local IV-curves of an annealed and UV–ozone-treated TiO2 film on FTO. Measurements were conducted starting at an initial bias of +1.5 V, which was increased stepwise to 0 V and then inverted up to −1.5 V (black curve). Subsequently, the bias was reduced stepwise again to 0 V and inverted up to 1.5 V (red curve). Please note that for every image a new area of 256 × 256 pixels was measured to avoid any potential influence of previous measurements. This set of measurement took approximately 1 h.
Figure 4
Figure 4
Development of median current over time for a freshly prepared and UV ozone treated TiO2 film.
Figure 5
Figure 5
Distribution of cell efficiency without UV–ozone and with UV–ozone treatment.
Figure 6
Figure 6
Effect of UV–ozone treatment on the number of surface oxygen vacancies. The measured signals (black curves) were fitted with three Gaussian/Lorentzian curves. The red curves correspond to oxygen bound to coordinatively saturated titanium atoms. The blue curves correspond to oxygen that is bound to partly unsaturated titanium atoms. The green curves correspond to oxygen in −OH groups and adsorbed CO2. (a) annealed sample, (b) annealed and UV–ozone treated, (c) annealed after 24 h.
Figure 7
Figure 7
Influence of UV–ozone treatment on optical conductance of a TiO2 thin film on quartz glass.

References

    1. Fathil M. F. M.; Adzhri R.; Arshad M. K. M.; Hashim U.; Ruslinda A. R.; Ayub R. M.; Nuzaihan M. N. M.; Azman A. H.; Zaki M. In Preparation and Characterization of Titanium Dioxide Thin Film for Field-Effect Transistor Biosensor Application, 2015 2nd International Conference on Biomedical Engineering (ICoBE), 2015; pp 30–31.
    1. Hu S.; Shaner M. R.; Beardslee J. A.; Lichterman M.; Brunschwig B. S.; Lewis N. S. Amorphous TiO2 Coatings Stabilize Si, GaAs, and GaP Photoanodes for Efficient Water Oxidation. Science 2014, 344, 1005–1009. 10.1126/science.1251428. - DOI - PubMed
    1. Li M.; Li X.; Li W.; Meng X.; Yu Y.; Sun X. Atomic Layer Deposition Derived Amorphous TiO2 Thin Film Decorating Graphene Nanosheets with Superior Rate Capability. Electrochem. Commun. 2015, 57, 43–47. 10.1016/j.elecom.2015.05.005. - DOI
    1. Dongale T. D.; Shinde S. S.; Kamat R. K.; Rajpure K. Y. Nanostructured TiO2 Thin Film Memristor Using Hydrothermal Process. J. Alloys Compd. 2014, 593, 267–270. 10.1016/j.jallcom.2014.01.093. - DOI
    1. Yu J.; Zhao X.; Zhao Q. Effect of Surface Structure on Photocatalytic Activity of TiO2 Thin Films Prepared by Sol-Gel Method. Thin Solid Films 2000, 379, 7–14. 10.1016/S0040-6090(00)01542-X. - DOI