

Circulating CD3+HLA-DR+ Extracellular Vesicles as a Marker for Th1/Tc1-Type Immune Responses
- PMID: 31205958
- PMCID: PMC6530242
- DOI: 10.1155/2019/6720819
Circulating CD3+HLA-DR+ Extracellular Vesicles as a Marker for Th1/Tc1-Type Immune Responses
Abstract
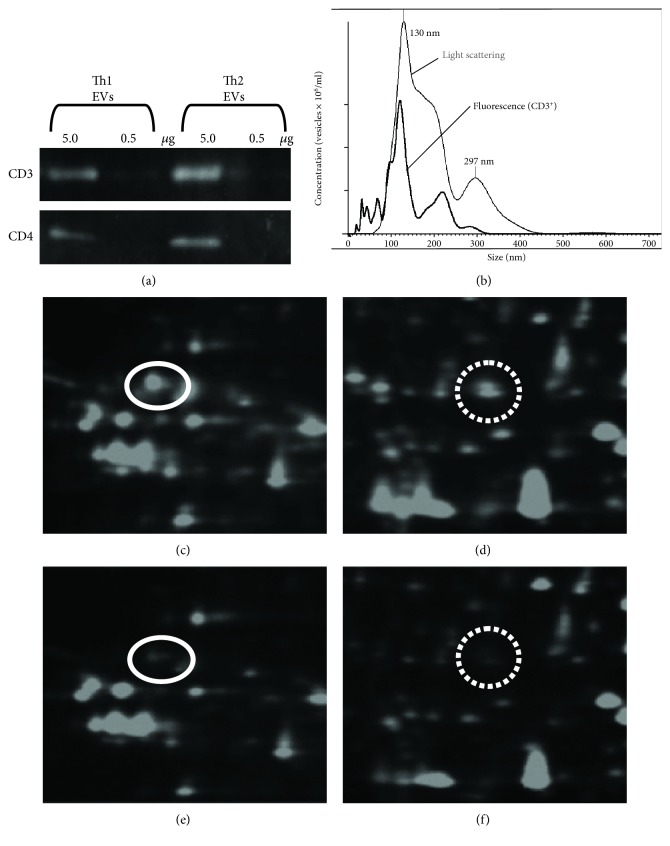
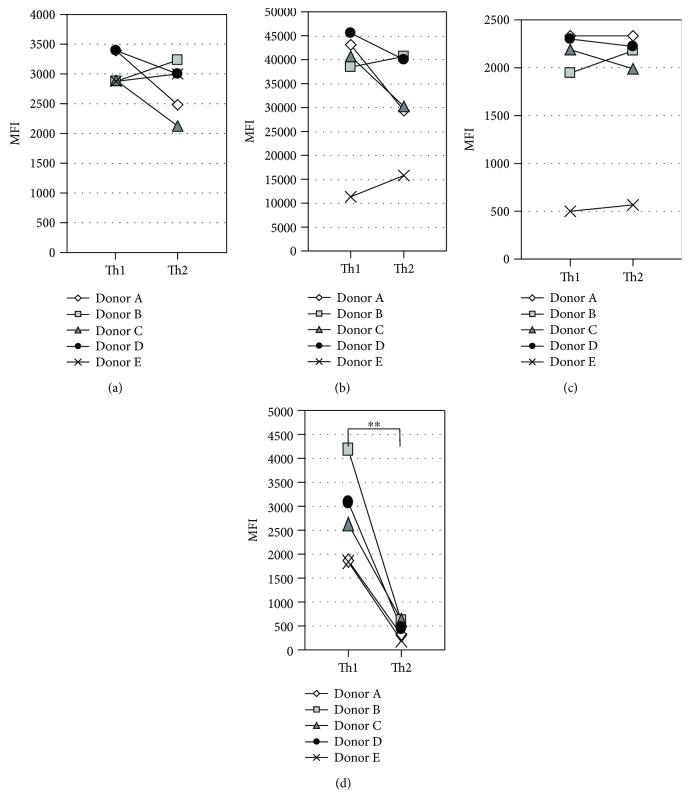
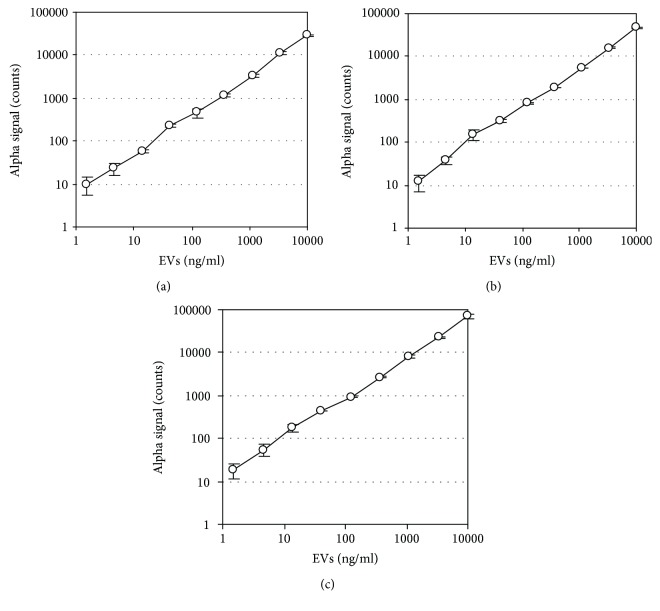
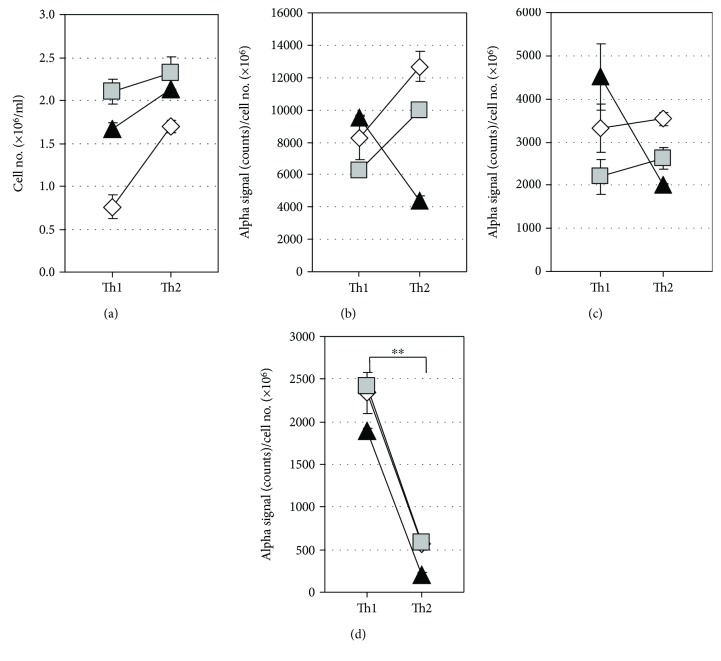
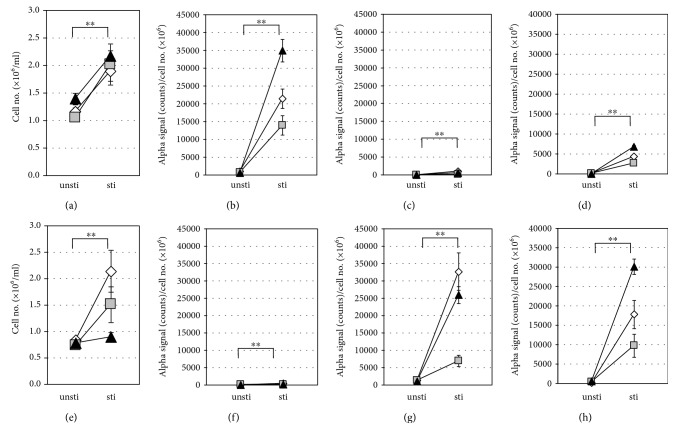
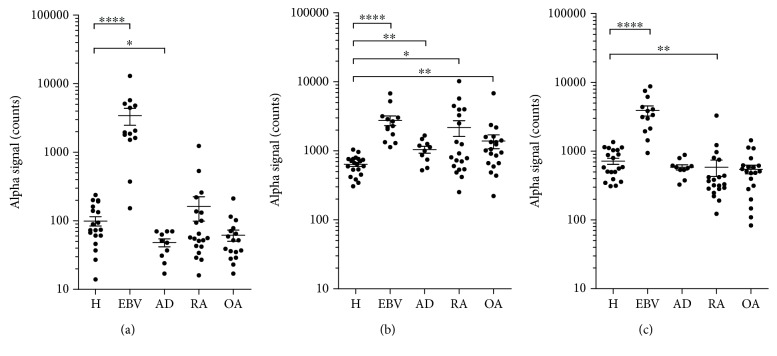
Extracellular vesicles (EVs) are known to contain unique proteins that reflect the cells of origins. Activated T cells are reported to secrete various EVs. To establish T cell subset-specific biomarkers, we performed proteomic analysis with Th1- and Th2-derived EVs and identified HLA-DR as a Th1-dominated EV membrane protein. We designed a measurement system for CD3+CD4+, CD3+CD8+, and CD3+HLA-DR+ EVs to specifically determine EV subpopulations derived from CD4+, CD8+, and Th1-type T cells, respectively. In vitro analysis showed that CD3+CD4+ EVs and CD3+CD8+ EVs were selectively secreted from activated CD4+ and CD8+ T cells, respectively, and that CD3+HLA-DR+ EVs were actively secreted from not only Th1 but also activated CD8+ T (probably mostly Tc1) cells. To evaluate the clinical usefulness of these EVs, we measured the serum levels in patients with inflammatory diseases, including Epstein-Barr virus (EBV, n = 13) infection, atopic dermatitis (AD, n = 10), rheumatoid arthritis (RA, n = 20), and osteoarthritis (OA, n = 20) and compared the levels with those of healthy adults (n = 20). CD3 + CD4 + EVs were significantly higher in all of EBV infection, AD, RA, and OA while CD3+CD8+ EVs were higher in EBV infection, lower in RA, and not different in AD and OA relative to the control. The levels of CD3+HLA-DR+ EVs were markedly higher in EBV infection and significantly lower in AD. The results suggest that these EV subpopulations reflect in vivo activation status of total CD4+, total CD8+, and Th1/Tc1-type T cells, respectively, and may be helpful in T cell-related clinical settings, such as cancer immunotherapy and treatment of chronic infection, autoimmune diseases, and graft-versus-host disease.
Figures
Similar articles
-
Utility of novel T-cell-specific extracellular vesicles in monitoring and evaluation of acute GVHD.Int J Hematol. 2021 Jun;113(6):910-920. doi: 10.1007/s12185-021-03113-x. Epub 2021 Mar 8. Int J Hematol. 2021. PMID: 33683652 Clinical Trial.
-
Early pediatric atopic dermatitis shows only a cutaneous lymphocyte antigen (CLA)(+) TH2/TH1 cell imbalance, whereas adults acquire CLA(+) TH22/TC22 cell subsets.J Allergy Clin Immunol. 2015 Oct;136(4):941-951.e3. doi: 10.1016/j.jaci.2015.05.049. Epub 2015 Aug 1. J Allergy Clin Immunol. 2015. PMID: 26242300 Free PMC article.
-
[An analysis of immunophenotyping of peripheral lymphocytes in adult patients with infectious mononucleosis and chronic active Epstein-Barr virus infection].Zhonghua Nei Ke Za Zhi. 2016 Jun;55(6):455-9. doi: 10.3760/cma.j.issn.0578-1426.2016.06.011. Zhonghua Nei Ke Za Zhi. 2016. PMID: 27256608 Chinese.
-
Circulating extracellular vesicles and rheumatoid arthritis: a proteomic analysis.Cell Mol Life Sci. 2021 Dec 31;79(1):25. doi: 10.1007/s00018-021-04020-4. Cell Mol Life Sci. 2021. PMID: 34971426 Free PMC article. Review.
-
The Role of Extracellular Vesicles in the Pathogenesis and Treatment of Rheumatoid Arthritis and Osteoarthritis.Cells. 2023 Nov 27;12(23):2716. doi: 10.3390/cells12232716. Cells. 2023. PMID: 38067147 Free PMC article. Review.
Cited by
-
Extracellular Vesicles and Their Potential Significance in the Pathogenesis and Treatment of Osteoarthritis.Pharmaceuticals (Basel). 2021 Apr 1;14(4):315. doi: 10.3390/ph14040315. Pharmaceuticals (Basel). 2021. PMID: 33915903 Free PMC article. Review.
-
Plasma-derived extracellular vesicle surface markers CD45, CD326 and CD56 correlate with the stage of osteoarthritis: a primary study of a novel and promising diagnostic tool of the disease.Sci Rep. 2023 Nov 16;13(1):20071. doi: 10.1038/s41598-023-47074-z. Sci Rep. 2023. PMID: 37973964 Free PMC article.
-
The role of extracellular vesicles in rheumatoid arthritis: a systematic review.Clin Rheumatol. 2021 Sep;40(9):3481-3497. doi: 10.1007/s10067-021-05614-w. Epub 2021 Feb 5. Clin Rheumatol. 2021. PMID: 33544235 Free PMC article.
-
T cell-derived small extracellular vesicles in cancer-immune interactions.Cancer Immunol Immunother. 2025 Jun 25;74(8):252. doi: 10.1007/s00262-025-04109-w. Cancer Immunol Immunother. 2025. PMID: 40560407 Free PMC article. Review.
-
Tetraspanin profiles of serum extracellular vesicles reflect functional limitations and pain perception in knee osteoarthritis.Arthritis Res Ther. 2024 Jan 22;26(1):33. doi: 10.1186/s13075-023-03234-0. Arthritis Res Ther. 2024. PMID: 38254142 Free PMC article.
References
MeSH terms
Substances
LinkOut - more resources
Full Text Sources
Medical
Research Materials
