. 2019 Jun 17;15(6):e1008129.
doi: 10.1371/journal.pgen.1008129. eCollection 2019 Jun.

Regulation of ectopic heterochromatin-mediated epigenetic diversification by the JmjC family protein Epe1

Affiliations

Regulation of ectopic heterochromatin-mediated epigenetic diversification by the JmjC family protein Epe1

Masato Sorida et al. PLoS Genet. .

Abstract

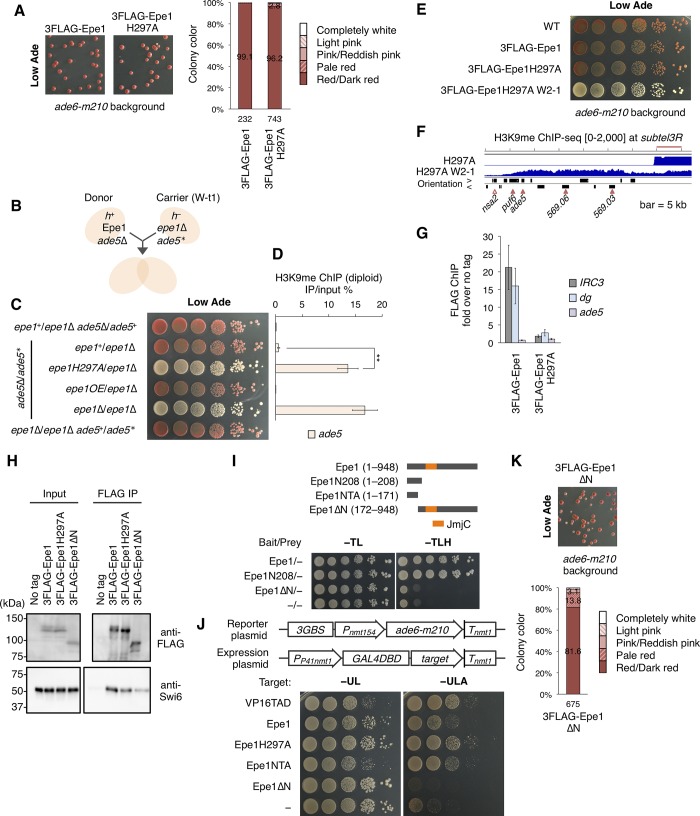
H3K9 methylation (H3K9me) is a conserved marker of heterochromatin, a transcriptionally silent chromatin structure. Knowledge of the mechanisms for regulating heterochromatin distribution is limited. The fission yeast JmjC domain-containing protein Epe1 localizes to heterochromatin mainly through its interaction with Swi6, a homologue of heterochromatin protein 1 (HP1), and directs JmjC-mediated H3K9me demethylation in vivo. Here, we found that loss of epe1 (epe1Δ) induced a red-white variegated phenotype in a red-pigment accumulation background that generated uniform red colonies. Analysis of isolated red and white colonies revealed that silencing of genes involved in pigment accumulation by stochastic ectopic heterochromatin formation led to white colony formation. In addition, genome-wide analysis of red- and white-isolated clones revealed that epe1Δ resulted in a heterogeneous heterochromatin distribution among clones. We found that Epe1 had an N-terminal domain distinct from its JmjC domain, which activated transcription in both fission and budding yeasts. The N-terminal transcriptional activation (NTA) domain was involved in suppression of ectopic heterochromatin-mediated red-white variegation. We introduced a single copy of Epe1 into epe1Δ clones harboring ectopic heterochromatin, and found that Epe1 could reduce H3K9me from ectopic heterochromatin but some of the heterochromatin persisted. This persistence was due to a latent H3K9me source embedded in ectopic heterochromatin. Epe1H297A, a canonical JmjC mutant, suppressed red-white variegation, but entirely failed to remove already-established ectopic heterochromatin, suggesting that Epe1 prevented stochastic de novo deposition of ectopic H3K9me in an NTA-dependent but JmjC-independent manner, while its JmjC domain mediated removal of H3K9me from established ectopic heterochromatin. Our results suggest that Epe1 not only limits the distribution of heterochromatin but also controls the balance between suppression and retention of heterochromatin-mediated epigenetic diversification.


Conflict of interest statement

The authors have declared that no competing interests exist.

Figures

Fig 1
Fig 1. Loss of epe1 induces ectopic heterochromatin formation and phenotypic alterations.
(A) Schematic diagram showing the structure of the centromere of chromosome I (cen1). The position of the ade6+ marker is indicated (otr1R::ade6+). Endogenous ade6 is disrupted by a loss-of-function truncation mutation (ade6-DN/N). (B) Biosynthetic pathway for inositol monophosphate (IMP). Ade1 is a bifunctional enzyme. Little is known about the pathway of red pigment synthesis. (C) Colony color of epe1Δ clones and wild-type (WT) and clr4Δ strains on adenine-limited (Low Ade) medium. (D) Chromatin immunoprecipitation (ChIP)-qPCR analysis of H3K9me levels at otr1R::ade6+ and ade5. **p < 0.05. p-values were determined using a two-tailed Student’s t-test comparing the indicated sample value with the value of other samples. (E) Reverse transcription and quantitative polymerase chain reaction (qRT-PCR) analysis of otr1R::ade6+ and ade5 transcript levels relative to those of act1. **p < 0.05. p-values were determined using a two-tailed Student’s t-test comparing the indicated sample value with the value of other samples. (F) Transcriptome microarray analysis. The x-axis indicates the chromosome position of subtel3R. The y-axis indicates log2 fold changes of gene expression levels in R69 or W70 clone cells over those in WT cells. The upper panel indicates the gene positions and names corresponding to array positions. Unreliable signals with low intensity were excluded. Red cross, epe1Δ R69/WT; black dot, epe1Δ W70/WT; sky-blue solid line, y = 0; gray broken line, y = ±log2(1.5). (G) ChIP-qPCR analyses of Swi6 at subtel3R genes, nsa2 and ade5. **p < 0.05 (two-tailed Student’s t-test). Note that the background level in Swi6 ChIP analysis was high. (H) Ten-fold serial dilution assay for diploid strains. Schematic representation of the diploid complementation system is indicated. The epe1Δ W70 strain was used as a carrier strain. (I) ChIP-qPCR analysis of H3K9me at ade5 in diploids. ade5+/+ and ade5*/+ samples provided biallelic signals. ade5+/Δ and ade5*/Δ samples provided monoallelic signals. ChIP-qPCR and qRT-PCR data are represented as mean ± standard deviation (SD) of three independent experiments (n = 3).
Fig 2
Fig 2. The red-white variegation phenotype is linked to ectopic heterochromatin formation.
(A) Comparison of colony color among double deletion mutants on adenine-limited medium. These strains had no ade6+ marker. Endogenous ade6 is disrupted by a loss-of-function mutation (ade6-m210) [29]. Strains with single deletions of major heterochromatin assembly factors are shown side by side. Eight percent of the plate area is displayed. (B) Percentage of colored and white colonies of single and double deletion mutants shown in (A). (C) Ten-fold serial dilution assay. Some of the obtained isolates were spotted on adenine-limited medium. epe1Δ W6-1 and W8-1 clones displayed parental epe1Δ-like phenotypes despite white colony isolation. (D) ChIP-sequencing (ChIP-seq) analysis of H3K9me. Right subtelomeres of chromosome III are shown. Blue graphs indicate normalized fragment counts. The vertical range of the graphs is indicated on the left. Open arrowhead, essential genes based on the S. pombe gene database (PomBase; https://www.pombase.org); filled arrowhead, nonessential genes; orientation >, left to right; orientation <, right to left. Bar, 5 kb. (E) ChIP-qPCR analysis of H3K9me at ade5. (F) qRT-PCR analysis of ade5 transcript levels. **p < 0.05. p-values were determined using a two-tailed Student’s t-test comparing the indicated sample value with the value of other samples. (G) ChIP-sequencing analysis of H3K9me. ade1 and the surrounding region are shown. Bar, 5 kb; open arrowhead, essential genes based on PomBase; filled arrowhead, nonessential genes. (H) ChIP-qPCR analysis of H3K9me at ade1 and ypt7. ChIP-qPCR and qRT-PCR data are represented as mean ± SD of three independent experiments (n = 3).
Fig 3
Fig 3. Stochastic formation of ectopic heterochromatin and development of islands constitute the diversified epigenotypes of the epe1Δ strain.
(A) ChIP-sequencing analysis of H3K9me in otr1R::ade6+ strains. Three right subtelomeric regions are shown. The vertical range of the graphs is indicated on the left. Bar, 10 kb; open arrowhead, essential genes based on the S. pombe gene database; filled arrowhead, nonessential genes; orientation >, left to right; orientation <, right to left. (B) Colony color of epe1Δ ago1Δ and epe1Δ ago1Δ W173 strains on adenine-limited medium. (C) ChIP-qPCR analysis of Swi6 at ade5 and gal1 in epe1Δ W164 and epe1Δ ago1Δ W173 clones. (D) qRT-PCR analysis of ade5 and gal1 transcript levels. (E) ChIP-qPCR analyses of H3K9me at gal1 in epe1Δ W164 and epe1Δ ago1Δ W173 clones. (F) Ten-fold serial dilution assay on YEGal medium. (G) ChIP-sequencing analysis of H3K9me. pdi4 and can1 and their surrounding regions are shown. Bar, 5 kb. (H) ChIP-qPCR analyses of H3K9me at pdi4 and can1. (I) ChIP-sequencing analysis of H3K9me in the ade6-m210 WT strain. subtel1R is displayed. Bar, 10 kb. ChIP-qPCR and qRT-PCR data are represented as mean ± SD of three independent experiments (n = 3). The separated data in (E) and (H) were obtained from two independent analyses.
Fig 4
Fig 4. Epe1 prevents the ectopic heterochromatin-mediated red-white variegation via an N-terminal transcriptional activation domain-dependent mechanism.
(A) Comparison of colony color of strains expressing the 3FLAG-tagged Epe1 protein and H297A JmjC domain mutant on adenine-limited medium (left). Eight percent of the plate area is displayed. Percentage of colored and white colonies is shown to the right. (B) Schematic representation of the diploid complementation analysis. The epe1Δ W-t1 strain was used as a carrier strain, which harbored ade5 ectopic heterochromatin (ade5*). (C) Ten-fold serial dilution assay for diploid strains. The indicated strains were spotted onto adenine-limited medium. (D) ChIP-qPCR analysis of H3K9me for diploid cells at ade5. The qPCR signals were monoallelic. **p < 0.05 (two-tailed Student’s t-test). (E) Ten-fold serial dilution assay of 3FLAG-Epe1H297A and W2-1 white-isolated strains. (F) ChIP-sequencing analysis of H3K9me. subtel3R is shown. Bar, 5 kb. (G) ChIP-qPCR analysis of FLAG-tagged Epe1 proteins at IRC3, dg, and ade5. IRC3, the boundary sequence located outside cen3. WT cells were used for the no tag control. (H) Co-immunoprecipitation of Swi6 with Epe1 or its mutants. Immunoprecipitated Epe1 and Swi6 were detected by Western blotting. Input represents 20% (FLAG) or 0.4% (Swi6) of the amount of lysates used for immunoprecipitation. (I) Analysis of transcriptional activation activity of Epe1 using the HIS3 reporter gene in the yeast two-hybrid system. Ten-fold serial dilution assay was performed. Epe1 or its truncated mutants were expressed as bait. No protein was expressed as prey. The position of the JmjC domain is indicated in the truncation map. (J) Tethered transcription analysis of the ade6-m210 reporter in fission yeast. Ten-fold serial dilution assay was performed. Strains containing indicated reporter and expression plasmids were spotted on PMG-based synthetic media. Minus UL, lacking Ura and Leu; −ULA, lacking Ura, Leu, and Ade. The reporter plasmid contained three Gal4-binding sites (3GBS) derived from the GAL1-10 upstream activating sequence. Target peptides indicated were fused to Gal4 DNA binding domain (DBD). The VP16 transactivation domain (TAD) was used as a positive control. NTA, N-terminal transcriptional activation domain (1–171 amino acids region). (K) Colony color of a strain expressing the 3FLAG-tagged Epe1ΔN protein (left). This strain harbored the ade6-m210 background. Percentage of colored and white colonies is shown (right). ChIP-qPCR data are represented as mean ± SD of three independent experiments (n = 3).
Fig 5
Fig 5. JmjC-mediated incomplete suppression of ectopic heterochromatin provides metastable epigenetic variation.
(A) ChIP-qPCR analysis of H3K9me at SPCC569.03 in diploid cells. The indicated strains provided biallelic signals. **p < 0.05 (two-tailed Student’s t-test). The strains used were the same as those in Fig 4C and 4D. (B) Schematic diagram of the LEU2-4TBS invasion system. Transcription of the coding sequence of S. cerevisiae LEU2 was initiated by the promoter of SPCC569.06 and terminated by the S. cerevisiae ADH1 terminator. 4TBS was placed after the terminator. Bar, 5 kb. (C) Ten-fold serial dilution assay of the strain harboring 4TBS-induced heterochromatin shown on adenine-limited and PMG −Leu media. (D) ChIP-qPCR analysis of H3K9me at ade5 and LEU2. NP, not performed. 4TBS is about 1.3 and 9.5 kb away from the PCR loci of LEU2 and ade5, respectively. (E) Schematic diagram of diploid complementation of ade5* and LEU2* epialleles. (F) Ten-fold serial dilution assay on adenine-limited and PMG −Leu media for diploid complementation. (G) ChIP-qPCR analysis of H3K9me for diploid strains at ade5 and LEU2. All strains provided monoallelic signals. ChIP-qPCR data are represented as mean ± SD of three independent experiments (n = 3).
Fig 6
Fig 6. Model of two distinct functions of Epe1 in the suppression of ectopic heterochromatin formation and selective retention of robust ectopic heterochromatin.
Before ectopic heterochromatin establishment (left), Epe1 prevents early deposition of H3K9me via a mechanism that involves its N-terminal transcriptional activation (NTA) domain but not its JmjC. After ectopic heterochromatin establishment (right), Epe1 promotes incomplete demethylation of ectopic H3K9me. Epe1 cannot disrupt already-established ectopic heterochromatin near an H3K9me supply source because the source provides H3K9me and counterbalances removal of H3K9me by Epe1, whereas Epe1 can remove the source-distal H3K9me mark in a JmjC-dependent manner. EHC, ectopic heterochromatin. NTA domain, 1–171 amino acid region as identified in this study; JmjC domain, 243–402 amino acid region as assigned in the SMART database (http://smart.embl-heidelberg.de).

Similar articles

Cited by

References

    1. Rea S, Eisenhaber F, O’Carroll D, Strahl BD, Sun ZW, Schmid M, et al. Regulation of chromatin structure by site-specific histone H3 methyltransferases. Nature. 2000;406(6796):593–599. 10.1038/35020506 - DOI - PubMed
    1. Nakayama J-I, Rice JC, Strahl BD, Allis CD, Grewal SIS. Role of Histone H3 Lysine 9 Methylation in Epigenetic Control of Heterochromatin Assembly. Science. 2001;292(5514):110–113. 10.1126/science.1060118 - DOI - PubMed
    1. Cam HP, Sugiyama T, Chen ES, Chen X, FitzGerald PC, Grewal SIS. Comprehensive analysis of heterochromatin- and RNAi-mediated epigenetic control of the fission yeast genome. Nat Genet. 2005;37(8):809–819. 10.1038/ng1602 - DOI - PubMed
    1. Volpe TA, Kidner C, Hall IM, Teng G, Grewal SIS, Martienssen RA. Regulation of heterochromatic silencing and histone H3 lysine-9 methylation by RNAi. Science. 2002;297(5588):1833–1837. 10.1126/science.1074973 - DOI - PubMed
    1. Kanoh J, Sadaie M, Urano T, Ishikawa F. Telomere binding protein Taz1 establishes Swi6 heterochromatin independently of RNAi at telomeres. Curr Biol. 2005;15(20):1808–19. 10.1016/j.cub.2005.09.041 - DOI - PubMed

Publication types

MeSH terms