

Utility of a smartphone based system (cvrphone) to accurately determine apneic events from electrocardiographic signals
- PMID: 31206522
- PMCID: PMC6576766
- DOI: 10.1371/journal.pone.0217217
Utility of a smartphone based system (cvrphone) to accurately determine apneic events from electrocardiographic signals
Abstract
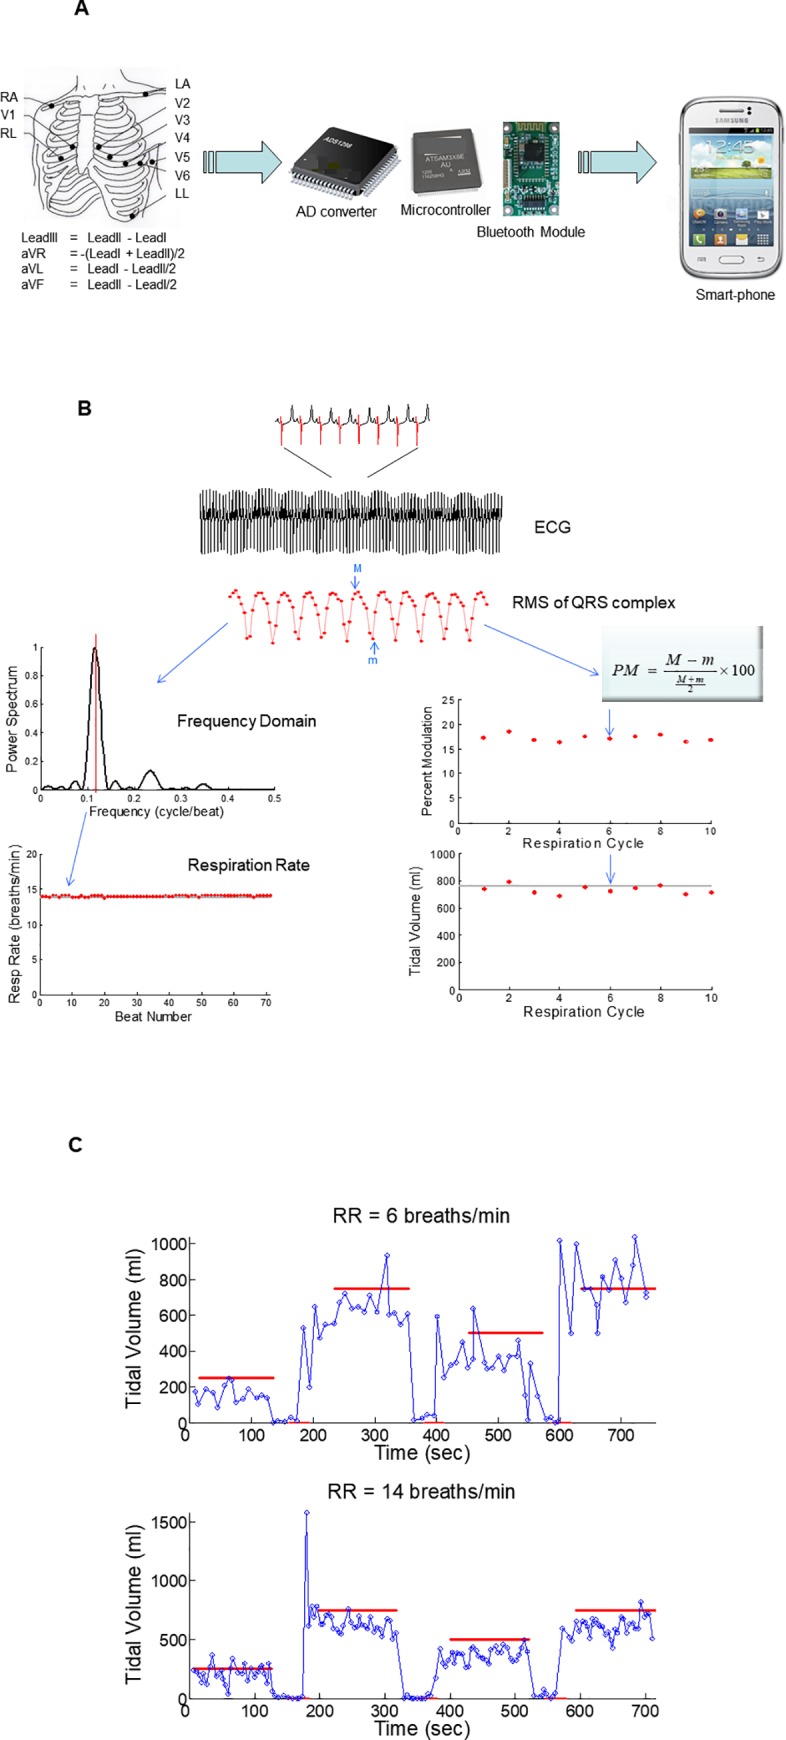
Background: Sleep disordered breathing manifested as sleep apnea (SA) is prevalent in the general population, and while it is associated with increased morbidity and mortality risk in some patient populations, it remains under-diagnosed. The objective of this study was to assess the accuracy of respiration-rate (RR) and tidal-volume (TV) estimation algorithms, from body-surface ECG signals, using a smartphone based ambulatory respiration monitoring system (cvrPhone).
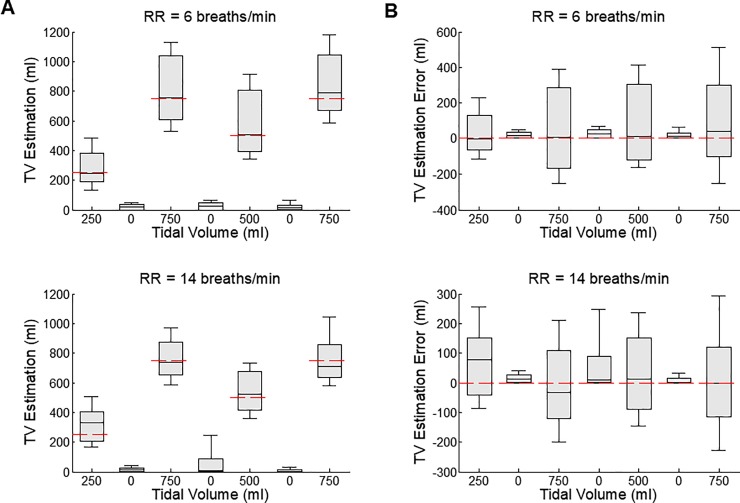
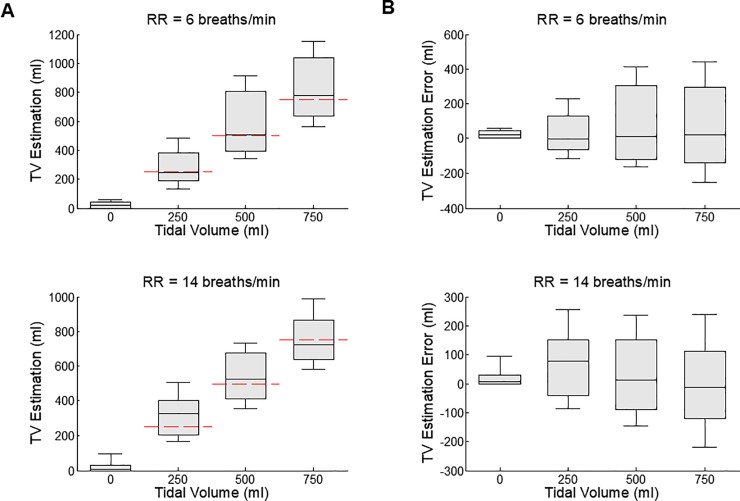
Methods: Twelve lead ECG signals were collected using the cvrPhone from anesthetized and mechanically ventilated swine (n = 9). During ECG data acquisition, the mechanical ventilator tidal-volume (TV) was varied from 250 to 0 to 750 to 0 to 500 to 0 to 750 ml at respiratory rates (RR) of 6 and 14 breaths/min, respectively, and the RR and TV values were estimated from the ECG signals using custom algorithms.
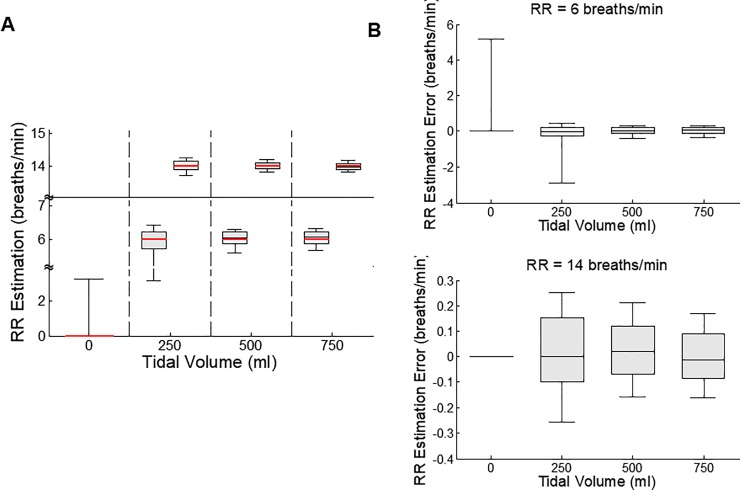
Results: TV estimations from any two different TV settings showed statistically significant difference (p < 0.01) regardless of the RR. RRs were estimated to be 6.1±1.1 and 14.0±0.2 breaths/min at 6 and 14 breaths/min, respectively (when 250, 500 and 750 ml TV settings were combined). During apnea, the estimated TV and RR values were 11.7±54.9 ml and 0.0±3.5 breaths/min, which were significantly different (p<0.05) than TV and RR values during non-apnea breathing. In addition, the time delay from the apnea onset to the first apnea detection was 8.6±6.7 and 7.0±3.2 seconds for TV and RR respectively.
Conclusions: We have demonstrated that apnea can reliably be detected using ECG-derived RR and TV algorithms. These results support the concept that our algorithms can be utilized to detect SA in conjunction with ECG monitoring.
Conflict of interest statement
The authors have declared that no competing interests exist.
Figures
Similar articles
-
Utility of a Smartphone-Based System (cvrPhone) in Estimating Minute Ventilation from Electrocardiographic Signals.Telemed J E Health. 2021 Dec;27(12):1433-1439. doi: 10.1089/tmj.2020.0507. Epub 2021 Mar 15. Telemed J E Health. 2021. PMID: 33729001 Free PMC article.
-
A Novel Point-of-Care Smartphone Based System for Monitoring the Cardiac and Respiratory Systems.Sci Rep. 2017 Mar 22;7:44946. doi: 10.1038/srep44946. Sci Rep. 2017. PMID: 28327645 Free PMC article.
-
An optimized method for estimating the tidal volume from intracardiac or body surface electrocardiographic signals: implications for estimating minute ventilation.Am J Physiol Heart Circ Physiol. 2014 Aug 1;307(3):H426-36. doi: 10.1152/ajpheart.00038.2014. Epub 2014 Jun 6. Am J Physiol Heart Circ Physiol. 2014. PMID: 24906917 Free PMC article.
-
Development of three methods for extracting respiration from the surface ECG: a review.J Electrocardiol. 2014 Nov-Dec;47(6):819-25. doi: 10.1016/j.jelectrocard.2014.07.020. Epub 2014 Aug 4. J Electrocardiol. 2014. PMID: 25194875 Review.
-
Sleep apnea: a review of diagnostic sensors, algorithms, and therapies.Physiol Meas. 2017 Aug 18;38(9):R204-R252. doi: 10.1088/1361-6579/aa6ec6. Physiol Meas. 2017. PMID: 28820743 Review.
Cited by
-
Clinical Potential of Beat-to-Beat Diastolic Interval Control in Preventing Cardiac Arrhythmias.J Am Heart Assoc. 2021 Jun;10(11):e020750. doi: 10.1161/JAHA.121.020750. Epub 2021 May 22. J Am Heart Assoc. 2021. PMID: 34027678 Free PMC article.
-
Design Implementation and Evaluation of a Mobile Continuous Blood Oxygen Saturation Monitoring System.Sensors (Basel). 2020 Nov 18;20(22):6581. doi: 10.3390/s20226581. Sensors (Basel). 2020. PMID: 33217945 Free PMC article.
-
Wearable Devices for Ambulatory Cardiac Monitoring: JACC State-of-the-Art Review.J Am Coll Cardiol. 2020 Apr 7;75(13):1582-1592. doi: 10.1016/j.jacc.2020.01.046. J Am Coll Cardiol. 2020. PMID: 32241375 Free PMC article. Review.
-
Utility of a Smartphone-Based System (cvrPhone) in Estimating Minute Ventilation from Electrocardiographic Signals.Telemed J E Health. 2021 Dec;27(12):1433-1439. doi: 10.1089/tmj.2020.0507. Epub 2021 Mar 15. Telemed J E Health. 2021. PMID: 33729001 Free PMC article.
-
Ambulatory monitoring promises equitable personalized healthcare delivery in underrepresented patients.Eur Heart J Digit Health. 2021 Jun 28;2(3):494-510. doi: 10.1093/ehjdh/ztab047. eCollection 2021 Sep. Eur Heart J Digit Health. 2021. PMID: 34604759 Free PMC article. Review.
References
-
- Weiss EH, Sayadi O, Ramaswamy P, Merchant FM, Sajja N, Foley L, et al. An optimized method for the estimation of the respiratory rate from electrocardiographic signals: implications for estimating minute ventilation. Am J Physiol Heart Circ Physiol. 2014;307(3):H437–47. 10.1152/ajpheart.00039.2014 . - DOI - PMC - PubMed
-
- Sayadi O, Weiss EH, Merchant FM, Puppala D, Armoundas AA. An optimized method for estimating the tidal volume from intracardiac or body surface electrocardiographic signals: implications for estimating minute ventilation. Am J Physiol Heart Circ Physiol. 2014;307(3):H426–36. 10.1152/ajpheart.00038.2014 . - DOI - PMC - PubMed
-
- Gajic O, Dara SI, Mendez JL, Adesanya AO, Festic E, Caples SM, et al. Ventilator-associated lung injury in patients without acute lung injury at the onset of mechanical ventilation. Crit Care Med. 2004;32(9):1817–24. . - PubMed
Publication types
MeSH terms
Grants and funding
LinkOut - more resources
Full Text Sources
Medical
