Deciphering regulatory DNA sequences and noncoding genetic variants using neural network models of massively parallel reporter assays
- PMID: 31206543
- PMCID: PMC6576758
- DOI: 10.1371/journal.pone.0218073
Deciphering regulatory DNA sequences and noncoding genetic variants using neural network models of massively parallel reporter assays
Abstract
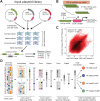
The relationship between noncoding DNA sequence and gene expression is not well-understood. Massively parallel reporter assays (MPRAs), which quantify the regulatory activity of large libraries of DNA sequences in parallel, are a powerful approach to characterize this relationship. We present MPRA-DragoNN, a convolutional neural network (CNN)-based framework to predict and interpret the regulatory activity of DNA sequences as measured by MPRAs. While our method is generally applicable to a variety of MPRA designs, here we trained our model on the Sharpr-MPRA dataset that measures the activity of ∼500,000 constructs tiling 15,720 regulatory regions in human K562 and HepG2 cell lines. MPRA-DragoNN predictions were moderately correlated (Spearman ρ = 0.28) with measured activity and were within range of replicate concordance of the assay. State-of-the-art model interpretation methods revealed high-resolution predictive regulatory sequence features that overlapped transcription factor (TF) binding motifs. We used the model to investigate the cell type and chromatin state preferences of predictive TF motifs. We explored the ability of our model to predict the allelic effects of regulatory variants in an independent MPRA experiment and fine map putative functional SNPs in loci associated with lipid traits. Our results suggest that interpretable deep learning models trained on MPRA data have the potential to reveal meaningful patterns in regulatory DNA sequences and prioritize regulatory genetic variants, especially as larger, higher-quality datasets are produced.
Conflict of interest statement
The authors have declared that no competing interests exist.
Figures


Similar articles
-
Statistical considerations for the analysis of massively parallel reporter assays data.Genet Epidemiol. 2020 Oct;44(7):785-794. doi: 10.1002/gepi.22337. Epub 2020 Jul 18. Genet Epidemiol. 2020. PMID: 32681690 Free PMC article.
-
Meta-analysis of massively parallel reporter assays enables prediction of regulatory function across cell types.Hum Mutat. 2019 Sep;40(9):1299-1313. doi: 10.1002/humu.23820. Epub 2019 Jun 18. Hum Mutat. 2019. PMID: 31131957 Free PMC article.
-
Genome-scale high-resolution mapping of activating and repressive nucleotides in regulatory regions.Nat Biotechnol. 2016 Nov;34(11):1180-1190. doi: 10.1038/nbt.3678. Epub 2016 Oct 3. Nat Biotechnol. 2016. PMID: 27701403 Free PMC article.
-
Focus on your locus with a massively parallel reporter assay.J Neurodev Disord. 2022 Sep 9;14(1):50. doi: 10.1186/s11689-022-09461-x. J Neurodev Disord. 2022. PMID: 36085003 Free PMC article. Review.
-
Massively parallel reporter assay: a novel technique for analyzing the regulation of gene expression.Yi Chuan. 2023 Oct 20;45(10):859-873. doi: 10.16288/j.yczz.23-180. Yi Chuan. 2023. PMID: 37872110 Review.
Cited by
-
layerUMAP: A tool for visualizing and understanding deep learning models in biological sequence classification using UMAP.iScience. 2022 Nov 7;25(12):105530. doi: 10.1016/j.isci.2022.105530. eCollection 2022 Dec 22. iScience. 2022. PMID: 36425757 Free PMC article.
-
A review of deep learning applications in human genomics using next-generation sequencing data.Hum Genomics. 2022 Jul 25;16(1):26. doi: 10.1186/s40246-022-00396-x. Hum Genomics. 2022. PMID: 35879805 Free PMC article. Review.
-
Massively parallel characterization of psychiatric disorder-associated and cell-type-specific regulatory elements in the developing human cortex.bioRxiv [Preprint]. 2023 Feb 16:2023.02.15.528663. doi: 10.1101/2023.02.15.528663. bioRxiv. 2023. Update in: Science. 2024 May 24;384(6698):eadh0559. doi: 10.1126/science.adh0559. PMID: 36824845 Free PMC article. Updated. Preprint.
-
Machine-guided design of cell-type-targeting cis-regulatory elements.Nature. 2024 Oct;634(8036):1211-1220. doi: 10.1038/s41586-024-08070-z. Epub 2024 Oct 23. Nature. 2024. PMID: 39443793 Free PMC article.
-
Defining the fine structure of promoter activity on a genome-wide scale with CISSECTOR.Nucleic Acids Res. 2023 Jun 23;51(11):5499-5511. doi: 10.1093/nar/gkad232. Nucleic Acids Res. 2023. PMID: 37013986 Free PMC article.
References
Publication types
MeSH terms
Substances
Grants and funding
LinkOut - more resources
Full Text Sources
Other Literature Sources
Miscellaneous

