. 2019 Sep;46(9):3998-4009.
doi: 10.1002/mp.13656. Epub 2019 Jul 17.

Paired cycle-GAN-based image correction for quantitative cone-beam computed tomography

Affiliations

Paired cycle-GAN-based image correction for quantitative cone-beam computed tomography

Joseph Harms et al. Med Phys. 2019 Sep.

Abstract

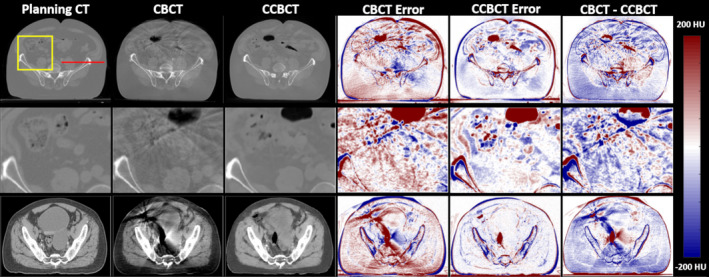
Purpose: The incorporation of cone-beam computed tomography (CBCT) has allowed for enhanced image-guided radiation therapy. While CBCT allows for daily 3D imaging, images suffer from severe artifacts, limiting the clinical potential of CBCT. In this work, a deep learning-based method for generating high quality corrected CBCT (CCBCT) images is proposed.

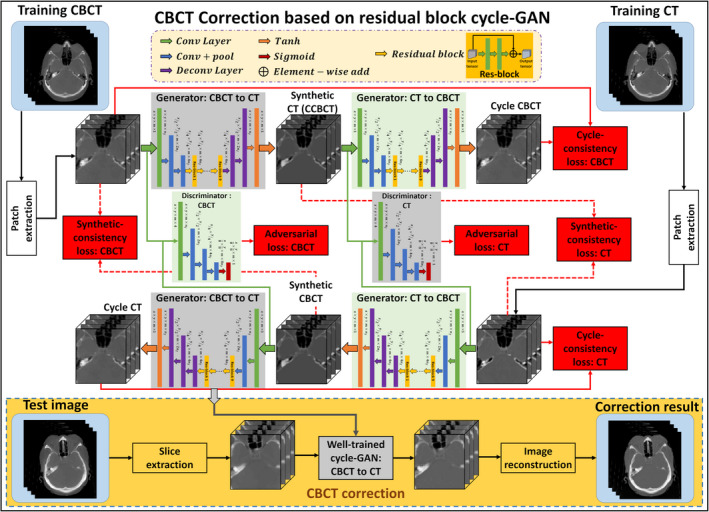
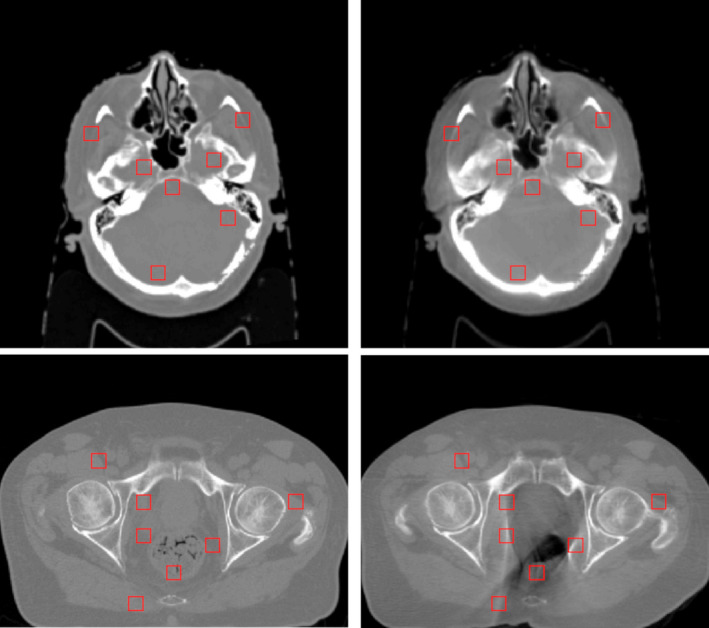
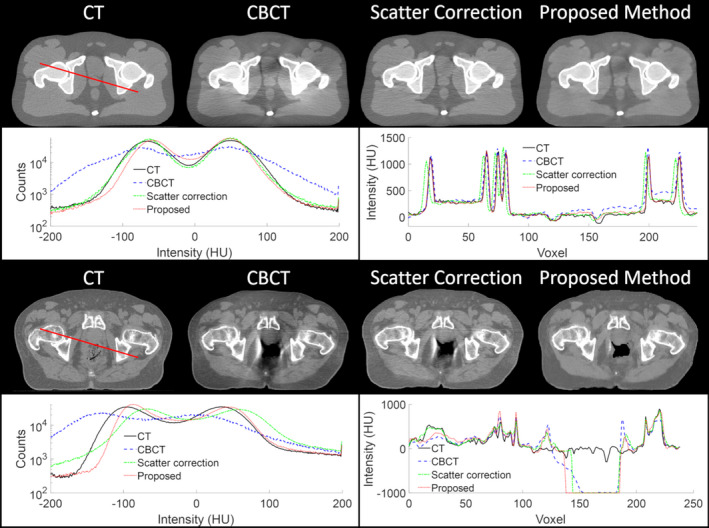
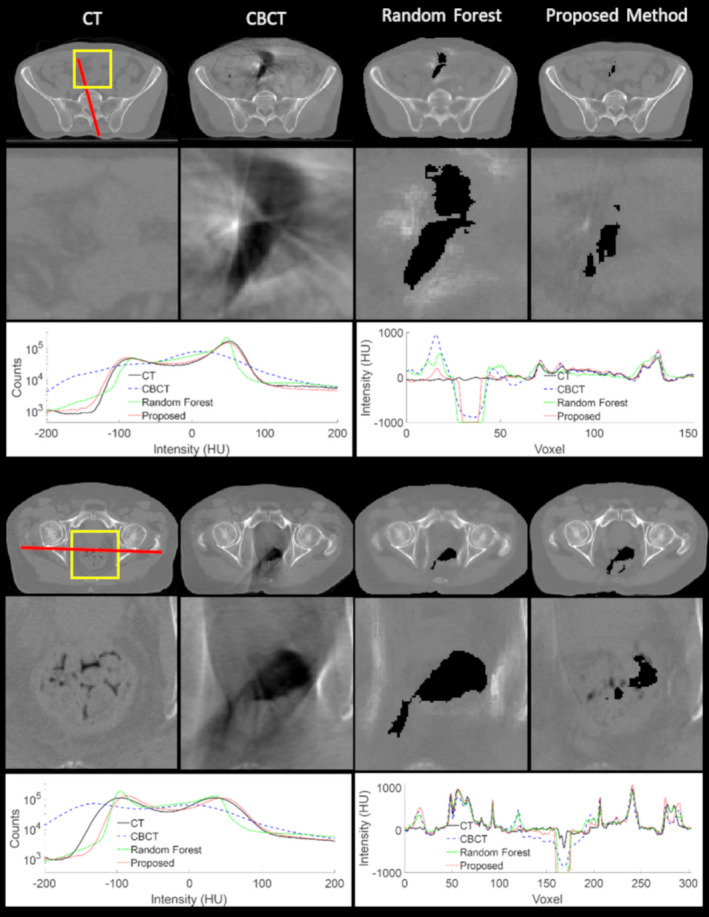
Methods: The proposed method integrates a residual block concept into a cycle-consistent adversarial network (cycle-GAN) framework, called res-cycle GAN, to learn a mapping between CBCT images and paired planning CT images. Compared with a GAN, a cycle-GAN includes an inverse transformation from CBCT to CT images, which constrains the model by forcing calculation of both a CCBCT and a synthetic CBCT. A fully convolution neural network with residual blocks is used in the generator to enable end-to-end CBCT-to-CT transformations. The proposed algorithm was evaluated using 24 sets of patient data in the brain and 20 sets of patient data in the pelvis. The mean absolute error (MAE), peak signal-to-noise ratio (PSNR), normalized cross-correlation (NCC) indices, and spatial non-uniformity (SNU) were used to quantify the correction accuracy of the proposed algorithm. The proposed method is compared to both a conventional scatter correction and another machine learning-based CBCT correction method.

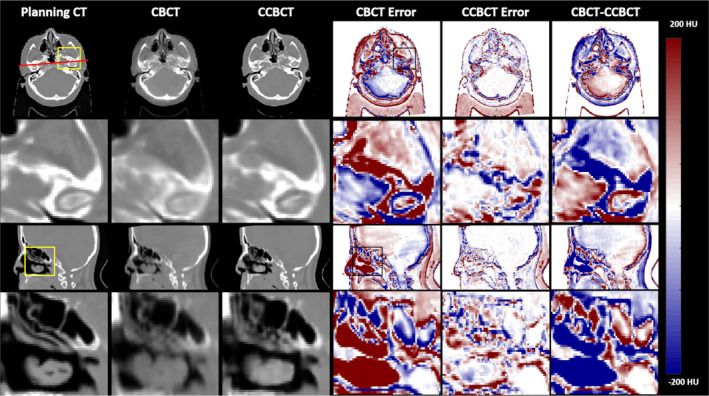
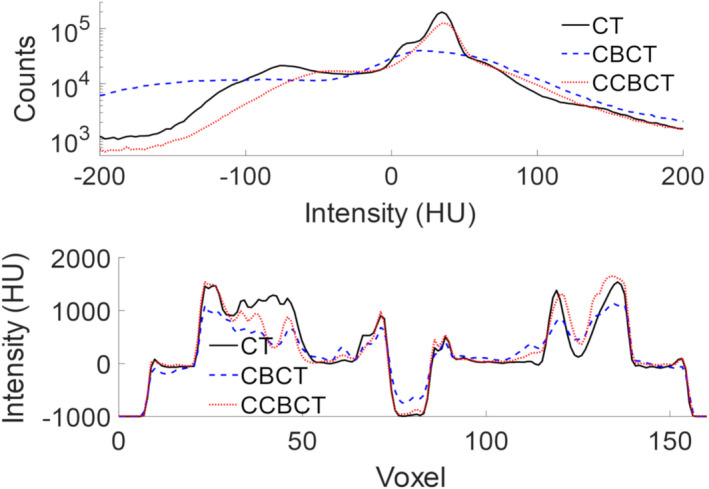
Results: Overall, the MAE, PSNR, NCC, and SNU were 13.0 HU, 37.5 dB, 0.99, and 0.05 in the brain, 16.1 HU, 30.7 dB, 0.98, and 0.09 in the pelvis for the proposed method, improvements of 45%, 16%, 1%, and 93% in the brain, and 71%, 38%, 2%, and 65% in the pelvis, over the CBCT image. The proposed method showed superior image quality as compared to the scatter correction method, reducing noise and artifact severity. The proposed method produced images with less noise and artifacts than the comparison machine learning-based method.

Conclusions: The authors have developed a novel deep learning-based method to generate high-quality corrected CBCT images. The proposed method increases onboard CBCT image quality, making it comparable to that of the planning CT. With further evaluation and clinical implementation, this method could lead to quantitative adaptive radiation therapy.

Keywords: adaptive radiation therapy; cycle-GAN; deep learning; image quality improvement; quantitative imaging.


Conflict of interest statement

The authors declare no conflicts of interest.

Figures

Figure 1
Figure 1
Schematic flow chart of the proposed method. The top region of the figure represents the training stage, and the yellow‐outlined region represents the test stage. During training, patches are extracted from paired cone‐beam computed tomography (CBCT) and CT images. A convolutional neural network is used to downsample the CBCT, and the residual difference between the CBCT and the CT is minimized at this coarsest layer. The synthetic CT (corrected CBCT) image is then upsampled to its original resolution, and a discriminator is trained to learn the difference between this synthetic CT (corrected CBCT) and the planning CT. The inverse of this process is then carried out to generate the cycle CBCT. Simultaneously to training the network to go from CBCT to cycle CBCT, a complementary network is trained to go from planning CT to cycle CT. After training, a CBCT image can be fed into the network which quickly generates a corrected CBCT image. [Color figure can be viewed at wileyonlinelibrary.com]
Figure 2
Figure 2
Selected ROIs for measuring spatial nonuniformity. [Color figure can be viewed at wileyonlinelibrary.com]
Figure 3
Figure 3
Summary of cone‐beam computed tomography (CBCT) correction results in one brain patient. The first column shows various views of the planning CT images, the second column shows corresponding views of the original CBCT image, the third column shows the corrected CBCT image, and fourth and fifth columns show the CBCT error and CCBCT error, respectively. For error images, the planning CT was taken as the ground truth. The planning CT is taken as the ground truth for error calculations. The top row shows an axial slice of the patient, with the highlighted insert shown directly below. The final column shows the difference image between the CBCT and CCBCT. A sagittal slice is shown with an ROI in pharynx shown below. [Color figure can be viewed at wileyonlinelibrary.com]
Figure 4
Figure 4
Histogram of HU values for the images shown in for the full 3D image seen Fig. 3 (top) and line profile through the axial images shown in Fig. 3 corresponding to the red line drawn on the planning CT (bottom). [Color figure can be viewed at wileyonlinelibrary.com]
Figure 5
Figure 5
Cone‐beam computed tomography (CBCT) correction results on two sets of pelvis patient data. The first column shows various views of the planning CT images, the second column shows corresponding views of the original CBCT image, the third column shows the corrected CBCT image, the fourth and fifth columns show the CBCT error and CCBCT error, and the final column shows the difference between the CBCT and CCBCT images, respectively. The CT images and inserts in the first two rows are shown on a window of [−1000 1000] HU, the final row of CT images and the error images are both shown on a window of [−200 200] HU. [Color figure can be viewed at wileyonlinelibrary.com]
Figure 6
Figure 6
Comparison of the proposed method to a conventional scatter correction on a pelvis patient. The top row shows an axial slice of the computed tomography (CT), cone‐beam CT (CBCT), and corrected CBCT by the scatter correction and the proposed method. The second row shows the histogram of the full 3D image on the left and the line profile outlined on the CT image on the right. [Color figure can be viewed at wileyonlinelibrary.com]
Figure 7
Figure 7
Cone‐beam computed tomography correction visual results on two sets of pelvis patient data. The first and fourth columns show the computed tomography images for the patients, the second and fifth rows show zoomed‐in inserts of the respective regions outlined in yellow, and the third and sixth rows show the image histograms and line profiles. [Color figure can be viewed at wileyonlinelibrary.com]

References

    1. Endo M, Tsunoo T, Nakamori N, Yoshida K. Effect of scattered radiation on image noise in cone beam CT. Med Phys. 2001;28:469–474. - PubMed
    1. Siewerdsen JH, Jaffray DA. Cone‐beam computed tomography with a flat‐panel imager: magnitude and effects of x‐ray scatter. Med Phys. 2001;28:220–231. - PubMed
    1. Shi L, Tsui T, Wei J, Zhu L. Fast shading correction for cone beam CT in radiation therapy via sparse sampling on planning CT. Med Phys. 2017;44:1796–1808. - PubMed
    1. Xu Y, Bai T, Yan H, et al. A practical cone‐beam CT scatter correction method with optimized Monte Carlo simulations for image‐guided radiation therapy. Phys Med Biol. 2015;60:3567. - PMC - PubMed
    1. Yoo J‐C, Han TH. Fast normalized cross‐correlation. J Circ Sys Signal Proc. 2009;28:819.

MeSH terms