. 2020 Jan;71(1):291-305.
doi: 10.1002/hep.30809. Epub 2019 Aug 27.

Development of Capsular Fibrosis Beneath the Liver Surface in Humans and Mice

Affiliations

Development of Capsular Fibrosis Beneath the Liver Surface in Humans and Mice

Steven Balog et al. Hepatology. 2020 Jan.

Abstract

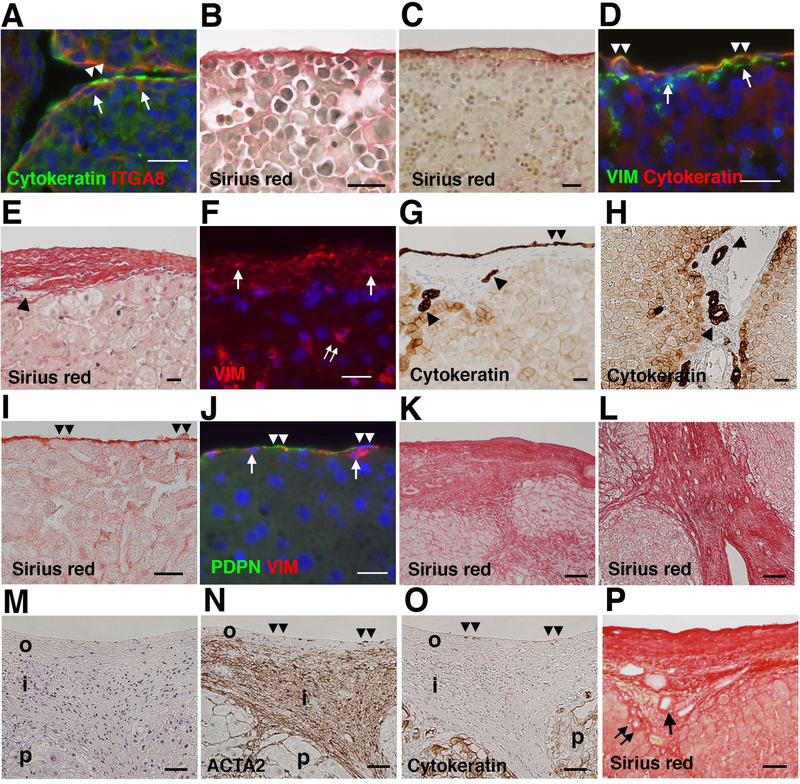
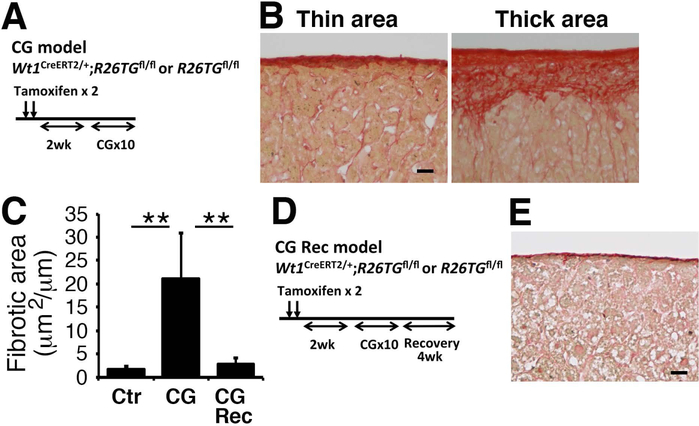
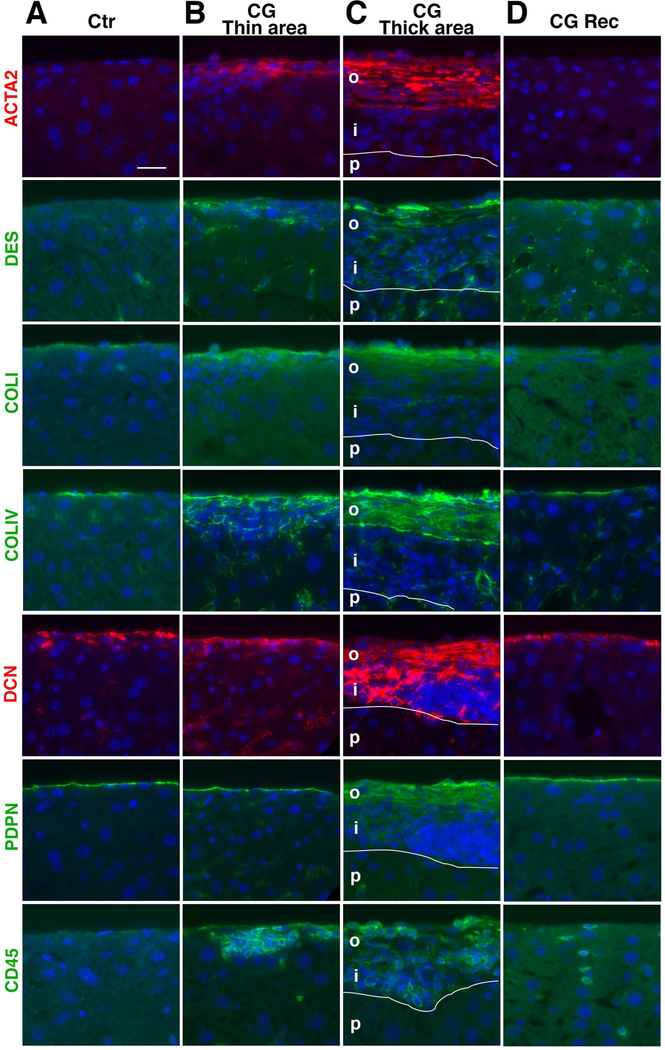
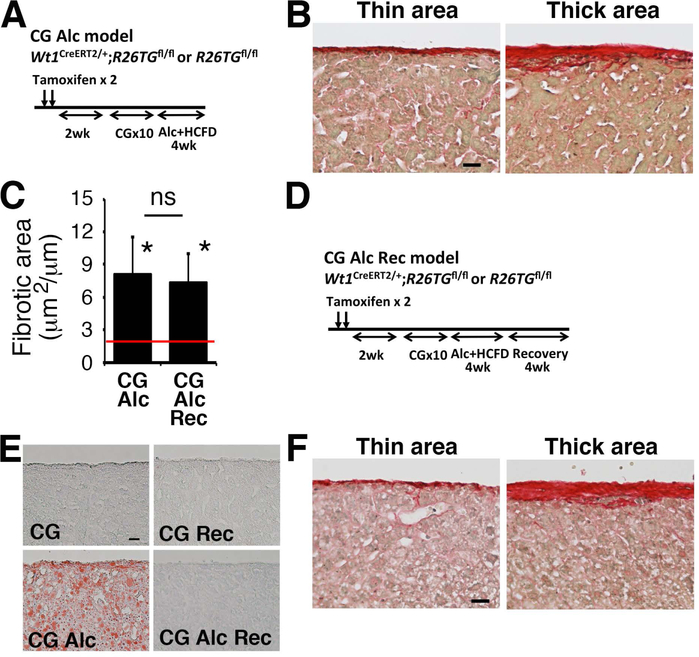
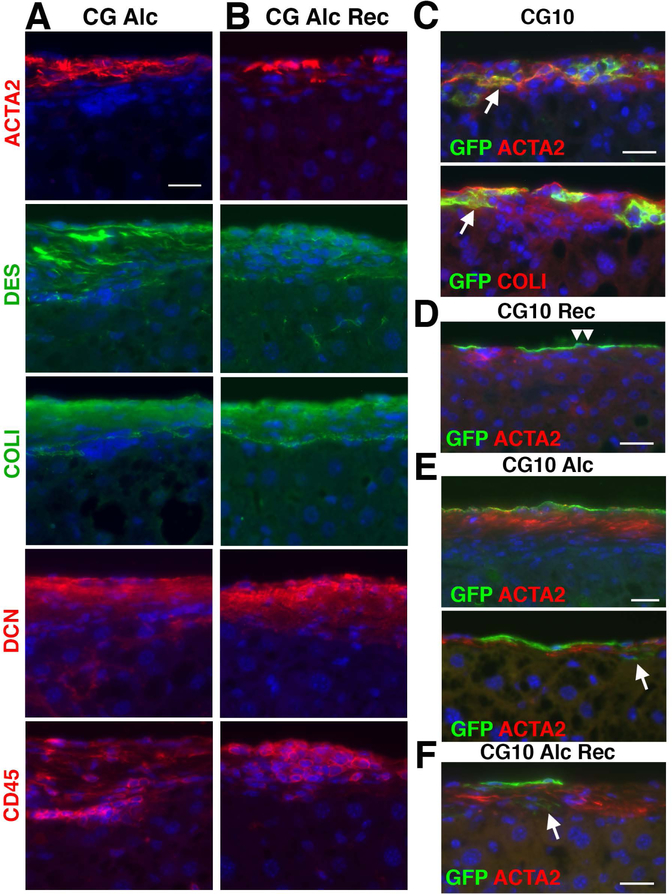
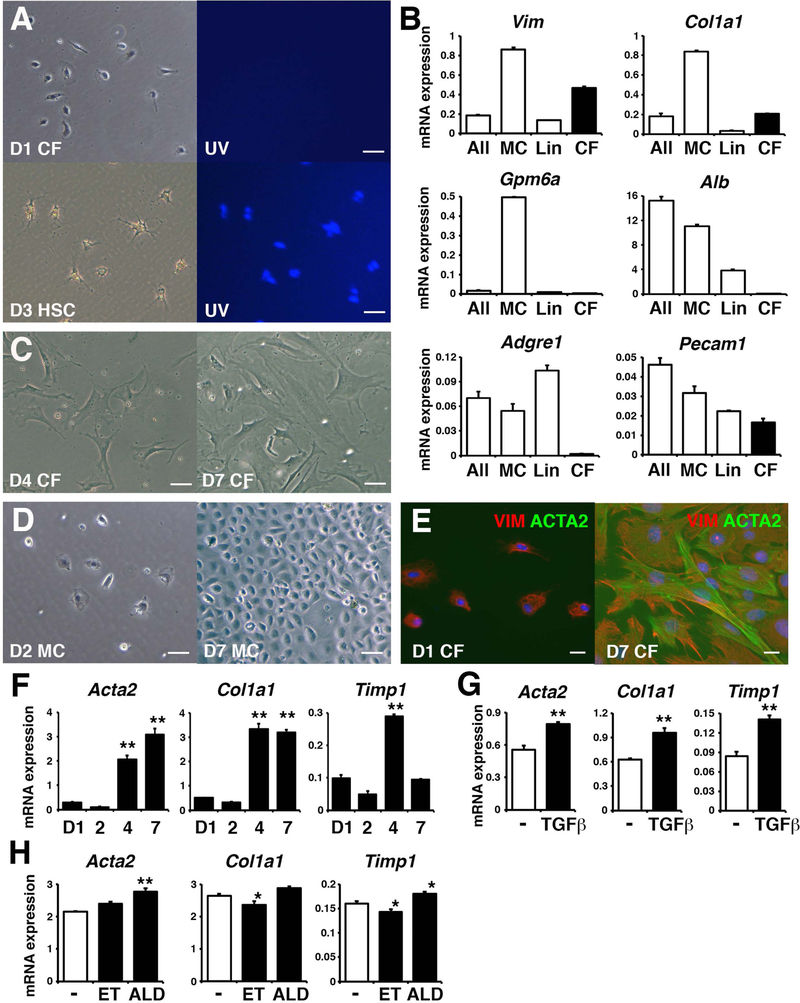
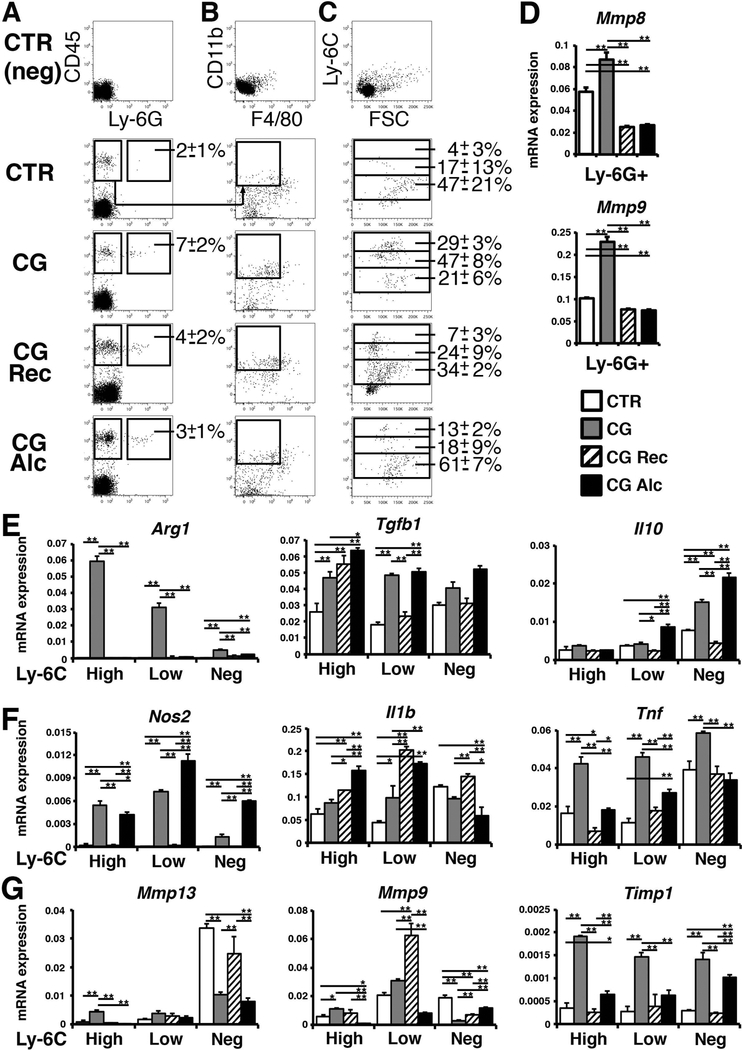
Glisson's capsule is the connective tissue present in the portal triad as well as beneath the liver surface. Little is known about how Glisson's capsule changes its structure in capsular fibrosis (CF), which is characterized by fibrogenesis beneath the liver surface. In this study, we found that the human liver surface exhibits multilayered capsular fibroblasts and that the bile duct is present beneath the mesothelium, whereas capsular fibroblasts are scarce and no bile ducts are present beneath the mouse liver surface. Patients with cirrhosis caused by alcohol abuse or hepatitis C virus infection show development of massive CF. To examine the effect of alcohol on CF in mice, we first injected chlorhexidine gluconate (CG) intraperitoneally and then fed alcohol for 1 month. The CG injection induces CF consisting of myofibroblasts beneath the mesothelium. One month after CG injection, the fibrotic area returns to the normal structure. In contrast, additional alcohol feeding sustains the presence of myofibroblasts in CF. Cell lineage tracing revealed that mesothelial cells give rise to myofibroblasts in CF, but these myofibroblasts disappear 1 month after recovery with or without alcohol feeding. Capsular fibroblasts isolated from the mouse liver spontaneously differentiated into myofibroblasts and their differentiation was induced by transforming growth factor beta 1 (TGF-β1) or acetaldehyde in culture. In alcohol-fed mice, infiltrating CD11b+ Ly-6CLow/- monocytes had reduced mRNA expression of matrix metalloproteinase 13 and matrix metalloproteinase 9 and increased expression of tissue inhibitor of matrix metalloproteinase 1, Tgfb1, and interleukin-10 during resolution of CF. Conclusion: The present study revealed that the structure of Glisson's capsule is different between human and mouse livers and that alcohol impairs the resolution of CF by changing the phenotype of Ly-6CLow/- monocytes.


Figures

FIG. 1.
FIG. 1.
Structural difference of Glisson’s capsule in human and mouse livers. (A) Immunofluorescence staining of the E12.5 mouse liver. Arrows and double arrowheads indicate ITGA8+ capsular fibroblasts and cytokeratin+ mesothelial cells, respectively. Nuclei were counterstained with DAPI. (B) Sirius red staining of the E13.5 mouse liver. (C) Sirius red staining of the human fetal liver. (D) Immunofluorescence staining of the human fetal liver. Arrows and double arrowheads indicate VIM+ capsular fibroblasts and cytokeratin+VIM+ mesothelial cells, respectively. (E) Sirius red staining of the normal human liver. An arrowhead indicates the bile duct in the capsule. (F) Immunofluorescence staining of the human liver. Arrows and double arrows indicate VIM+ capsular fibroblasts and hepatic stellate cells, respectively. (G,H) Immunohistochemistry of the normal human liver. Double arrowheads indicate cytokeratin+ mesothelial cells. Arrowheads indicate bile ducts in Glisson’s capsule beneath the liver surface in G or in the portal triad in H. (I) Sirius red staining of the adult mouse liver. Double arrowheads indicate the mesothelium. (J) Immunofluorescence staining of the normal mouse liver. Arrows indicate VIM+ capsular fibroblasts beneath PDPN+ mesothelial cells. (K-O) Human specimens with alcoholic cirrhosis were analyzed by Sirius red staining (K,L), H&E staining (M), and immunohistochemistry for ACTA2 (N) and cytokeratin (O). Double arrowheads indicate the liver surface. i; inner layer, o; outer layer, p; parenchyma. (P) Sirius red staining of cirrhotic liver caused by HCV infection. Arrow and double arrows indicate the portal vein and bile duct, respectively. Bars, 20 μm (A-J) and 50 μm (K-P).
FIG. 2.
FIG. 2.
No induction of capsular fibrosis by alcohol intake in mice. (A) Experimental design. After labeling mesothelial cells as GFP+ cells by tamoxifen injection in Wt1CreERT2/+;R26TGfl/fl mice, we fed mice HCFD for 2 weeks, and then additionally fed ethanol and high-fat liquid diet (Alc+HFD) by intragastric (IG) catheter for 5 weeks (n=4). Control mice were fed an isocaloric dextrose solution instead of ethanol (n=3). (B) Immunofluorescence staining shows that tamoxifen treatment induces GFP in GPM6A+ mesothelial cells (double arrowheads) in Wt1CreERT2/+;R26TGfl/fl, but not in Wt1+/+;R26TGfl/fl mice. (C) BAL, plasma ALT, and liver/body weight of the control (Ctr) and alcohol-treated (Alc) mice. *P< 0.05, **P< 0.01. (D) RT-QPCR of the livers from the Ctr and Alc mice. (E) Sirius red staining of the Ctr and Alc livers. (F) Immunofluorescence staining of the livers with GFP (green) and DES or ACTA2 (red). Arrows indicate mesothelial cell-derived hepatic stellate cell-like cells expressing DES, but not ACTA2. Mesothelial cells are indicated by double arrowheads. Double arrows indicate ACTA2+ myofibroblasts inside the injured liver. Bars; 10 μm (B,F) and 50 μm (E).
FIG. 3.
FIG. 3.
Capsular fibrosis induced by CG injections and its resolution. (A) Experimental design. After injection of tamoxifen to Wt1CreERT2/+;R26TGfl/fl (n=3) and R26TGfl/fl (n=3) mice, CG was intraperitoneally injected 10 times to mice (CG model). (B) Sirius red staining of the mouse livers. The CG model induces capsular fibrosis in mice. Note that development of capsular fibrosis is not uniformly observed on the liver surface. (C) Quantification of the fibrotic areas stained with Sirius red on the liver surface. ** P< 0.01. (D) Experimental design. After injection of tamoxifen to Wt1CreERT2/+;R26TGfl/fl (n=4) and R26TGfl/fl (n=2) mice, CG was injected to mice. To induce resolution of capsular fibrosis, mice were kept 1 month without CG treatment (CG-Rec). (E) Sirius red staining of the liver surface 1 month after CG injection. Bar, 20 μm.
FIG. 4.
FIG. 4.
Development of capsular fibrosis and accumulation of myofibroblasts in capsular fibrosis. Liver tissues were examined by immunofluorescence staining. (A) The control normal liver (Ctr) shows no expression of ACTA2 and DES and weak expression of COLI, COLIV, and DCN on the liver surface. Mesothelial cells express PDPN. (B,C) CG injection induces capsular fibrosis. The thin fibrotic areas in B show the presence of ACTA2+DES+ myofibroblasts surrounding COLI and COLIV. Infiltration of CD45+ cells is observed in the fibrotic area. The thick fibrotic area in C is composed of 2 layers. The outer layer (o) contains myofibroblasts surrounded by COLI, COLIV, and DCN. DES+ fibroblastic cells in the inner layer (i) are largely negative for ACTA2, COLI, and COLIV. p, parenchyma. (D) One month after CG injections (CG-Rec), the liver surface shows a similar phenotype as the normal liver (Ctr). Bar, 20 μm.
FIG. 5.
FIG. 5.
Alcohol feeding impairs resolution of CG-induced capsular fibrosis in mice. (A) After injection of tamoxifen and CG to Wt1CreERT2/+;R26TGfl/fl (n=6) and R26TGfl/fl (n=1) mice, mice were fed alcohol and HCFD for 1 month (CG-Alc). (B) Sirius red staining. In the CG-Alc model, thick capsular areas occasionally remain on the liver surface. (C) Quantification of the fibrotic areas stained with Sirius red on the liver surface. A red line represents the fibrotic area in the liver 1 month after CG injections shown in Fig. 3C. Compared to the CG-Rec model (red line), the CG-Alc model significantly impairs resolution of capsular fibrosis. Feeding of normal chow for 1 month (CG-Alc-Rec) does not reduce the capsular fibrosis areas induced by CG injections followed by alcohol feeding. * P< 0.05 against the CG-Alc model (red line). (D) After injection of tamoxifen and CG to Wt1CreERT2/+;R26TGfl/fl (n=6) and R26TGfl/fl (n=2) mice, mice were fed alcohol and HCFD for 1 month followed by regular chow feeding for 1 month (CG-Alc-Rec). (E) Oil red O staining of the livers. Alcoholic steatosis is ameliorated 1 month after withdrawal of alcohol. (F) Sirius red staining of the liver in the CG-Alc-Rec model. Bar, 20 μm.
FIG. 6.
FIG. 6.
Alcohol impairs resolution of capsular fibrosis induced by CG injections. Liver tissues were examined by immunofluorescence staining. (A) In the CG-Alc model, ACTA2+DES+ myofibroblasts remain in fibrotic areas positive for COLI and DCN on the liver surface. (B) In the CG-Alc-Rec model, myofibroblasts and CD45+ cells remain in the capsular fibrosis areas similar to A. (C-F) Lineage tracing of mesothelial cells in capsular fibrosis and in its resolution. (C) Arrows indicate mesothelial cell-derived myofibroblasts in CG-induced capsular fibrosis. (D) In the CG-Rec model, GFP expression is only observed in mesothelial cells (double arrowheads). (E) In the CG-Alc model, ACTA2+ myofibroblasts are largely negative for GFP. An arrow indicates rare GFP+ACTA2 fibroblasts at the interface between the fibrotic area and parenchyma. (F) In the CG-Alc-Rec model, ACTA2+ myofibroblasts are largely negative for GFP. An arrow indicates rare GFP+ACTA2 fibroblasts. Bars, 20 μm.
FIG. 7.
FIG. 7.
Differentiation of capsular fibroblasts to myofibroblasts in vitro. (A) Morphology of day 1 capsular fibroblasts and day 3 hepatic stellate cells isolated from the normal adult liver. Right panel shows autofluorescence of vitamin A in hepatic stellate cells. (B) mRNA expression. After digestion of the normal adult liver (All), we separated mesothelial cells (MC), blood lineage cells (Lin), and GPM6ALin capsular fibroblasts (CF). Representative data from 4 independent preparations was shown. (C) Morphology of capsular fibroblasts cultured on day 4 and 7. (D) Morphology of mesothelial cells cultured on day 2 and 7. (E) Immunofluorescence staining of VIM (red) and ACTA2 (green) in capsular fibroblasts cultured on day 1 and 7. Bars, 50 μm (A,C,D) and 20 μm (E). (F-H) RT-QPCR of cultured capsular fibroblasts from day 1 to 7 (F), treated with TGF-β1 (G), and treated with ethanol (ET) or acetaldehyde (ALD) (H). *P< 0.05 and **P< 0.01 (against day 1 in F or control in H).
FIG. 8.
FIG. 8.
Separation of myeloid lineage cells from mouse livers. (A-C) Cells from the liver surface were prepared from the control (n=4), CG (n=4), CG-Rec (n=3), and CG-Alc models (n=4) and were analyzed by FACS. The average ratios of Ly-6G+ neutrophils in CD45+ cells were shown in A. From the CD45+Ly-6G population, we separated CD11b+F4/80 monocytes in B. The average ratios of Ly-6CHigh, Ly-6CLow, and Ly-6C monocytes in CD11b+ cells were shown in C. (D) RT-QPCR of CD45+Ly-6G+ neutrophils sorted in A. (E-G) RT-QPCR of M2 markers (E), M1 markers (F), and Mmp13, Mmp9, and Timp1 mRNAs (G) in Ly-6CHigh, Ly-6CLow, and Ly-6C monocytes separated in C. *P< 0.05 and **P< 0.01.

Similar articles

Cited by

References

    1. Bataller R, Gao B. Liver fibrosis in alcoholic liver disease. Semin Liver Dis 2015;35:146–156. - PubMed
    1. Louvet A, Mathurin P. Alcoholic liver disease: mechanisms of injury and targeted treatment. Nat Rev Gastroenterol Hepatol 2015;12:231–242. - PubMed
    1. Nagy LE, Ding WX, Cresci G, Saikia P, Shah VH. Linking pathogenic mechanisms of alcoholic liver disease with clinical phenotypes. Gastroenterology 2016;150:1756–1768. - PMC - PubMed
    1. Tsuchida T, Friedman SL. Mechanisms of hepatic stellate cell activation. Nat Rev Gastroenterol Hepatol 2017;14:397–411. - PubMed
    1. Weiskirchen R, Weiskirchen S, Tacke F. Recent advances in understanding liver fibrosis: bridging basic science and individualized treatment concepts. F1000Res 2018;7. - PMC - PubMed

Publication types