. 2019 Aug;23(8):5048-5062.
doi: 10.1111/jcmm.14362. Epub 2019 Jun 17.

Knockdown of LncRNA SCAMP1 suppressed malignant biological behaviours of glioma cells via modulating miR-499a-5p/LMX1A/NLRC5 pathway

Affiliations

Knockdown of LncRNA SCAMP1 suppressed malignant biological behaviours of glioma cells via modulating miR-499a-5p/LMX1A/NLRC5 pathway

Zheqi Zong et al. J Cell Mol Med. 2019 Aug.

Abstract

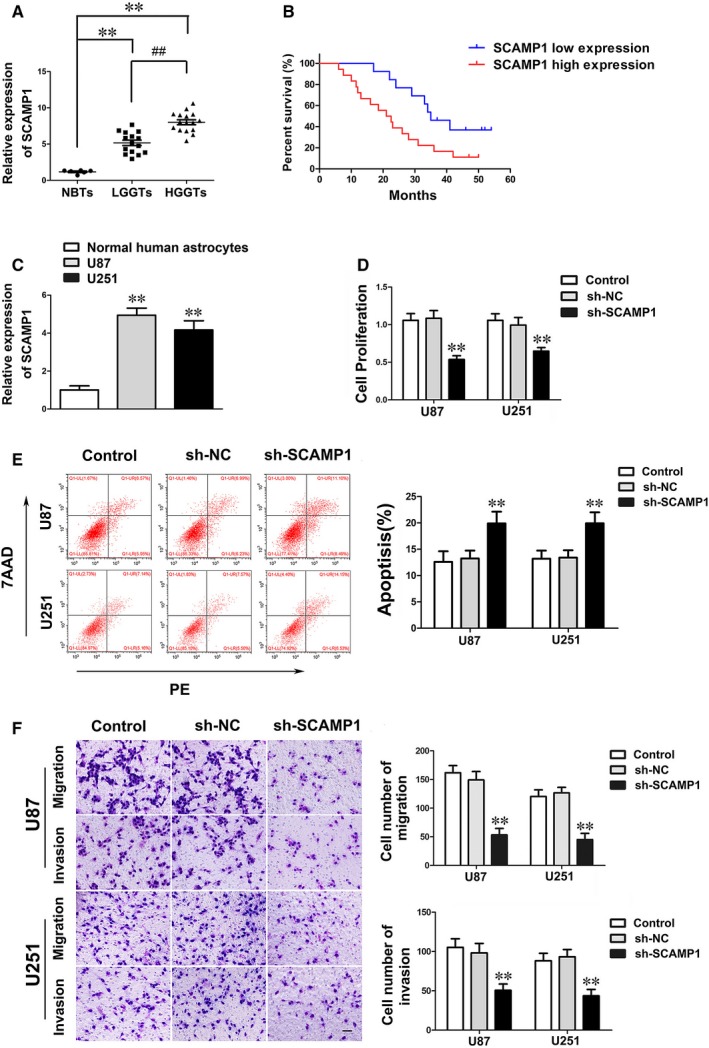
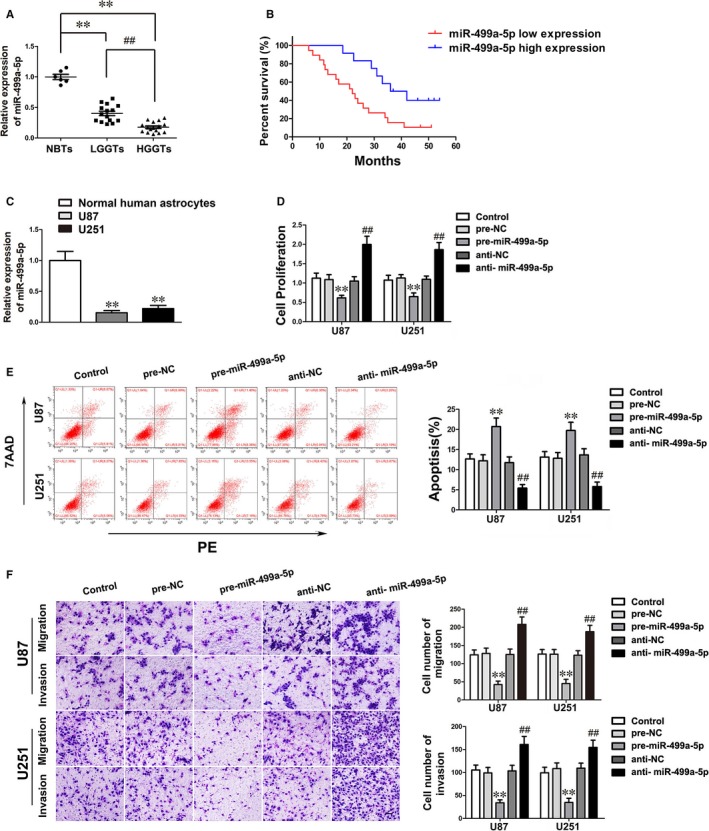
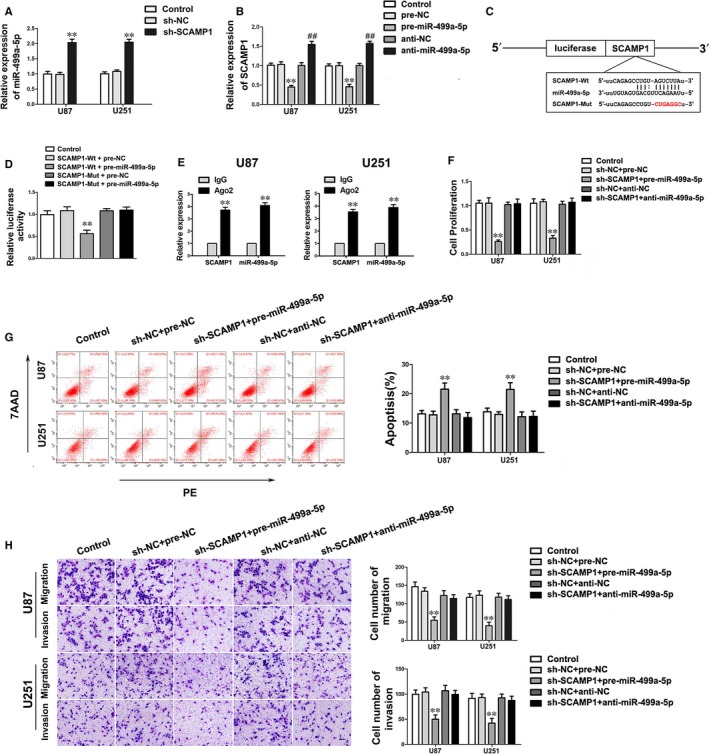
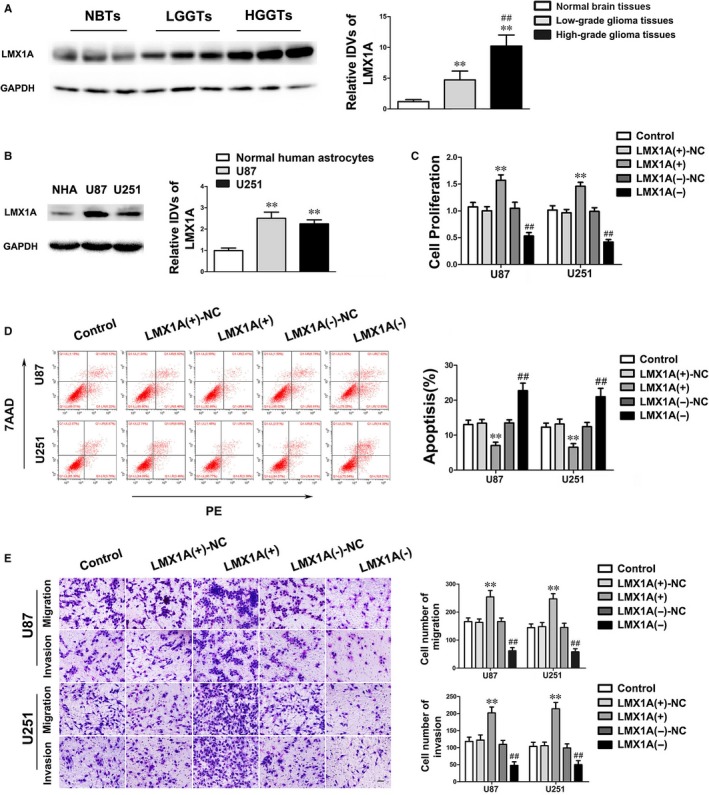
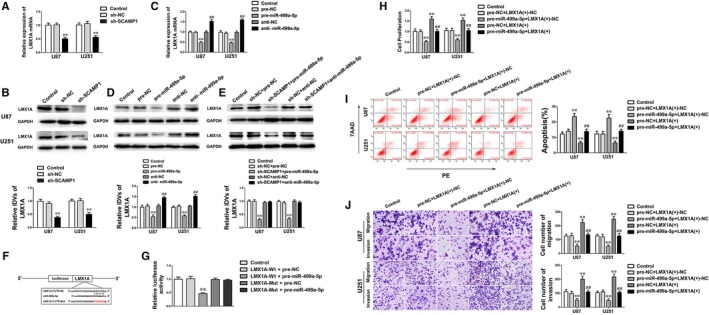
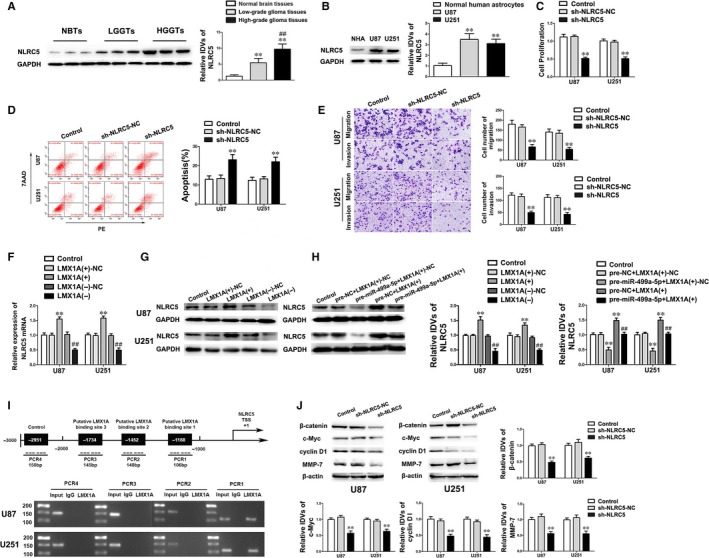
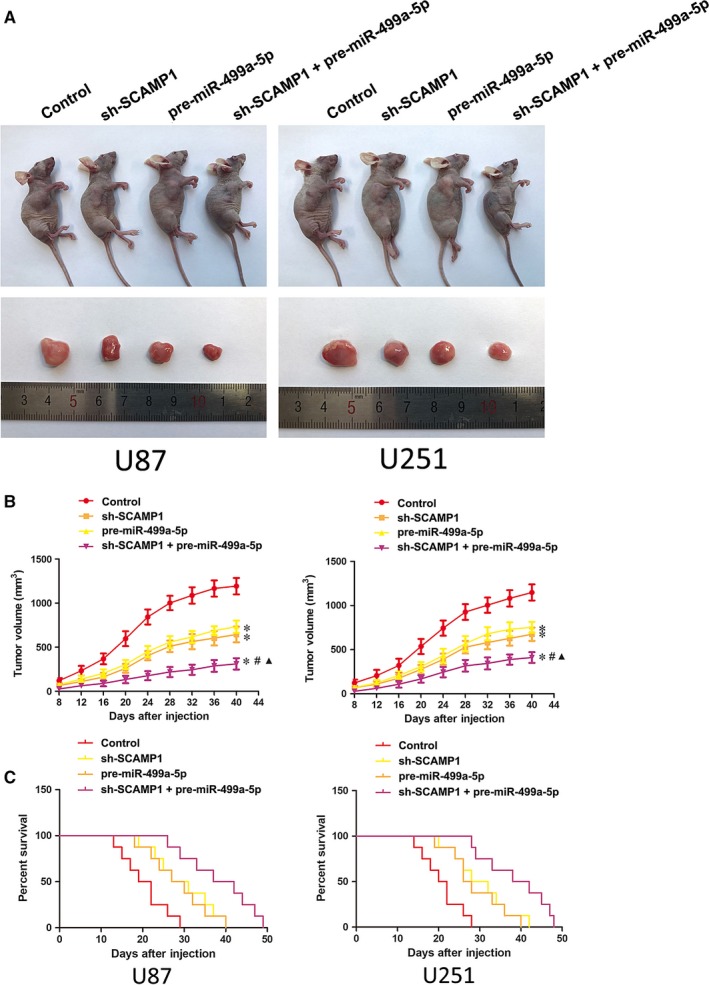
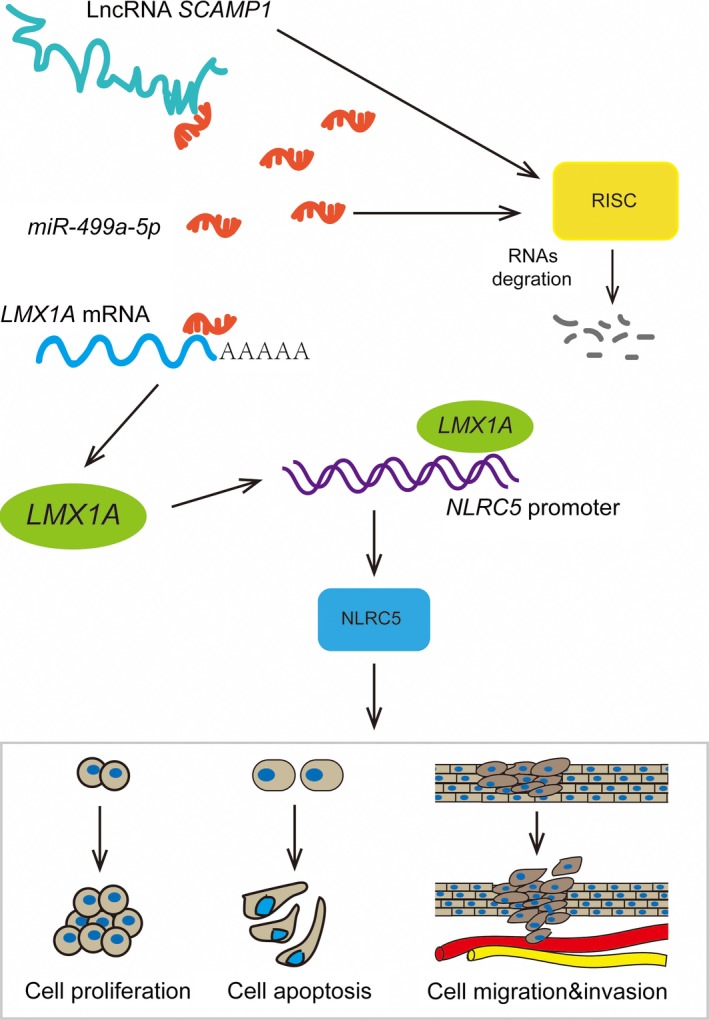
Dysregulation of long non-coding RNAs (lncRNAs) confirm that it plays a crucial role in tumourigenesis and malignant progression of glioma. The present study demonstrated that LncRNA secretory carrier membrane protein 1 (SCAMP1) was up-regulated and functioned as an oncogene in glioma cells. In addition, miR-499a-5p was down-regulated meanwhile exerted tumour-suppressive function in glioma cells. Subsequently, inhibition of SCAMP1 significantly restrained the cell proliferation, migration and invasion, as well as promoted apoptosis by acting as a molecular sponge of miR-499a-5p. Transcription factor LIM homeobox transcription factor 1, alpha (LMX1A) was overexpressed in glioma tissues and cells. Moreover, miR-499a-5p targeted LMX1A 3'-UTR in a sequence-specific manner. Hence, down-regulation of SCAMP1 remarkably reduced the expression level of LMX1A, indicating that LMX1A participated in miR-499a-5p-induced tumour-suppressive effects on glioma cells. Furthermore, knockdown of LMX1A decreased NLR family, CARD domain containing 5 (NLRC5) mRNA and protein expression levels through directly binding to the NLRC5 promoter region. Down-regulation of NLRC5 obviously inhibited malignant biological behaviours of glioma cells through attenuating the activity of Wnt/β-catenin signalling pathway. In conclusion, our study clarifies that SCAMP1/miR-499a-5p/LMX1A/NLRC5 axis plays a critical role in modulating malignant progression of glioma cells, which provide a novel therapeutic strategy for glioma treatment.

Keywords: LMX1A; NLRC5; SCAMP1; glioma; long non-coding RNAs; miR-499a-5p.


Conflict of interest statement

The authors declare no conflict of interest.

Figures

Figure 1
Figure 1
LncRNA SCAMP1 was overexpressed and played oncogenic role in glioma. (A) The expression levels of SCAMP1 were up‐regulated in glioma tissues. Data are presented as the mean ± SD (n = 6, NBTs; n = 15, LGGTs; n = 16, HGGTs). **P < 0.01 vs NBTs group; ## P < 0.01 vs LGGTs group. (B) Kaplan‐Meier survival analyses showed that the glioma patients with high expression of SCAMP1 indicated poorer overall survival (log‐rank test, P = 0.022). The mean of SCAMP1 expression was used as cut‐off. (C) The SCAMP1 expression levels in NHA and glioma cell lines. Data are presented as the mean ± SD (n = 3, each group). **P < 0.01 vs NHA group. (D) CCK‐8 assay was used to determine the proliferation of U87 and U251 cells treated with SCAMP1 knockdown. (E) The results of flow cytometry analysis in U87 and U251 cells treated with SCAMP1 knockdown. (F) Quantification cell number and representative images of migration and invasion in U87 and U251 cells treated with SCAMP1 knockdown were presented. Scale bars represent 40 μm. Data are given as mean ± SD (n = 3, each group). **P < 0.01 vs sh‐NC group
Figure 2
Figure 2
miR‐499a‐5p was low expressed and manifested a tumour suppressor in glioma. (A) The expression levels of miR‐499a‐5p were down‐regulated in glioma tissues. Data are presented as the mean ± SD (n = 6, NBTs; n = 15, LGGTs; n = 16, HGGTs). **P < 0.01 vs NBTs group; ## P < 0.01 vs LGGTs group. (B) Glioma patients with low expression of miR‐499a‐5p exhibited worse overall survival (log‐rank test, P = 0.011). The mean of miR‐499a‐5p expression was used as cut‐off. (C) The expression levels of miR‐499a‐5p in NHA, U87 and U251 cells. Data are presented as the mean ± SD (n = 3, each group). **P < 0.01 vs NHA group. (D‐F) The effects of miR‐499a‐5p on malignant biological behaviours of U87 and U251 cells were presented by CCK‐8 assay, flow cytometry analysis and transwell assay. Scale bars in transwell assay represent 40 μm. Data are given as mean ± SD (n = 3, each group). **P < 0.01 vs pre‐NC group; ## P < 0.01 vs anti‐NC group
Figure 3
Figure 3
SCAMP1 was a target of miR‐499a‐5p, moreover, miR‐499a‐5p could mediate the effects of SCAMP1 knockdown on glioma cells. (A) The expression of miR‐499a‐5p after SCAMP1 knockdown in glioma cells. Data are presented as the mean ± SD (n = 3, each group). **P < 0.01 vs sh‐NC group. (B) The expression of SCAMP1 in U87 and U251 cells transfected with miR‐499a‐5p agomir and antagomir. Data are presented as the mean ± SD (n = 3, each group). **P < 0.01 vs pre‐NC group; ## P < 0.01 vs anti‐NC group. (C‐D) The predicted miR‐499a‐5p binding site in the SCAMP1 sequence (SCAMP1‐Wt) and the designed mutant sequence of miR‐499a‐5p binding site (SCAMP1‐Mut) are indicated. Relative luciferase activity was detected after cells were co‐transfected with pre‐miR‐499a‐5p and SCAMP1‐Wt or SCAMP1‐Mut. Data are presented as the mean ± SD (n = 3, each group). **P < 0.01 vs SCAMP1‐Wt + pre‐NC group. (E) miR‐499a‐5p was identified in the SCAMP1‐RISC complex. SCAMP1 and miR‐499a‐5p enrichment were measured using qRT‐PCR. Data represent mean ± SD (n = 3, each group). **P < 0.01 vs anti‐IgG group. (F‐H) The malignant biological behaviours of U87 and U251 cells co‐transfected with sh‐SCAMP1 and miR‐499a‐5p agomir or antagomir were measured by CCK‐8 assay, flow cytometry analysis and transwell assay. Scale bars in transwell assay represent 40 μm. Data are presented as the mean ± SD (n = 3, each group). **P < 0.01 vs sh‐NC + pre‐NC group
Figure 4
Figure 4
LMX1A was up‐regulated and exerted cancerogenic functions in glioma. (A) The protein expression levels of LMX1A in NBTs, LGGTs and HGGTs were detected by Western blot. Data are presented as the mean ± SD (n = 6, NBTs; n = 15, LGGTs; n = 16, HGGTs). **P < 0.01 vs NBTs group; ## P < 0.01 vs LGGTs group. (B) The endogenous expression levels of LMX1A in NHA and glioma cell lines U87 and U251. (C‐E) The effects of LMX1A on malignant biological behaviours of U87 and U251 cells were presented by CCK‐8 assay, flow cytometry analysis and transwell assay. Scale bars in transwell assay represent 40 μm. Data are given as mean ± SD (n = 3, each group). **P < 0.01 vs LMX1A(+)‐NC group; ## P < 0.01 vs LMX1A(−)‐NC group
Figure 5
Figure 5
LMX1A was a target of miR‐499a‐5p and rescued the tumour inhibitory effects of miR‐499a‐5p. (A‐B) qRT‐PCR and Western blot assay were used to detect the LMX1A expression after SCAMP1 knockdown. (C‐D) qRT‐PCR and Western blot assay were used to examine the LMX1A expression of U87 and U251 cells after altered miR‐499a‐5p expression. (E) Western blot assay was used to detect the LMX1A expression of U87 and U251 cells co‐transfected with SCAMP1 and miR‐499a‐5p. (F) The potential miR‐499a‐5p binding sites in LMX1A‐3′‐UTR and the designed mutant sequence are indicated. (G) Relative luciferase activity was detected after cells were co‐transfected with pre‐miR‐499a‐5p and LMX1A‐Wt or LMX1A‐Mut. Data are presented as the mean ± SD (n = 3, each group). **P < 0.01 vs LMX1A‐Wt + pre‐NC group. (H‐J) The malignant biological behaviours of U87 and U251 cells co‐transfected with miR‐499a‐5p and LMX1A were detected by CCK‐8 assay, flow cytometry analysis and transwell assay. Scale bars in transwell assay represent 40 μm. Data are presented as the mean ± SD (n = 3, each group). **P < 0.01 vs pre‐NC + LMX1A (+)‐NC group, ## P < 0.01 vs pre‐miR‐499a‐5p + LMX1A (+)‐NC group
Figure 6
Figure 6
NLRC5 was a downstream target of LMX1A and conducted oncogenic effects on glioma cells by activating the Wnt/β‐catenin signalling pathway. (A) The expression levels of NLRC5 in NBTs and glioma tissues were detected by Western blot. Data are presented as the mean ± SD (n = 6, NBTs; n = 15, LGGTs; n = 16, HGGTs). **P < 0.01 vs NBTs group; ## P < 0.01 vs LGGTs group. (B) The expression levels of NLRC5 in NHA and glioma cell lines. Data are presented as the mean ± SD (n = 3, each group). **P < 0.01 vs NHA group. (C‐E) The effects of NLRC5 on malignant biological behaviours of U87 and U251 cells were investigated by CCK‐8 assay, flow cytometry analysis and transwell assay. Scale bars in transwell assay represent 40 μm. Data are presented as mean ± SD (n = 3, each group). **P < 0.01 vs sh‐NLRC5‐NC group. (F‐G) The mRNA and protein expression levels of NLRC5 were measured by qRT‐PCR and Western blot. Data are presented as the mean ± SD (n = 3, each group). **P < 0.01 vs LMX1A(+)‐NC group; ## P < 0.01 vs LMX1A(−)‐NC group. (H) Western blot assay showed that the NLRC5 expression was regulated by miR‐499a‐5p and LMX1A. Data are presented as the mean ± SD (n = 3, each group). **P < 0.01 vs pre‐NC + LMX1A(+)‐NC group, ## P < 0.01 vs pre‐miR‐499a‐5p + LMX1A(+)‐NC group. (I) ChIP assay demonstrated that LMX1A directly bound to the promoter of NLRC5 in U87 and U251 cells. As schematic representation displayed, the putative LMX1A binding site located at the NLRC5 promoter region 1168 bp upstream of TSS. Immunoprecipitated DNA was amplified by PCR. Normal rabbit IgG was used as a negative control. (J) Western blot assay showed the expression levels of β‐catenin, c‐Myc, cyclin D1, MMP‐7 in U87 and U251 cells treated with NLRC5 knockdown. Data are presented as the mean ± SD (n = 3, each group). **P < 0.01 vs sh‐NLRC5‐NC group
Figure 7
Figure 7
In vivo study. (A) The nude mice and the sample tumours from respective groups were shown. (B) Tumour xenograft growth curves in subcutaneous implantation assay were shown. Tumour volume was calculated every 4 days after injection and the tumour was resected after 40 days. Data represent mean ± SD (n = 10, each group). *P < 0.05 vs control group, # P < 0.05 vs sh‐SCAMP1 group, P < 0.05 vs pre‐miR‐499a‐5p group. (C) Survival curves from representative nude mice injected into the right striatum in orthotopic inoculations assay were shown (n = 10, each group). P < 0.05 (sh‐SCAMP1, pre‐miR‐499a‐5p and sh‐SCAMP1 + pre‐miR‐499a‐5p groups vs control group)
Figure 8
Figure 8
The schematic diagram underlying the mechanism of SCAMP1/miR‐499a‐5p/LMX1A/NLRC5 axis in glioma cells

Similar articles

Cited by

References

    1. Ostrom QT, Gittleman H, Liao P, et al. CBTRUS Statistical Report: Primary brain and other central nervous system tumors diagnosed in the United States in 2010‐2014. Neuro Oncol. 2017;19:v1‐88. - PMC - PubMed
    1. Liu X, Zheng J, Xue Y, et al. Inhibition of TDP43‐mediated SNHG12‐miR‐195‐SOX5 feedback loop impeded malignant biological behaviors of glioma cells. Mol Ther Nucleic Acids. 2018;10:142‐158. - PMC - PubMed
    1. Spinelli GP, Miele E, Lo Russo G, et al. Chemotherapy and target therapy in the management of adult high‐grade gliomas. Curr Cancer Drug Targets. 2012;12:1016‐1031. - PubMed
    1. Van Meir EG, Hadjipanayis CG, Norden AD, et al. Exciting new advances in neuro‐oncology: the avenue to a cure for malignant glioma. CA Cancer J Clin. 2010;60:166‐193. - PMC - PubMed
    1. Wang KC, Chang HY. Molecular mechanisms of long noncoding RNAs. Mol Cell. 2011;43:904‐914. - PMC - PubMed

Publication types

MeSH terms