. 2019 Jun;79(6):578-595.
doi: 10.1002/dneu.22704. Epub 2019 Jun 25.

Cortical and Commissural Defects Upon HCF-1 Loss in Nkx2.1-Derived Embryonic Neurons and Glia

Affiliations

Cortical and Commissural Defects Upon HCF-1 Loss in Nkx2.1-Derived Embryonic Neurons and Glia

Shilpi Minocha et al. Dev Neurobiol. 2019 Jun.

Abstract

Formation of the cerebral cortex and commissures involves a complex developmental process defined by multiple molecular mechanisms governing proliferation of neuronal and glial precursors, neuronal and glial migration, and patterning events. Failure in any of these processes can lead to malformations. Here, we study the role of HCF-1 in these processes. HCF-1 is a conserved metazoan transcriptional co-regulator long implicated in cell proliferation and more recently in human metabolic disorders and mental retardation. Loss of HCF-1 in a subset of ventral telencephalic Nkx2.1-positive progenitors leads to reduced numbers of GABAergic interneurons and glia, owing not to decreased proliferation but rather to increased apoptosis before cell migration. The loss of these cells leads to development of severe commissural and cortical defects in early postnatal mouse brains. These defects include mild and severe structural defects of the corpus callosum and anterior commissure, respectively, and increased folding of the cortex resembling polymicrogyria. Hence, in addition to its well-established role in cell proliferation, HCF-1 is important for organ development, here the brain.

Keywords: GABAergic neurons; Nkx2.1; anterior commissure; corpus callosum; cortex; glia; polymicrogyria.


Conflict of interest statement

The authors declare that there are no conflicts of interest.

Figures

Figure 1
Figure 1
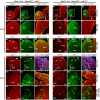
Hcfc1 is broadly expressed in the mouse postnatal brain. (A–C) Immunofluorescence analysis of cryo‐sections from wildtype C57BL6 brains at P0 stained with DAPI (blue) and antibody against HCF‐1 (green). Staining with only anti‐HCF‐1 (A1, B1, and C1) and colocalization between anti‐HCF‐1 and DAPI staining (A2, B2, and C2) is shown in cortex (Ctx; A), corpus callosum (CC; B), and anterior commissure (AC; C) region. (D) Immunofluorescence analysis of cryo‐sections from wildtype C57BL6 brains at P0 stained with antibodies against HCF‐1 (green) and astroglial marker, glial fibrillary acidic protein (GFAP; red). The inset shows a GFAP‐positive glia at higher magnification. (E) Immunofluorescence analysis of cryo‐sections from wildtype C57BL6 brains at P0 stained with antibodies against HCF‐1 (green) and neuronal marker, NeuN (red). (F) Immunofluorescence analysis of cryo‐sections from wildtype C57BL6 brains at P0 stained with antibodies against HCF‐1 (green) and oligodendrocyte marker, Olig2 (red). Scale bars are indicated in the figure.
Figure 2
Figure 2
Nkx2.1‐Cre mediated loss of HCF‐1 leads to decreased generation of ventral telencephalic cells. Immunofluorescence analysis of cryo‐sections from control Nkx2.1‐Cre +; Rosa‐GFP +; Hcfc1+/Y (A, C, D, I, K, and O) and knockout Nkx2.1‐Cre +; Rosa‐GFP +; Hcfc1lox/Y (B, E, F, J, M, and P) embryonic brains at E12.5 (A‐to‐F) and E14.5 (I‐to‐P) stained with antibodies against HCF‐1 (red) and GFP (green). The boxed region of medial ganglionic eminence (MGE) shown in A, B, I, and J is shown as higher magnification in C, E, K, and M, respectively. The HCF‐1 (red) and GFP (green) staining in boxed region in A3, B3, I3, and J3 is shown at higher magnification in D, F, L, and N, respectively. A single layer from the confocal stack shown in K and M is shown in O and P, respectively. (G‐H) Immunofluorescence analysis of cryo‐sections from control Nkx2.1‐Cre +; Rosa‐GFP +; Hcfc1+/Y (G) and knockout Nkx2.1‐Cre +; Rosa‐GFP +; Hcfc1lox/Y (H) embryonic brains at E12.5 stained with antibodies against HCF‐1 (red) and proliferation marker, Ki67 (green). CP, cortical plate; IZ, intermediate zone; MZ, marginal zone; SVZ, sub‐ventricular zone; VZ, ventricular zone. Scale bars are indicated in the figure.
Figure 3
Figure 3
The Nkx2.1‐Cre mediated recombination inducible Rosa‐GFP reporter faithfully identifies conditional knockout allele‐containing cells. Immunofluorescence analysis of cryo‐sections from control Nkx2.1‐Cre +; Rosa‐GFP +; Hcfc1+/Y (A) and knockout Nkx2.1‐Cre +; Rosa‐GFP +; Hcfc1lox/Y (B) embryonic brains at E14.5 stained with antibodies against HCF‐1 (red) and GFP (green). The arrows point to Hcfc1 + allele‐containing cells that are GFP‐positive and HCF‐1‐positive (A) and Hcfc1lox allele‐containing cells that are GFP‐positive and HCF‐1‐negative (B), respectively. Scale bars are indicated in the figure.
Figure 4
Figure 4
Nkx2.1‐Cre mediated loss of HCF‐1 causes decreased migration and increased cell death of ventral telencephalic cells. (A) Graph showing the relative number of GFP+ migratory cells outside MGE region in control Nkx2.1‐Cre+; Rosa‐GFP +; Hcfc1+/Y (n = 2 at E12.5; n = 2 at E14.5; shown as Hcfc1+/Y) and mutant Nkx2.1‐Cre +; Rosa‐GFP +; Hcfc1lox/Y (n = 2 at E12.5; n = 3 at E14.5; shown as Hcfc1lox/Y) brains at E12.5 and E14.5. The number of GFP+ migratory cells outside MGE region in Nkx2.1‐Cre+; Rosa‐GFP +; Hcfc1+/Y control brains was calculated, and the mean value was set as 100%. The percentage of GFP+ migratory cells outside MGE region in Nkx2.1‐Cre +; Rosa‐GFP +; Hcfc1lox/Y mutant brains was then calculated relative to the value in control sections. The difference between relative percentage of GFP+ migratory cells outside MGE region in control Nkx2.1‐Cre+; Rosa‐GFP +; Hcfc1+/Y and knockout Nkx2.1‐Cre +; Rosa‐GFP +; Hcfc1lox/Y brains at E12.5 was significant (P‐value 0.05). The difference between relative percentage of GFP+ migratory cells outside MGE region in control Nkx2.1‐Cre+; Rosa‐GFP +; Hcfc1+/Y and knockout Nkx2.1‐Cre +; Rosa‐GFP +; Hcfc1lox /Y brains at E14.5 was significant (P‐value 0.003). (B) Graph showing the number of Ki67+ cells in ventricular zone (VZ) of control Nkx2.1‐Cre+; Rosa‐GFP +; Hcfc1+/Y (n = 3; shown as Hcfc1+/Y) and knockout Nkx2.1‐Cre +; Rosa‐GFP +; Hcfc1lox/Y (n = 2; shown as Hcfc1lox/Y) brains at E12.5. The difference between number of Ki67+ cells in control Nkx2.1‐Cre+; Rosa‐GFP +; Hcfc1+/Y and knockout Nkx2.1‐Cre +; Rosa‐GFP +; Hcfc1lox/Y brains was not significant. (C) Graph showing the number of TUNEL+ cells in control Nkx2.1‐Cre+; Rosa‐GFP +; Hcfc1+/Y (n = 3 at E12.5; n = 2 at E14.5; shown as Hcfc1+/Y) and knockout Nkx2.1‐Cre +; Rosa‐GFP +; Hcfc1lox/Y (n = 5 at E12.5; n = 3 at E14.5; shown as Hcfc1lox/Y) brains at E12.5 and E14.5. The difference between number of TUNEL+ cells in control Nkx2.1‐Cre+; Rosa‐GFP +; Hcfc1+/Y and knockout Nkx2.1‐Cre +; Rosa‐GFP +; Hcfc1lox/Y brains at E12.5 was significant (P‐value 0.008). The difference between number of TUNEL+ cells in control Nkx2.1‐Cre+; Rosa‐GFP +; Hcfc1+/Y and knockout Nkx2.1‐Cre +; Rosa‐GFP +; Hcfc1lox/Y brains at E14.5 was significant (P‐value 0.02). (D) Graph showing the relative number of GFP+ cells in cortices of control Nkx2.1‐Cre+; Rosa‐GFP +; Hcfc1+/Y (n = 3; shown as Hcfc1+/Y) and knockout Nkx2.1‐Cre +; Rosa‐GFP +; Hcfc1lox/Y (n = 3; shown as Hcfc1lox/Y) brains at P0. The number of cortical GFP+ cells in Nkx2.1‐Cre+; Rosa‐GFP +; Hcfc1+/Y control brains was calculated, and the mean value was set as 100%. The percentage of cortical GFP+ cells in Nkx2.1‐Cre +; Rosa‐GFP +; Hcfc1lox/Y mutant brains was then calculated relative to the value in control sections. The difference between relative percentage of cortical GFP+ cells in control Nkx2.1‐Cre+; Rosa‐GFP +; Hcfc1+/Y and knockout Nkx2.1‐Cre +; Rosa‐GFP +; Hcfc1lox/Y brains was significant (P‐value 0.001).
Figure 5
Figure 5
Hcfc1‐conditional knockout embryonic brains display increased incidence of cell death. TUNEL assay was performed on cryo‐sections from control Nkx2.1‐Cre +; Rosa‐GFP +; Hcfc1+/Y (A, C, E, and G) and knockout Nkx2.1‐Cre +; Rosa‐GFP +; Hcfc1lox/Y (B, D, F, and H) embryonic brains at E12.5 (A‐to‐D) and E14.5 (E‐to‐H) co‐stained with DAPI (blue) and antibody against Nestin (red). TUNEL‐positive apoptotic cells are shown in green. The medial ganglionic eminence (MGE) region shown in A, B, E, and F is shown as higher magnification in C, D, G, and H, respectively. SVZ, sub‐ventricular zone; VZ, ventricular zone. Scale bars are indicated in the figure.
Figure 6
Figure 6
Nkx2.1‐Cre mediated loss of HCF‐1 leads to decreased presence of Nkx2.1‐derived cells in the postnatal brains. Immunofluorescence analysis of cryo‐sections from control Nkx2.1‐Cre +; Rosa‐GFP +; Hcfc1+/Y (A, C, and E) and knockout Nkx2.1‐Cre +; Rosa‐GFP +; Hcfc1lox/Y (B, D, and F) brains at P0 stained with DAPI (blue) and antibody against GFP (green). Both anti‐GFP and DAPI staining (A2, B2, and C2) and only anti‐GFP staining (A1, B1, and C1) is shown in cortex (Ctx; A and B), corpus callosum (CC) and surrounding region (C and D), and anterior commissure (AC) and surrounding region (E and F). The panels show confocal images obtained by tiling and stitching nine adjacent regions, acquired with 10x objective, together to display larger areas. AEP, anterior endopenducular area; IG, indusium griseum; LV, lateral ventricles, SEP, septum; Str, striatum; POA, anterior preoptic area. Scale bars are indicated in the figure.
Figure 7
Figure 7
Nkx2.1‐Cre mediated loss of HCF‐1 leads to decreased presence of glial cells and reduced corpus callosum width in the postnatal brains. (A‐B) Immunofluorescence analysis of cryo‐sections from Nkx2.1‐Cre; Hcfc1lox/Y (A) and Nkx2.1‐Cre+; Hcfc1lox/Y (B) male brains at P1 stained with DAPI (blue) and antibodies against GFAP (green) and HCF‐1 (red). The boxed region in A1 and B1 is shown at higher magnification in A2 and B2, respectively. The two‐sided arrow line in A2 and B2 depicts the thickness of the corpus callosum (CC). IG, indusium griseum; GW, glial wedge; MZG, midline zipper glia. Scale bars are indicated in the figure. (C) Graph showing the relative percentages of GFAP+‐glia within the CC in control Nkx2.1‐Cre; Hcfc1lox/Y (n = 2) and knockout Nkx2.1‐Cre+; Hcfc1lox/Y (n = 3) male brains at P1. The number of GFAP+‐glia within the CC of Nkx2.1‐Cre; Hcfc1lox/Y control brains was calculated, and the mean value was set as 100%. The percentage of GFAP+‐glia within the CC of Nkx2.1‐Cre+; Hcfc1lox /Y mutant brains was then calculated relative to the value in control sections. The difference between relative percentages of GFAP+‐glia within the CC in control Nkx2.1‐Cre; Hcfc1lox/Y and knockout Nkx2.1‐Cre+; Hcfc1lox/Y male brains was significant (P‐value 0.005). (D) Graph showing the relative percentages of Olig2+‐cells within the CC in control Nkx2.1‐Cre; Hcfc1lox/Y (n = 3) and knockout Nkx2.1‐Cre+; Hcfc1lox/Y (n = 3) male brains at P1. The number of Olig2+‐cells within the CC of Nkx2.1‐Cre; Hcfc1lox/Y control brains was calculated, and the mean value was set as 100%. The percentage of Olig2+‐cells within the CC of Nkx2.1‐Cre+; Hcfc1lox/Y mutant brains was then calculated relative to the value in control sections. The difference between relative percentages of Olig2+‐cells within the CC in control Nkx2.1‐Cre; Hcfc1lox/Y and knockout Nkx2.1‐Cre+; Hcfc1lox/Y male brains was significant (P‐value 0.047). (E) Graph showing the width of corpus callosum (CC) of control Nkx2.1‐Cre; Hcfc1lox/Y (n = 3) and knockout Nkx2.1‐Cre +; Hcfc1lox/Y (n = 3) brains at P0. The difference between the width of corpus callosum (CC) of control Nkx2.1‐Cre; Hcfc1lox/Y and knockout Nkx2.1‐Cre +; Hcfc1lox/Y brains was significant (P‐value 0.007).
Figure 8
Figure 8
Nkx2.1‐Cre mediated loss of HCF‐1 causes defects in proper formation of anterior commissure. (A‐D) Immunofluorescence analysis of cryo‐sections from control Nkx2.1‐Cre ; Hcfc1lox/Y (A and C) and knockout Nkx2.1‐Cre +; Hcfc1lox/Y (B and D) embryonic brains at E18.5 stained with DAPI (blue) and antibodies against astroglial marker, glial fibrillary acidic protein (GFAP; green) and axonal marker, L1 cell adhesion molecule (red). The boxed region in A1 and B1 is shown at higher magnification in C and D, respectively. Co‐labeling with DAPI, GFAP, and L1 is shown in A1, B1, C1, and D1, whereas labeling with only L1 is shown in A2, B2, C2, and D2. (E–F) Immunofluorescence analysis of cryo‐sections from control Nkx2.1‐Cre ; Hcfc1lox/Y (E) and knockout Nkx2.1‐Cre +; Hcfc1lox/Y (F) embryonic brains at E18.5 stained with DAPI (blue) and antibodies against GFAP (green) and HCF‐1 (red). Co‐labeling with DAPI, GFAP, and HCF‐1 is shown in E1 and F1, whereas labeling with only GFAP is shown in E2 and F2. AC, anterior commissure. Scale bars are indicated in the figure.
Figure 9
Figure 9
Nkx2.1‐Cre mediated loss of HCF‐1 causes severe cortical defects. Nissl staining of paraffin‐embedded sections from control Nkx2.1‐Cre; Hcfc1lox/Y (A, C, E, G, and I) and knockout Nkx2.1‐Cre+; Hcfc1lox/Y (B, D, F, H, and J) male brains at P1. (A–F) Three representative coronal sections arranged from rostral‐to‐caudal poles of the control Nkx2.1‐Cre; Hcfc1lox/Y (A, C, and E) and knockout Nkx2.1‐Cre+; Hcfc1lox/Y (B, D, and F) male brains are shown. (G–J) Higher magnification views of the cortical region from Nkx2.1‐Cre; Hcfc1lox/Y (G and I) and Nkx2.1‐Cre+; Hcfc1lox/Y (H and J) male brains are shown. Cortical layers from I‐to‐VI are indicated in the control Nkx2.1‐Cre; Hcfc1lox/Y brains. Only four clearly discernible layers i‐to‐iv are labeled in knockout Nkx2.1‐Cre+; Hcfc1lox/Y brains. AC, anterior commissure; CC, corpus callosum; Ctx, cortex; HIC, hippocampal commissure; LV, lateral ventricle. Scale bars are indicated in the figure. (K) Graph showing the cortical thickness of control Nkx2.1‐Cre; Hcfc1lox/Y (n = 9) and knockout Nkx2.1‐Cre +; Hcfc1lox/Y (n = 21) brains at P0. The difference between cortical thickness in control Nkx2.1‐Cre; Hcfc1lox/Y and knockout Nkx2.1‐Cre +; Hcfc1lox/Y brains was highly significant (P‐value 6.65 × 10−7).
Figure 10
Figure 10
Nkx2.1‐Cre mediated loss of HCF‐1 causes alterations in cortical lamination. Immunofluorescence analysis of cryo‐sections from control Nkx2.1‐Cre ; Hcfc1lox/Y (A, C, E, G, I, K, and M) and knockout Nkx2.1‐Cre +; Hcfc1lox/Y (B, D, F, H, J, L, and N) brains at P1 stained with DAPI (blue) and antibodies against cortical neuronal markers, namely Reelin (red; A and B); Calretinin (green; C and D); Parvalbumin (green; E and F); Cux1 (green; G and H); SatB2 (red; I and J); Calbindin (green; K and L); Ctip2 (green; M and N); and Tbr1 (green; O and P). Left‐side panels show staining with only the labeled marker (A1, B1, C1, D1, E1, F1, G1, H1, I1, J1, K1, L1, M1, N1, O1, and P1), whereas the right‐side panels show co‐staining of labeled marker and DAPI (A2, B2, C2, D2, E2, F2, G2, H2, I2, J2, K2, L2, M2, N2, O2, and P2). The arrowheads in A and B point to Reelin‐positive cells. The arrowheads in C and D point to Calretinin‐positive cells. The arrowheads in G and H point to Cux1‐positive cells. Ctx, cortex. Scale bars are indicated in the figure.

Similar articles

Cited by

References

    1. Anderson, S.A. , Marin, O. , Horn, C. , Jennings, K. and Rubenstein, J.L. (2001) Distinct cortical migrations from the medial and lateral ganglionic eminences. Development, 128, 353–363. - PubMed
    1. Barkovich, A.J. (2010) Current concepts of polymicrogyria. Neuroradiology, 52, 479–487. - PMC - PubMed
    1. Barkovich, A.J. , Kuzniecky, R.I. , Jackson, G.D. , Guerrini, R. and Dobyns, W.B. (2005) A developmental and genetic classification for malformations of cortical development. Neurology, 65, 1873–1887. - PubMed
    1. Benadiba, C. , Magnani, D. , Niquille, M. , Morle, L. , Valloton, D. , Nawabi, H. , et al (2012) The ciliogenic transcription factor RFX3 regulates early midline distribution of guidepost neurons required for corpus callosum development. PLoS Genetics, 8, e1002606. - PMC - PubMed
    1. Bonneau, D. , Toutain, A. , Laquerriere, A. , Marret, S. , Saugier‐Veber, P. , Barthez, M.A. , et al (2002) X‐linked lissencephaly with absent corpus callosum and ambiguous genitalia (XLAG): clinical, magnetic resonance imaging, and neuropathological findings. Annals of Neurology, 51, 340–349. - PubMed

Publication types