

A comparative assessment of dilution correction methods for spot urinary analyte concentrations in a UK population exposed to arsenic in drinking water
- PMID: 31207477
- PMCID: PMC6686075
- DOI: 10.1016/j.envint.2019.03.069
A comparative assessment of dilution correction methods for spot urinary analyte concentrations in a UK population exposed to arsenic in drinking water
Abstract
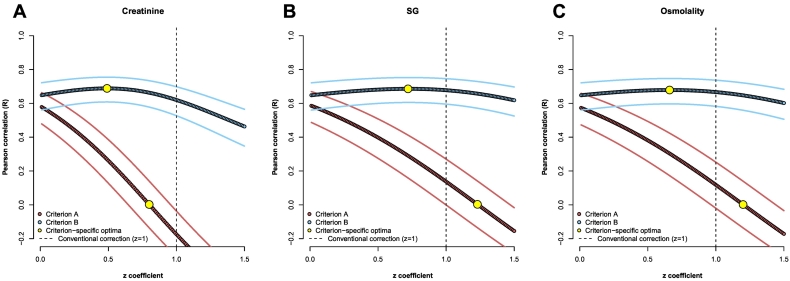
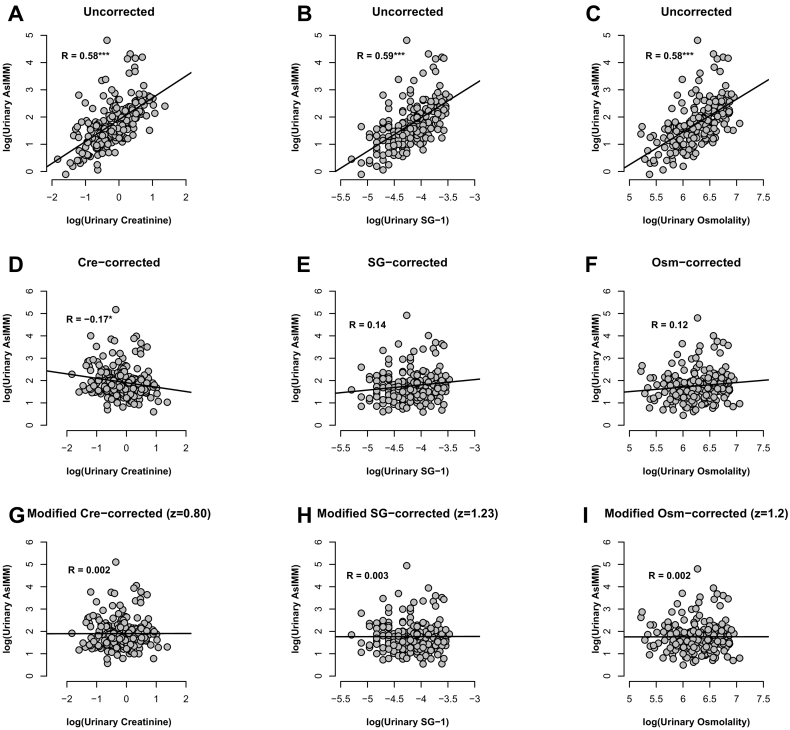
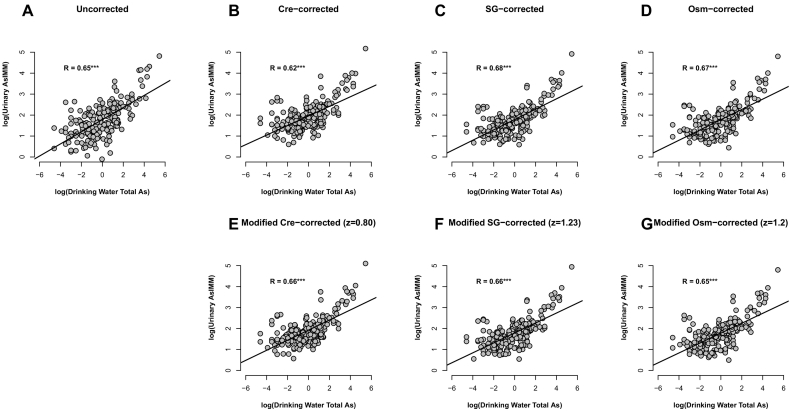
Spot urinary concentrations of environmental exposure biomarkers require correction for dilution. There is no consensus on the most appropriate method, with creatinine used by default despite lacking theoretical robustness. We comparatively assessed the efficacy of creatinine; specific gravity (SG); osmolality and modifications of all three for dilution correcting urinary arsenic. For 202 participants with urinary arsenic, creatinine, osmolality and SG measurements paired to drinking water As, we compared the performance corrections against two independent criteria: primarily, (A) correlations of corrected urinary As and the dilution measurements used to correct them - weak correlations indicating good performance and (B) correlations of corrected urinary As and drinking water As - strong correlations indicating good performance. More than a third of variation in spot urinary As concentrations was attributable to dilution. Conventional SG and osmolality correction removed significant dilution variation from As concentrations, whereas conventional creatinine over-corrected, and modifications of all three removed measurable dilution variation. Modified creatinine and both methods of SG and osmolality generated stronger correlations of urinary and drinking water As concentrations than conventional creatinine, which gave weaker correlations than uncorrected values. A disparity in optima between performance criteria was observed, with much smaller improvements possible for Criterion B relative to A. Conventional corrections - particularly creatinine - limit the utility spot urine samples, whereas a modified technique outlined here may allow substantial improvement and can be readily retrospectively applied to existing datasets. More studies are needed to optimize urinary dilution correction methods. Covariates of urinary dilution measurements still warrant consideration.
Keywords: Arsenic; Biomonitoring; Hydration correction; Urine.
Copyright © 2019. Published by Elsevier Ltd.
Figures
References
-
- Araki S. Comparison of the effects of urinary flow on adjusted and non-adjusted excretion of heavy metals and organic substances in ‘healthy’ men. J. Appl. Toxicol. 1986;6(4):245–251. - PubMed
-
- Araki S., Aono H., Murata K. Adjustment of urinary concentration to urinary volume in relation to erythrocyte and plasma concentrations: an evaluation of urinary heavy metals and organic substances. Arch. Environ. Health. 1986;41(3):171–177. - PubMed
-
- Araki S., Sata F., Murata K. Adjustment for urinary flow rate: an improved approach to biological monitoring. Int. Arch. Occup. Environ. Health. 1990;62(6):471–477. - PubMed
-
- Athanasiadou I. The effect of athleteshyperhydration on the urinary ‘steroid profile’ markers in doping control analysis. Drug Test. Anal. 2018;10(9):1458–1468. - PubMed
-
- Aylward L.L. Sources of variability in biomarker concentrations. J. Toxicol. Environ. Health, Part B. 2014;17(1):45–61. - PubMed
Publication types
MeSH terms
Substances
Grants and funding
LinkOut - more resources
Full Text Sources
Medical
Research Materials
