. 2019 Sep;12(9):1155-1163.
doi: 10.1016/j.tranon.2019.04.016. Epub 2019 Jun 14.

High Glucose Promotes Human Glioblastoma Cell Growth by Increasing the Expression and Function of Chemoattractant and Growth Factor Receptors

Affiliations

High Glucose Promotes Human Glioblastoma Cell Growth by Increasing the Expression and Function of Chemoattractant and Growth Factor Receptors

Zhiyao Bao et al. Transl Oncol. 2019 Sep.

Abstract

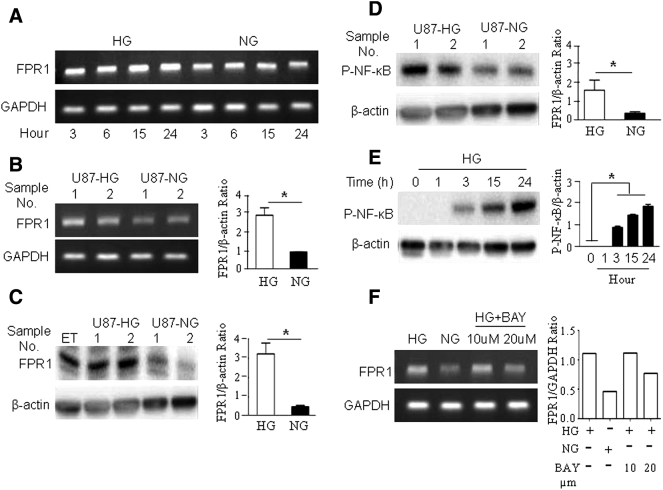
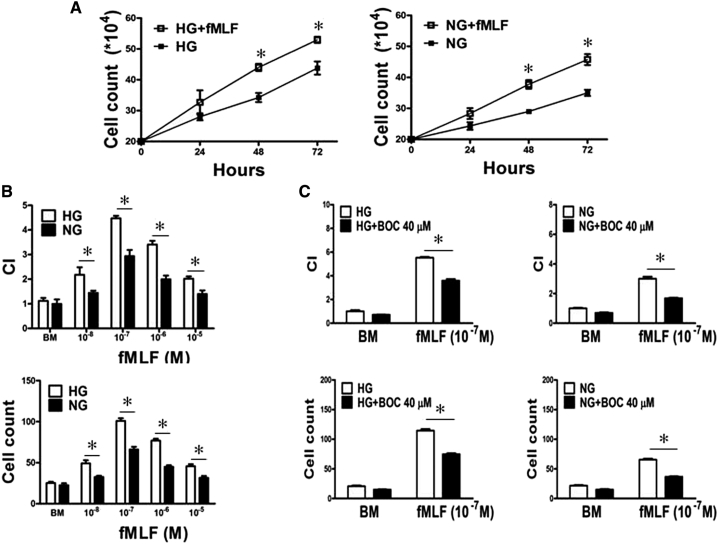
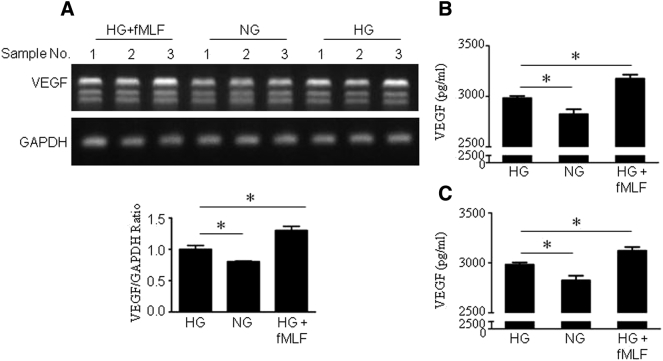
Diabetes mellitus, characterized by hyperglycemia, is considered as a risk factor of cancers including malignant gliomas. However, the direct effect of high glucose on cancer cell behavior is not clear. We therefore investigated the effect of hyperglycemia on the growth of human glioblastoma (GBM) cells. Our results revealed that high glucose (HG) promoted the proliferation and inhibited the apoptosis of a human GBM cell line U87. Mechanistically, HG upregulated the expression and function of a G-protein coupled chemoattractant receptor (GPCR) formyl peptide receptor 1 (FPR1) and epidermal growth factor receptor (EGFR) on GBM cells, which upon activation by their agonists, promoted cell migration and proliferation. In addition, the invasiveness and the production of VEGF by U87 cells were enhanced under HG conditions, the effects of which were mediated by FPR1 and EGFR agonists. The tumor promoting activity of HG was further substantiated by increased tumorigenicity and growth of xenograft tumors formed by GBM cells in nude mice with induced diabetes mellitus. Thus, our study demonstrates the capacity of HG to promote GBM progression via enhancement of the function of chemoattractant and growth factor receptors.


Figures

Figure 1
Figure 1
High glucose promotes U87 cell proliferation and survival U87 cells were exposed to high (25.0 mM, HG) or normal glucose (5 mM, NG) for 24, 48 and 72 h. A. Cell proliferation assessed by MTT assay. B. Cells were counted using inverted microscopy. C. The effect of glucose on long term growth of U87 cells assessed through microsphere formation. Graphs represent the mean ± SEM of triplicate samples (n = 3). *P < .05, indicates significantly increased growth and sphere formation of U87 cells under HG compared with cells in NG. D. U87 cells cultured for 24 h in HG or NG were measured for Bcl-2 and Mcl-1 proteins by Western blotting. Densitometric analyses were shown in lower panel. *P < .05, indicates significantly increased Bcl-2 and Mcl-1 in U87 cells in HG culture compared with NG.
Figure 2
Figure 2
HG up-regulates the expression of FPR1 by U87 cells. U87 cells were cultured in HG or NG for the indicated times. FPR1 mRNA was detected by RT-PCR. A. Increased FPR1 mRNA in U87-HG cells. B. Higher FPR1 mRNA levels in U87 cells cultured in HG for 24 h. *P < .05, indicates significantly increased FPR1 mRNA expression in U87 cells in HG compared with cells in NG culture. C. Increased FPR1 protein level in U87-HG measured by Western blotting. Epitope-tagged human FPR transfected RBL (ETFR) cells were cultured in HG for 24 h as positive controls. *P < .05, indicates significantly increased FPR1 protein expression in U87 cells in HG compared with cells in NG culture. D. Increased NF-κB phosphorylation in U87-HG for 24 h shown by Western blotting. *P < .05, indicates significantly increased p-NF-kB in U87 cells in HG compared with cells in NG culture. E. Western blotting showing phosphorylation of NF-κB in HG cultured U87 cells at indicated time points. *P < .05. F. The expression of FPR1 mRNA detected by RT-PCR in U87 cells in HG culture for 24 h are treated with the NF-kB inhibitor BAY 11–7082 at indicated concentrations for 30 min.
Figure 3
Figure 3
HG enhances the function of FPR1 expressed by U87 cells A. U87 cell proliferation examined in the absence or presence of the FPR1 agonist fMLF (10−7 M) in HG or NG culture for 24, 48 and 72 h. *P < .05, indicates significantly increased growth of U87 cells under both HG and NG culture when treated with fMLF. B. Migration of U87 cells treated with HG or NG in response to fMLF. *P < .05, indicates significantly increased fMLF-induced migration of U87 cells under HG compared with cells in NG. Cell chemotaxis was measured by 48 well chemotaxis chambers. Results are expressed as chemotaxis index (CI) and numbers of migrated cells in response to chemoattractants. C. Inhibition of fMLF (10−7 M) induced chemotaxis of U87 cells by the FPR1 antagonist BOC-MLF (40 μM). *P < .05, indicates significant inhibition of fMLF induced chemotaxis of HG cultured U87 cells by BOC-MLF.
Figure 4
Figure 4
HG accelerates fMLF-induced wound closure by U87 cells. Increased rate of closure of scratch wound on the monolayer of U87 cells in HG or NG culture when treated with fMLF (10−7 M) A. Wound closure measured at 8 h. Quantitation of cell migration based on results shown in the left panel. *P < .05, indicates significantly increased rate of wound closure shown by U87 cells cultured in HG compared with cells in NG. B. Inhibition of U87 cell wound closure by the FPR1 antagonist BOC-MLF (40 μM) in HG for 8 h. Quantification of cell migration is based on results shown in the left panel. *P < .05, indicates significant inhibition by BOC-MLF of fMLF induced wound closure by U87 cells cultured in HG.
Figure 5
Figure 5
Increased production of VEGF by U87 cells cultured in HG and further enhancement by the presence of FPR1 agonists. U87 cells were cultured in HG or NG with the presence or absence of fMLF or EGF for 24 h. A. VEGF mRNA was measured by RT-PCR. B. VEGF protein level in the supernatants measured by ELISA. *P < .05, indicates significantly increased VEGF mRNA and protein expression by U87 cells in HG compared with cells in NG culture. Further increased VEGF production by U87-HG treated with fMLF (10−7 M). C. VEGF protein level in the supernatants measured by ELISA. *P < .05, indicates significantly increased VEGF protein in U87 cells under HG compared with cells in NG, EGF further increased VEGF productin by U87-HG treated with EGF (10 ng/ml).
Figure 6
Figure 6
Activation of MAPKs in U87 cells. Western blotting was performed to examine the phosphorylation of p38 and ERK1/2 MAPKs in U87 cells. A. p38 phosphorylation induced by fMLF (10−7 M) at indicated time in U87 cells cultured with HG or NG. Densitometry quantification of P-p38 was normalized against total p38. *P < .05, indicates significantly increased p38 phosphorylation induced by fMLF in U87 cells cultured in HG compared with cells in NG. B. p38 phosphorylation in U87 cells in HG inhibited by the FPR1 antagonist, CsH. C. ERK1/2 phosphorylation induced by fMLF (10−7 M) at indicated time in U87 cells cultured with HG or NG. Densitometry quantification of P-ERK1/2 normalized against total ERK1/2. *P < .05, indicates significantly increased ERK1/2 phosphorylation induced by fMLF in U87 cells cultured in HG compared with cells in NG. D. ERK1/2 phosphorylation in HG in the presence of fMLF was inhibited by the FPR1 antagonist, CsH. E. NF-κB phosphorylation induced by fMLF (10−7 M) at indicated times in U87 cells cultured with HG or NG. Densitometry quantification of P-NF-κB normalized against β-actin. *P < .05, indicates significantly increased ERK1/2 phosphorylation induced by fMLF in U87 cells cultured in HG compared with cells in NG.
Figure 7
Figure 7
HG promotes the malignant behavior of xenograft tumors formed by U87 cells. Nude mice were injected intraperitoneally with SZT (40 mg/kg) for 5 consecutive days for 2 rounds to establish diabetes mellitus. Mice with stable blood glucose levels above 200 mg/dl are considered as diabetic. A. Tumors formed by GBM cells injected subcutaneously into right flanks of normal and diabetic nude mice. Mice were examined for tumor formation at indicated time points. Tumor size was measured at different times after inoculation. *P < .05, indicates more rapid growth of human GBM xenograft tumors in diabetic mice. B. Ki67 staining for xenograft tumors at day 31 after inoculation. Red: Ki67, Blue: DAPI, Scale bar: 50 μm. Right panel showing quantification of Ki67+ cells in xenograft tumors at day 31 after inoculation in each mouse at three different areas under high power fields (×200), 5 mice per group. *P < .05, indicates more rapid growth of human GBM xenograft tumors in diabetic mice. C. Histology of tumors formed by U87 cells at day 31. Black arrow: tumor capsule. Scale bar: 50 μm. D. Vascular endothelial cells (ECs) detected with anti-mouse CD31 antibodies in tumors formed by U87 cells. Red: CD31, Blue: DAPI, Scale bar: 50 μm. Right panel showed quantification of CD31+ cells in xenograft tumors at day 31 after inoculation in three different areas under high power fields (×200), 5 mice per group. *P < .05, indicates increased angiogenesis of human GBM xenograft tumors in diabetic mice.

References

    1. Ostrom QT, Gittleman H, Fulop J, Liu M, Blanda R, Kromer C, Wolinsky Y, Kruchko C, Barnholtz-Sloan JS. CBTRUS Statistical Report: Primary brain and central nervous system tumors diagnosed in the United States in 2008-2012. Neuro Oncol. 2015;17(Suppl 4):iv1–iv62. - PMC - PubMed
    1. Braganza MZ, Kitahara CM, Berrington de Gonzalez A, Inskip PD, Johnson KJ, Rajaraman P. Ionizing radiation and the risk of brain and central nervous system tumors: a systematic review. Neuro Oncol. 2012;14:1316–1324. - PMC - PubMed
    1. Chaichana KL, McGirt MJ, Woodworth GF, Datoo G, Tamargo RJ, Weingart J, Olivi A, Brem H, Quinones-Hinojosa A. Persistent outpatient hyperglycemia is independently associated with survival, recurrence and malignant degeneration following surgery for hemispheric low grade gliomas. Neurol Res. 2010;32:442–448. - PubMed
    1. Chambless LB, Parker SL, Hassam-Malani L, McGirt MJ, Thompson RC. Type 2 diabetes mellitus and obesity are independent risk factors for poor outcome in patients with high-grade glioma. J Neurooncol. 2012;106:383–389. - PubMed
    1. Ogurtsova K, da Rocha Fernandes JD, Huang Y, Linnenkamp U, Guariguata L, Cho NH, Cavan D, Shaw JE, Makaroff LE. IDF Diabetes Atlas: Global estimates for the prevalence of diabetes for 2015 and 2040. Diabetes Res Clin Pract. 2017;128:40–50. - PubMed