. 2019 Jul;571(7764):211-218.
doi: 10.1038/s41586-019-1325-x. Epub 2019 Jun 17.

TOX transcriptionally and epigenetically programs CD8+ T cell exhaustion

Affiliations

TOX transcriptionally and epigenetically programs CD8+ T cell exhaustion

Omar Khan et al. Nature. 2019 Jul.

Abstract

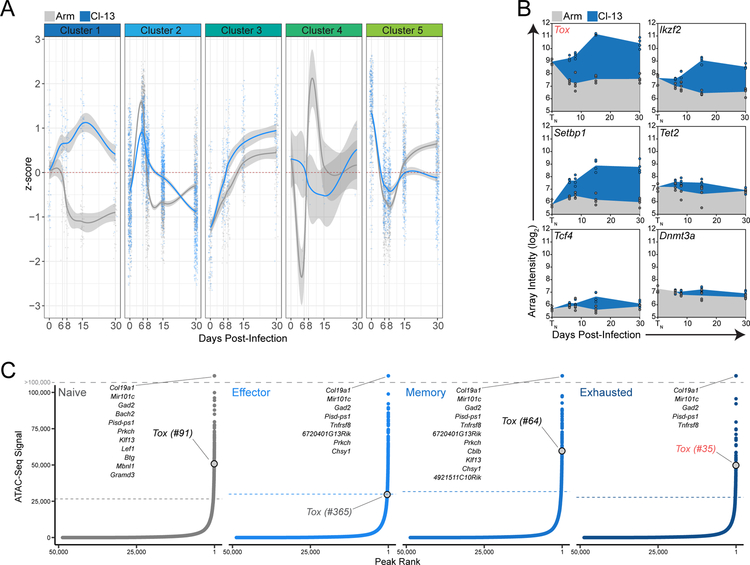
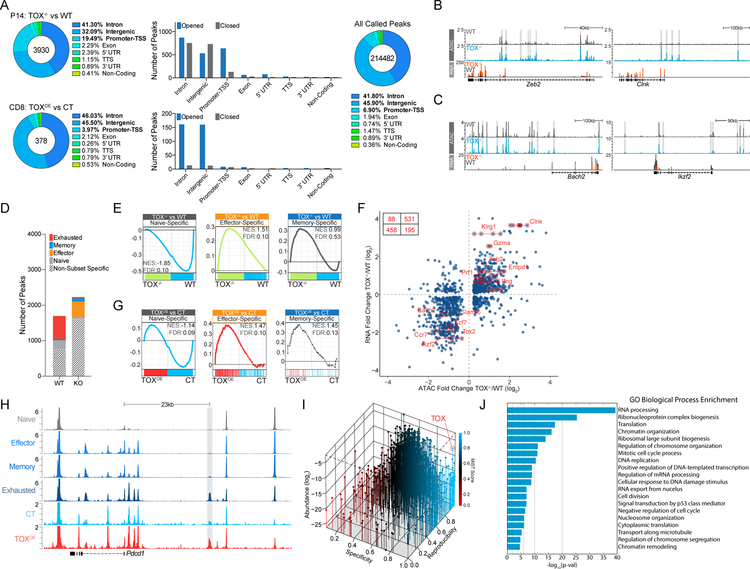
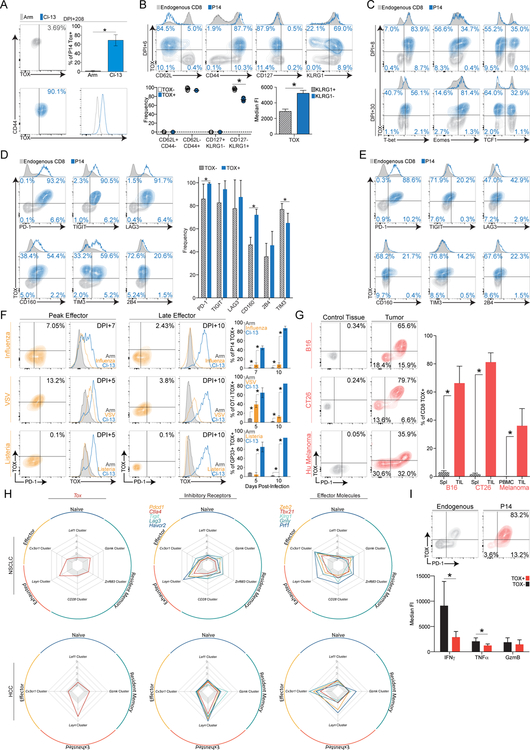
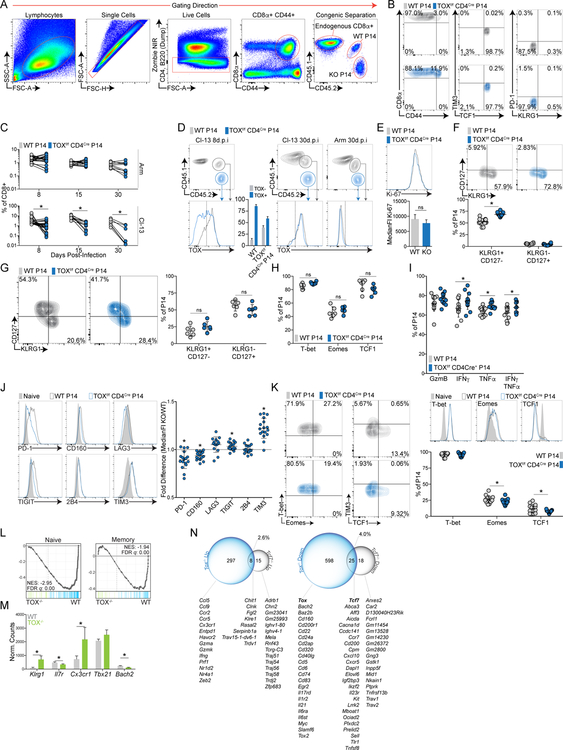
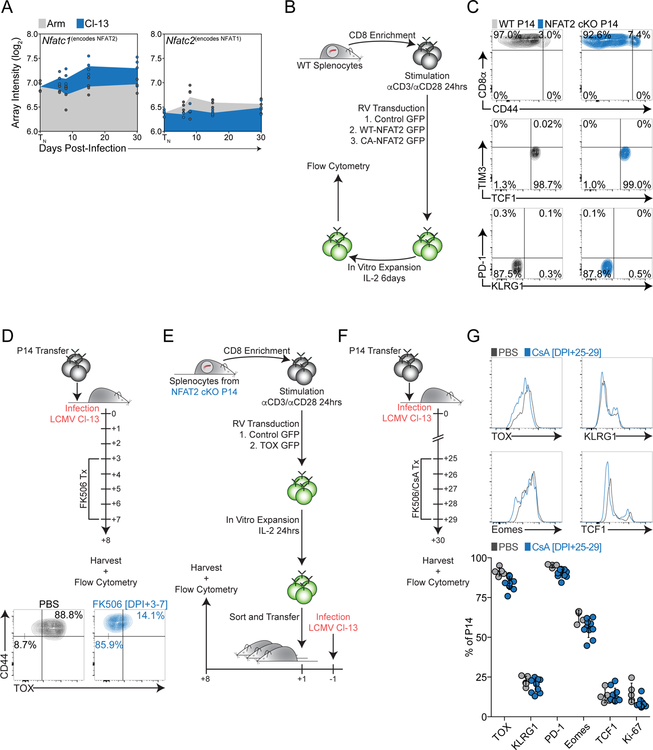
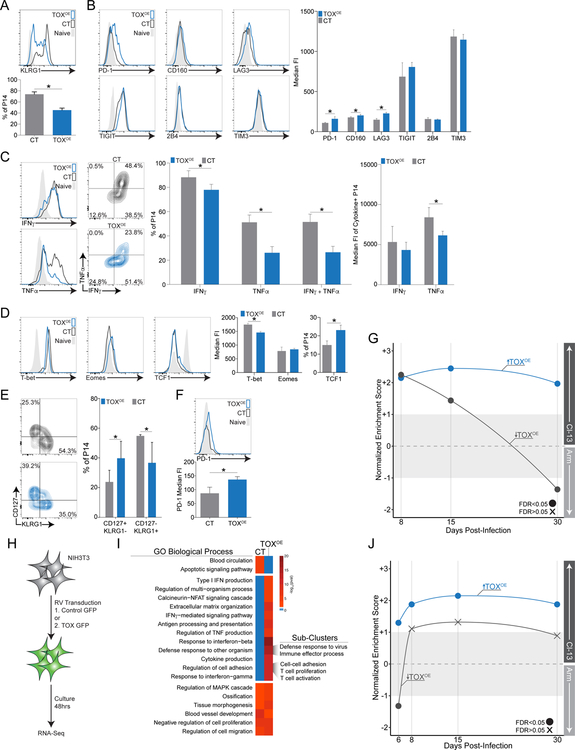
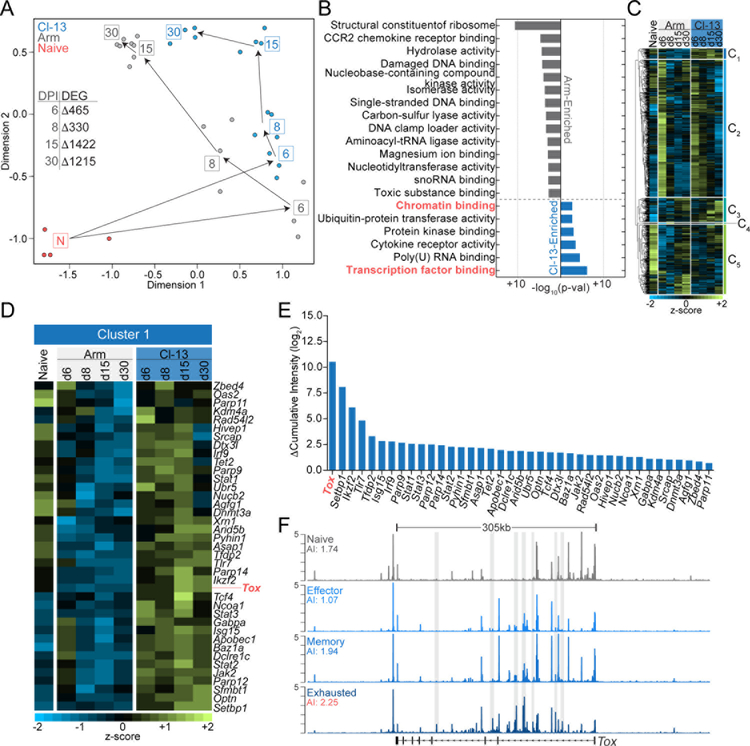
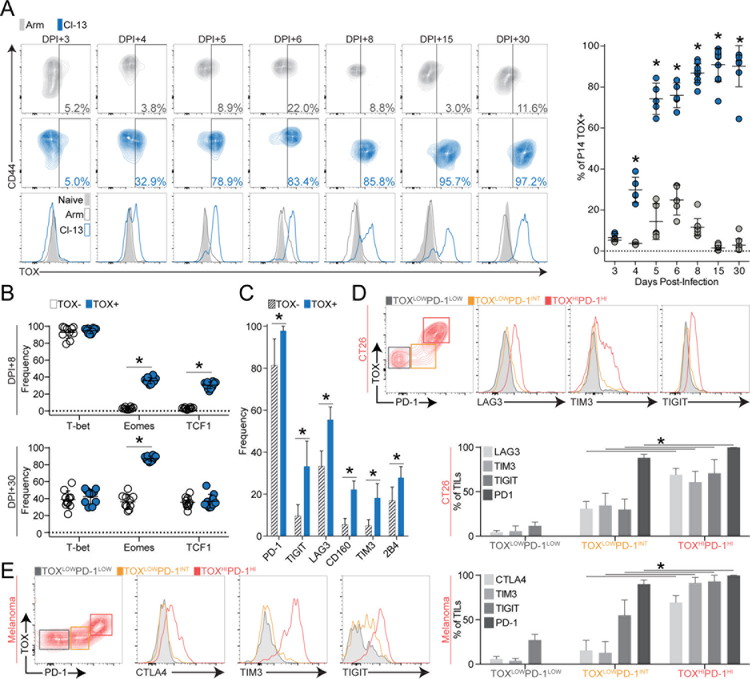
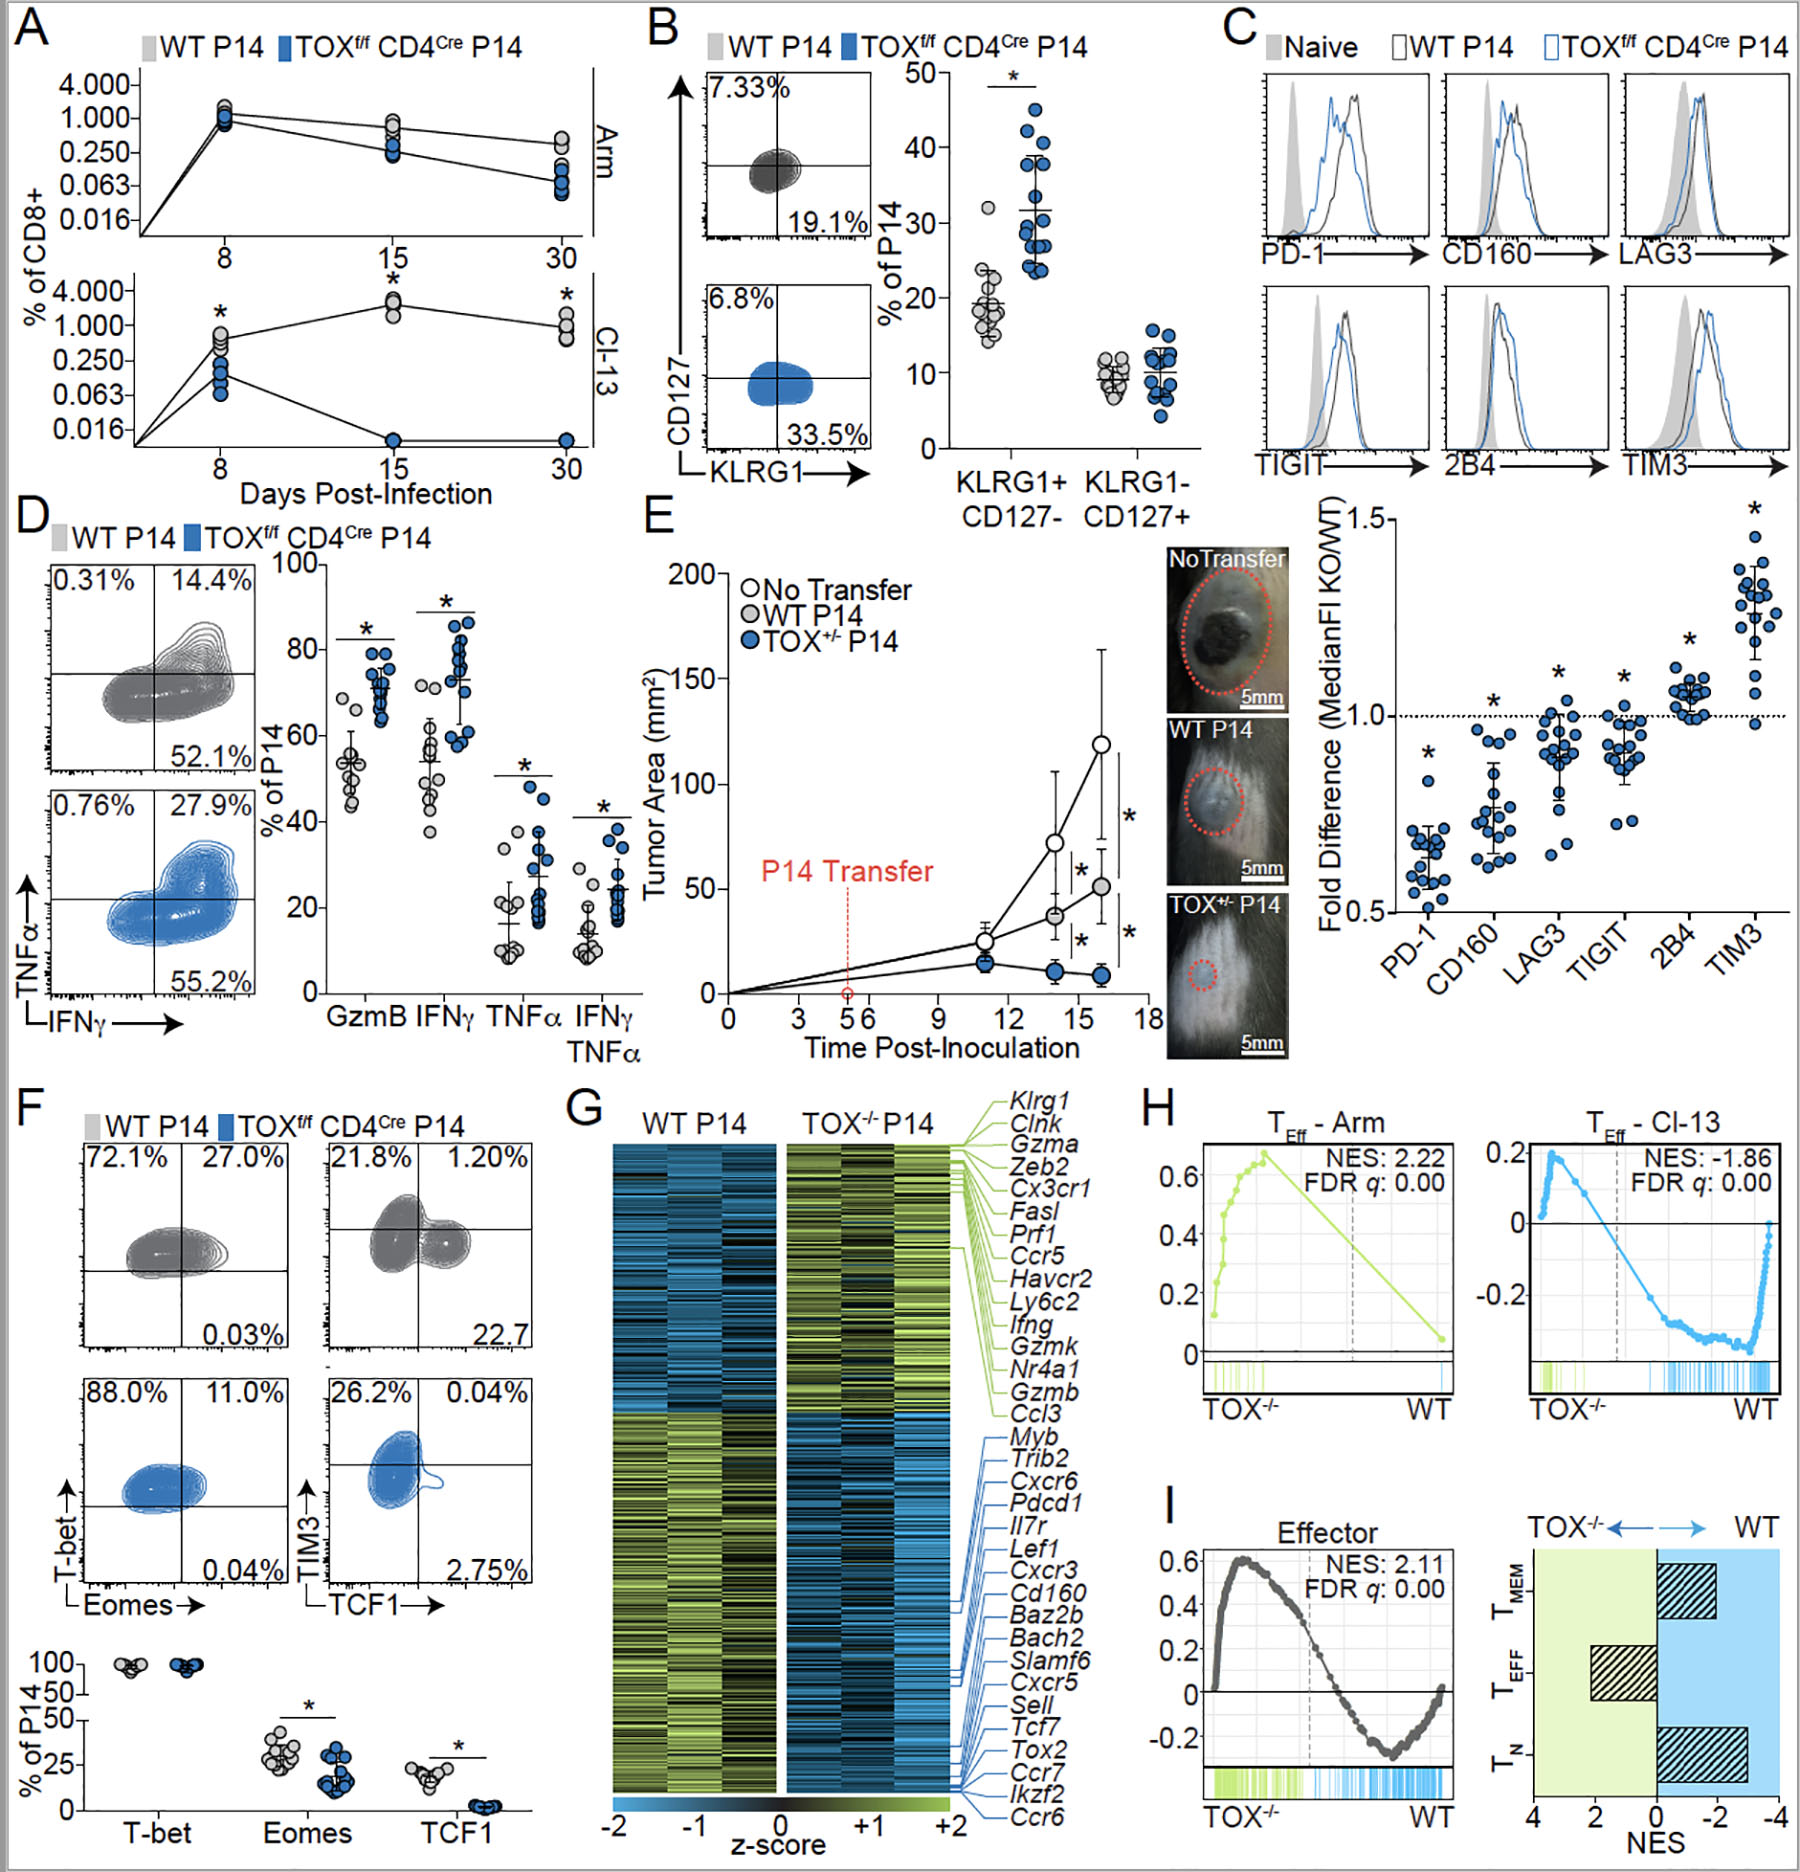
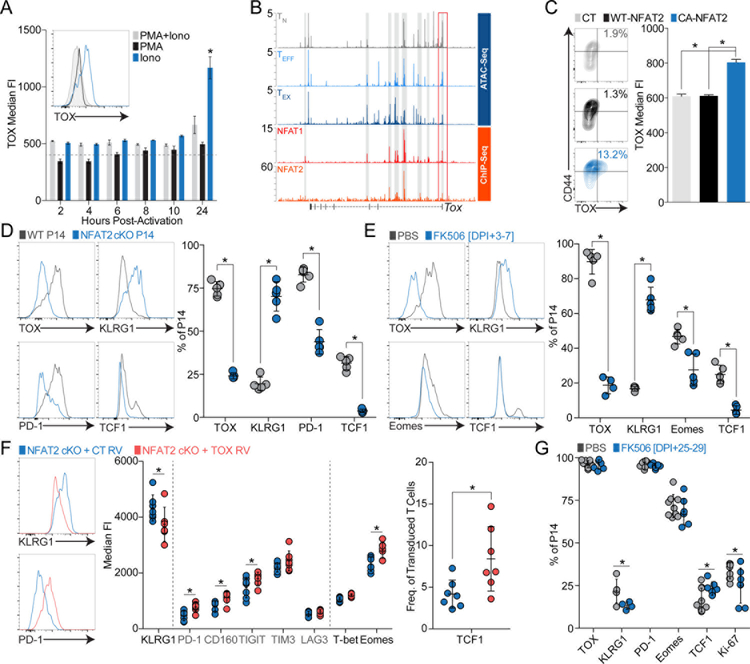
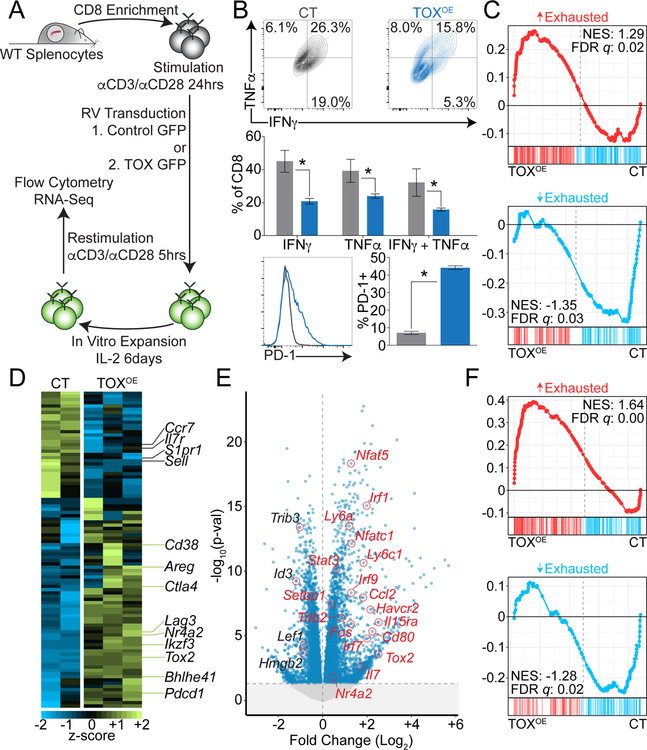
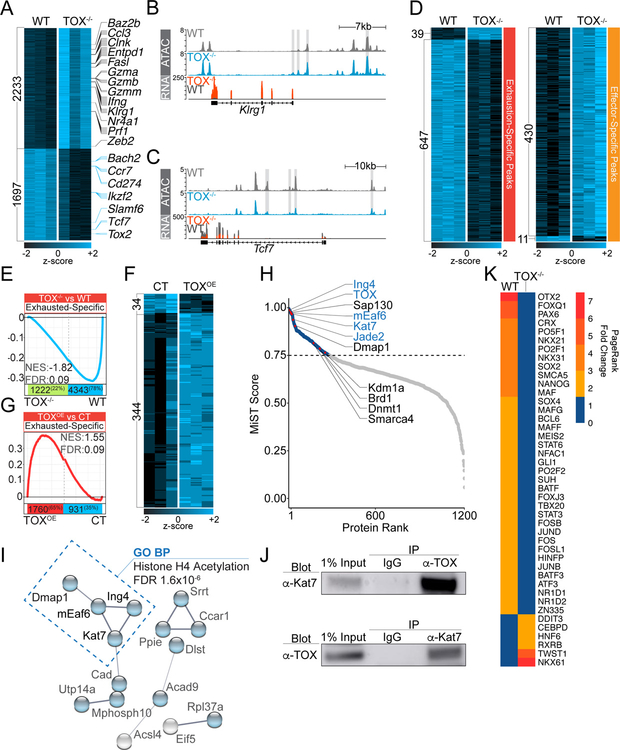
Exhausted CD8+ T (Tex) cells in chronic infections and cancer have limited effector function, high co-expression of inhibitory receptors and extensive transcriptional changes compared with effector (Teff) or memory (Tmem) CD8+ T cells. Tex cells are important clinical targets of checkpoint blockade and other immunotherapies. Epigenetically, Tex cells are a distinct immune subset, with a unique chromatin landscape compared with Teff and Tmem cells. However, the mechanisms that govern the transcriptional and epigenetic development of Tex cells remain unknown. Here we identify the HMG-box transcription factor TOX as a central regulator of Tex cells in mice. TOX is largely dispensable for the formation of Teff and Tmem cells, but it is critical for exhaustion: in the absence of TOX, Tex cells do not form. TOX is induced by calcineurin and NFAT2, and operates in a feed-forward loop in which it becomes calcineurin-independent and sustained in Tex cells. Robust expression of TOX therefore results in commitment to Tex cells by translating persistent stimulation into a distinct Tex cell transcriptional and epigenetic developmental program.


Conflict of interest statement

Competing Interests

O.K. is an employee of Arsenal Biosciences. R.K.A. serves as a consultant for Sprint Biosciences, Immunacell and Array Pharmaceuticals and is a founder of Pinpoint Therapeutics. T.C.M. is an advisor to and/or receives honoraria from Aduro, Array, BMS, Incyte, Merck, Regeneron. S.L.B receives research funding from Celgene. E.J.W. receives honoraria, consulting fees and/or research support from BMS, Celgene, Dynavax, Eli Lilly, Elstar, Merck, MedImmune, Pieris, Roche, Surface Oncology, and KyMab. E.J.W. is a founder of Arsenal Biosciences. E.J.W. has a patent licensing agreement for the PD-1 pathway.

Figures

Extended Data Figure 1
(A) Data points indicate the z-score of each gene in clusters 1–5 plotted against time post-Arm or Cl-13 infection. Gray and blue lines represent the moving average of z-score with 95% confidence interval in P14 cells from Arm and Cl-13 infection, respectively. (B) Expression of selected genes within cluster 1 plotted as normalized array intensity against time p.i. Gray and blue represent P14 cells from Arm and Cl-13 infection, respectively. (C) Distribution of ATAC-seq signal across loci in TN, TEFF, TMEM, and TEX P14 T cells. Loci above horizontal dashed lines denote putative super enhancers. Rank of the Tox locus among all identified potential super enhancers is shown.
Extended Data Figure 2
(A) TOX expression in P14 cells from peripheral blood at d208 p.i. with Arm or Cl-13. (B) TEFF and TMEM markers relative to TOX expression in P14 T cells or endogenous CD8+ T cells on d6 post-Cl-13 infection (top). Frequency of TMEM and TEFF subsets within TOX+ and TOX P14 T cell populations (bottom left). TOX median fluorescence intensity in KLRG1+ and KRLG1- P14 cells (bottom right). (C) TOX versus TF expression following 8 or 30 days of Cl-13 infection. (D,E) TOX versus IR expression in P14 cells following 8 (D) or 30 days (E) of Cl-13 infection. (F) TOX expression in antigen specific CD8+ T cells following influenza, VSV, or Listeria monocytogenes infection compared with LCMV Arm or Cl-13. (G) TOX versus PD-1 and quantification of TOX expression in activated CD8+ CD44+ T cells from control tissues or tumors. Control T cells for mouse tumor models were acquired from the spleen, whereas in humans, T cells from the peripheral blood of normal donors served as controls. (H) Radar plots of median gene expression in single cell RNA sequencing data from tumor biopsies and peripheral blood of patients with non-small cell lung cancer (NSCLC) or hepatocellular carcinoma (HCC),. Median expression was calculated on cell clusters that were defined by key driver genes and represent canonical T cell populations,. (I) P14 T cell infiltration in GP33-expressing B16 tumors (top). Cytokine production in TOX+ or TOX tumor-infiltrating P14 cells (bottom). Contour and histogram plots are from one representative experiment of at least 2 independent experiments consisting of ≥4 mice per group. Unless otherwise noted, P14 cells were analyzed from the spleens of infected animals. Summarized experiments denote one animal per data point and error is reported as standard deviation (SD). For (E), 5 human melanoma biopsy samples were analyzed. Statistical significance (*P<0.01, **P<0.001, ***P<0.0001) determined by Student’s t-test.
Extended Data Figure 3
(A) Gating strategy used in co-adoptive transfer and infection experiments. (B) Expression of activation markers and TFs in naïve WT and ToxFlox/Flox CD4Cre P14 cells prior to adoptive transfer. WT and TOX cKO T cells were mixed 1:1 and adoptively transferred into congenic WT mice followed by infection with Arm (C,D,F-K) or Cl-13 (C-E). (C) Frequency of WT or TOX cKO P14 cells during Arm or Cl-13 infection. (D) TOX expression in WT and TOX cKO P14 T cells following Arm or Cl-13 infection. (E) Ki-67 expression on d8 of Cl-13 infection. (F,G) Frequency of memory populations on d8 (F) or d30 (G) of Arm infection. (H) TF expression in WT and TOX cKO P14 T cells on d30 p.i. with Arm. (I-K) Cytokine and effector molecule (I), IR (J), and TF (K) expression on d8 p.i. with Arm. IR expression reported as the ratio of the MFI between TOX cKO and WT P14 T cells (J, right). (L) GSEA of transcriptional signatures associated with TN or TMEM compared to the differentially expressed genes in TOX−/− versus WT P14 cells. (M) Expression of genes associated with terminal short-lived TEFF subset. (N) Comparison of transcriptional signature of TOX cKO and TCF1 cKO T cells following eight days of Cl-13 infection. Genes differentially expressed relative to WT (FDR<0.05 and log-fold change >0.6) were compared between datasets. Contour and histogram plots are representative of ≥4 independent experiments with ≥4 mice. Statistical significance (*P<0.01, **P<0.001, ***P<0.0001) determined by pair-wise t-test with Holm-Sidak correction (C) or Student’s t-test (E-L), error reported as SD.
Extended Data Figure 4
(A) Normalized microarray expression of Nfatc1 (encodes NFAT2) and Nfatc2 (encodes NFAT1) in P14 T cells following Arm or Cl-13 infection. (B) CD8+ T cells were enriched, activated, and transduced with CT, WT-NFAT2, or CA-NFAT2 encoding RVs. T cells were expanded and differentiated in vitro in the presence of IL-2 for 6 days prior to analysis. (C) Expression of activation markers and TFs in naïve WT and NFAT2Flox/Flox CD4Cre P14 cells from the blood prior to adoptive transfer. (D) P14 T cells were adoptively transferred into WT hosts followed by infection with Cl-13. On d3–7 of infection, mice were treated with PBS or FK506 and splenocytes were harvested on d8 p.i. (top). CD44 expression in P14 T cells on d8 following infection with Cl-13 and treatment with PBS or FK506 on d3–7 (bottom). (E) NFAT2 cKO CD8+ T cells were enriched from naïve mice, activated with αCD3 and αCD28 and transduced with RVs encoding TOX or GFP only control. 24 hours later, cells were sorted and transferred into Cl-13 infected mice. Protein expression analyzed on d8 p.i. (F) P14 T cells were transferred into WT mice followed by infection with Cl-13. On d25–29 p.i., recipient mice were treated with PBS, FK506, or CsA and splenocytes were harvested on d30 p.i. for analysis. (G) Protein expression in P14 cells following treatment with CsA or PBS on d25–29 of Cl-13 infection. All contour and histogram plots are representative of ≥3 independent experiments consisting of ≥3 mice per group. Statistical significance (*P<0.01, **P<0.001, ***P<0.0001) determined by Student’s t-test, error reported as SD.
Extended Data Figure 5
(A-D) Naïve P14 T cells were activated with αCD3 and αCD28 antibodies for 24 hours prior to transduction with RVs encoding TOX (TOXOE) or control GFP (CT). Twenty-four hours following transduction, GFP+ cells were sorted and transferred into d2 Arm-infected recipients. Eight days following transfer, transduced P14 cells were isolated from spleens and assayed for (A) KLRG1+ TEFF frequency, (B) IR expression, (C) cytokine production following 5 hours of restimulation with GP peptide, and (D) TF expression. (E,F) Distribution of memory T cell subsets and PD-1 expression in TOX versus CT transduced P14 cells following 30 days of Arm infection. (G) Genes upregulated (blue) or downregulated (gray) in TOXOE versus CT cells were analyzed for enrichment in the transcripts differentially expressed in P14 from in vivo Arm versus Cl-13 at d8, 15, and 30 p.i.. Normalized GSEA enrichment scores (NES) plotted versus time p.i. (H) Experimental procedure used to generate datasets analyzed in Fig.5e,f and Extended Data Fig.5i,j. NIH3T3 cells were transduced with RVs encoding TOX+GFP (TOXOE) or control GFP only (CT). Cells were cultured for 48 hours, then harvested and processed for RNA-seq analysis. (I) GO analysis of biological processes differentially regulated in TOXOE versus CT fibroblasts. (J) As in (G), genes upregulated (blue) or downregulated (gray) in fibroblasts were assayed for enrichment in the genes differentially expressed in P14 cells on d6, 8, 15, and 30 of Arm or Cl-13 infection. All contour and histogram plots are representative of ≥2 independent experiments consisting of ≥5 mice per group. Unless otherwise noted, P14 cells were analyzed from the spleens of infected animals. Statistical significance (*P<0.01, **P<0.001, ***P<0.0001) determined by Student’s t-test, error reported as SD.
Extended Data Figure 6
(A) Location of differentially accessible ATAC-seq peaks from Fig. 6A (top left) or Fig. 6F (bottom right). Right, distribution of all peaks in CD8+ T cells above background levels. (B,C) ATAC-seq and RNA-seq tracks of TEFF (B) or TMEM (C) -associated loci. Peaks uniquely opened (B) or closed (C) in TOX−/− relative to WT T cells are highlighted with gray bars. (D) Enumeration of significantly differentially accessible sites (FDR<0.05) in WT and TOX−/− T cells at TEX-specific and TEFF-specific loci. (E) PSEA of chromatin regions specifically accessible in TN, TEFF, TMEM in TOX−/− versus WT P14. (F) Fold change in ATAC accessibility versus RNA expression. Key TEX and TEFF genes are highlighted and genes associated with multiple peaks are connected with a red line. Inset table enumerates the number of gene-ATAC peak pairs in each quadrant. (G) PSEA of chromatin regions specifically accessible in TN, TEFF, TMEM in TOXOE versus CT P14. (H) ATAC-seq tracks of TN, TEFF, TMEM, and TEX cells compared with CT and TOXOE T cells at the Pdcd1 locus. Gray bar highlights the TEX-specific −23.8kb enhancer. (I) Abundance, specificity and reproducibility plot of proteins identified by MS analysis following TOX immunoprecipitation versus IgG control in EL4 cells. Hits are colored by MiST score (blue signifies >0.75). (J) GO biological process enrichment of TOX-bound proteins identified in (I) with MiST score >0.75.
Figure 1 -
Figure 1 -. Multiple epigenetic modulators, including TOX are selectively expressed in TEX
(A) Multidimensional scaling analysis of transcriptional data from naive LCMV-specific P14 CD8+ T cells (orange) or from acute (Arm, gray) or chronic (Cl-13, blue) LCMV at indicated days post-infection (p.i.). Inset table enumerates differentially expressed genes (FDR <0.05) between Arm and Cl-13 at specified days p.i. (B) Gene ontology (GO) analysis of differentially expressed genes 6 days post-Arm or Cl-13 infection. Gray and blue denote GO molecular functions enriched in Arm and Cl-13, respectively. Categories that include chromatin binding proteins are highlighted in red. (C) Heatmap of differentially expressed chromatin modulating genes (Supplementary Table 8, see methods) between naïve P14 T cells and among P14 T cells during Arm or Cl-13 infection. Genes are ordered by hierarchical clustering using Manhattan distance and clusters generated by k-means. Z-scores of log2 expression data shown. (D) Chromatin modulating genes in cluster 1. (E) Difference in cumulative expression of genes in cluster 1. Values were calculated by summing the normalized array intensity of each gene at all time points p.i. and subtracting Arm from Cl-13. (F) ATAC-seq tracks of in vivo TN, TEFF, TMEM and TEX P14 cells at the Tox locus. Accessibility Index (AI) of each sample calculated by summing the normalized tag counts across the locus and dividing by its length.
Figure 2 -
Figure 2 -. Rapid and sustained TOX expression is associated with key features of exhaustion
(A) TOX protein expression in P14 T cells following Arm or Cl-13 infection. Frequencies of TOX+ P14 cells relative to total P14 population (left) and summary data (right). (B) Transcription factor expression within TOX+ and TOX P14 populations at d8 or d30 p.i. of Cl-13 infection. (C) Inhibitory receptor expression in TOX+ and TOX P14 cells 30 days post-Cl-13 infection. (D,E) Identification of TOX-expressing cells in tumor-infiltrating CD8+ T cells (TILs) from (D) CT26 carcinoma mouse model and (E) human melanoma biopsy samples. TOX versus PD-1 expression, inhibitory receptor expression in TOXLOWPD-1LOW, TOXLOWPD-1INT, and TOXHIPD-1HI TIL populations, and summarized expression of IRs in these three populations. Contour and histogram plots representative of ≥3 independent experiments consisting of ≥4 mice. Unless otherwise noted, P14 cells were analyzed from the spleens of infected animals. Summarized experiments denote one animal per data point and error is reported as standard deviation (SD). For (E), 5 human TIL and 11 human normal donor samples were analyzed. Statistical significance (*P<0.01, **P<0.001, ***P<0.0001) determined by Student’s t-test.
Figure 3 -
Figure 3 -. TOX is required for the development of TEX
WT and TOXFlox/Flox CD4Cre (TOX cKO) P14 T cells were mixed 1:1 and adoptively transferred into hosts. Spleens harvested at indicated time points following Arm or Cl-13 infection (A) or on d8 of Cl-13 infection (B-D, F). (A) Frequency of WT or TOX cKO T cells relative to the total CD8+ T cell pool during Arm (top) or Cl-13 (bottom) infection. (B) KLRG1 and CD127, (C) IR, and (D) cytokine expression in WT and TOX cKO P14. Ratio of IR median fluorescence intensity between TOX cKO and WT P14. (E) Tumor area following inoculation with B16-GP33 and transfer of pre-activated WT or TOX+/- P14 T cells. (F) TF expression in WT and TOX cKO P14. (G-I) WT and TOX−/- P14 mixed 1:1, transferred into WT hosts, and recovered from the spleen on d8 of Cl-13 infection for RNA-seq. (G) Differentially expressed genes in WT versus TOX−/- P14. Genes associated with TEFF or TMEM are labeled. Each column represents a biological replicate. (H) Gene set enrichment analysis of the transcriptional signature from early (d8) T cell responses to acute (TEFF-Arm, left) or chronic (TEFF-Cl-13, right) infection in TOX−/- versus WT P14. (I) GSEA and normalized enrichment scores (NES) of transcriptional signatures associated with TN, TEFF, or TMEM compared to the differentially expressed genes in TOX−/- versus WT P14. Contour and histogram plots representative of ≥4 independent experiments consisting of ≥4 mice. Y-axis of GSEA plots represent enrichment score. Heatmaps generated using z-scores derived from log2 tag counts. Statistical significance (*P<0.01, **P<0.001, ***P<0.0001) determined by Student’s t-test, error reported as SD.
Figure 4 -
Figure 4 -. Calcineurin signaling and NFAT2 are necessary and sufficient to induce TOX, but sustained expression becomes calcineurin independent
(A) TOX expression in CD8+ T cells following 24 hours of stimulation with PMA, ionomycin, or PMA with ionomycin (inset). Time course of TOX MFI following addition of stimulus; dashed line indicates TOX MFI in TN. (B) ATAC-seq tracks of the Tox locus in TN, TEFF, and TEX P14 cells compared with NFAT1 (red) and NFAT2 (orange) ChIP-seq tracks from TEFF,. Promoter region highlighted with red box. Gray bars highlight significant enrichment of NFAT1 and NFAT2. (C) TOX expression in WT-NFAT2, CA-NFAT2, or mock-transduced T cells. (D) WT and NFAT2Flox/Flox CD4Cre P14 T cells mixed 1:1 and adoptively transferred into WT hosts prior to infection with Cl-13. Frequency of TOX+, KLRG1+, PD-1+, and TCF1+ P14 cells on d8 p.i. (E) TOX, KLRG1, PD-1, and TCF1 expression in P14 on d8 p.i with Cl-13 following treatment with FK506 or PBS from d3–7. (F) NFAT2 cKO P14 cells were transduced with a RV encoding TOX (NFAT2 cKO + TOX) or control GFP (NFAT2 cKO + CT) and adoptively transferred into WT congenic mice infected with Cl-13. TEFF markers, IRs, and TFs were evaluated on d7 p.i. (G) TEFF marker, IR, and TF expression measured on d30 p.i. with Cl-13 following treatment with FK506 or PBS on d25–29. Contour and histogram plots are representative of ≥3 independent experiments consisting of ≥3 mice per group. Unless otherwise noted, P14 cells were analyzed from the spleens of infected animals. Statistical significance (*P<0.01, **P<0.001, ***P<0.0001) determined by Student’s t-test, error reported as SD.
Figure 5 -
Figure 5 -. TOX enforces a TEX transcriptional program
(A) Experimental procedure used in (B)-(D). CD8+ T cells isolated from spleens, activated, transduced with RVs encoding TOX (TOXOE) or control GFP (CT), and restimulated prior to analysis. (B) Cytokine and PD-1 expression following restimulation. (C) Genes uniquely upregulated (red) or downregulated (blue) in TEX were assayed for enrichment in TOXOE or CT T cells using GSEA. (D) Heatmap of leading edge genes from (C). Key genes associated with TEX are labeled. (E) Differentially expressed genes in TOXOE relative to CT transduced fibroblasts. Transcripts with a FDR value <0.05 are highlighted in blue. TEX-associated genes from the leading edge of (F) labeled in red. (F) As in (C), genes uniquely up-(red) or down-(blue) regulated in TEX were analyzed for enrichment in TOXOE versus CT transduced fibroblasts. Contour and histogram plots are representative of ≥3 independent experiments. RNA-seq datasets were generated from ≥2 biological replicates. Heatmaps generated using z-scores derived from log2 tag counts. Y-axis of GSEA plots represent enrichment score (ES). Statistical significance (*P<0.01, **P<0.001, ***P<0.0001) determined by Student’s t-test, error reported as SD.
Figure 6 -
Figure 6 -. TOX induces an epigenetic signature of TEX by recruiting the HBO1 complex
(A-E) ATAC-seq on TOX−/- and WT P14 T cells following 8 days of Cl-13 infection. (A) Differentially accessible loci. Regions proximal to TEFF (black) and TMEM/TN (blue) genes are labeled. Lines denote number of gene-proximal loci with significant accessibility changes. Each column represents a biological replicate. ATAC-seq and RNA-seq tracks of TEFF (B) or TMEM (C) -associated loci. Differentially accessible sites are highlighted with gray bars. (D) Significantly differentially accessible sites (FDR<0.05) in WT and TOX−/- T cells at TEX-specific and TEFF-specific peaks. (E) Chromatin regions specifically accessible in TEX were analyzed for enrichment in the TOX−/- versus WT P14 T cells by peak set enrichment analysis (PSEA). (F,G) ATAC-seq on in vitro T cells transduced with RV encoding TOX (TOXOE) or control GFP (CT). (F) Differentially accessible chromatin regions in TOXOE compared to CT cells. (G) PSEA of TEX-specific loci as in (E) using differentially accessible loci in TOXOE versus CT CD8+ T cells. (H) MiST score of proteins identified after TOX immunoprecipitation and mass spectrometry from EL4 lysate. Dashed line indicates high-confidence hits. (I) STRING network analysis of proteins with a MiST score >0.90. GO biological process (BP) analysis on subsequent network is highlighted. (J) αTOX used to immunoprecipitate from EL4 lysate and blotted with αKat7 (top). Reverse IP was performed by immunoprecipitating with αKat7, then blotting with αTOX (bottom). (K) Heatmap of TFs with a PageRank score >1.5-fold different between WT and TOX−/- P14 on d8 of Cl-13. NFAC1 represents NFAT2. Heatmaps generated using z-scores derived from log2 tag counts. Y-axis of PSEA plots represent enrichment score (ES).

Similar articles

Cited by

References

    1. Kaech SM & Cui W Transcriptional control of effector and memory CD8+ T cell differentiation. Nat Rev Immunol 12, 749–761 (2012). - PMC - PubMed
    1. Wherry EJ & Kurachi M Molecular and cellular insights into T cell exhaustion. Nat Rev Immunol 15, 486–499 (2015). - PMC - PubMed
    1. Barber DL et al. Restoring function in exhausted CD8 T cells during chronic viral infection. Nature 439, 682–687 (2005). - PubMed
    1. Frebel H et al. Programmed death 1 protects from fatal circulatory failure during systemic virus infection of mice. J Exp Med 209, 2485–2499 (2012). - PMC - PubMed
    1. Zajac AJ et al. Viral Immune Evasion Due to Persistence of Activated T Cells Without Effector Function. J Exp Med 188, 2205–2213 (1998). - PMC - PubMed

METHODS REFERENCES

    1. Aliahmad P & Kaye J Development of all CD4 T lineages requires nuclear factor TOX. J Exp Med 205, 245–256 (2008). - PMC - PubMed
    1. Blattman JN, Wherry EJ, Ha SJ, van der Most RG & Ahmed R Impact of Epitope Escape on PD-1 Expression and CD8 T-Cell Exhaustion during Chronic Infection. J Virol 83, 4386–4394 (2009). - PMC - PubMed
    1. Odorizzi PM, Pauken KE, Paley MA, Sharpe A & Wherry EJ Genetic absence of PD-1 promotes accumulation of terminally differentiated exhausted CD8+ T cells. J Exp Med 212, 1125–1137 (2015). - PMC - PubMed
    1. Araki K et al. Pathogenic virus-specific T cells cause disease during treatment with the calcineurin inhibitor FK506: implications for transplantation. J Exp Med 207, 2355–2367 (2010). - PMC - PubMed
    1. Kurachi M et al. Optimized retroviral transduction of mouse T cells for in vivo assessment of gene function. Nat Protoc 12, 1980–1998 (2017). - PMC - PubMed