. 2019 Jul;571(7764):270-274.
doi: 10.1038/s41586-019-1324-y. Epub 2019 Jun 17.

TOX is a critical regulator of tumour-specific T cell differentiation

Affiliations

TOX is a critical regulator of tumour-specific T cell differentiation

Andrew C Scott et al. Nature. 2019 Jul.

Abstract

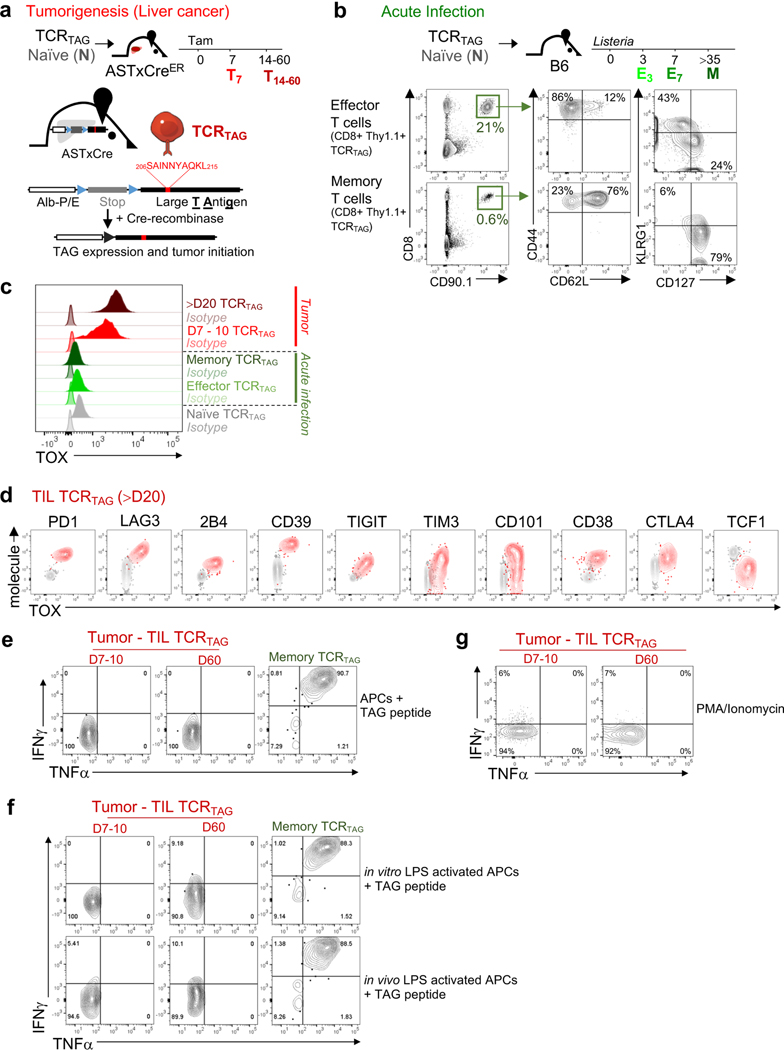
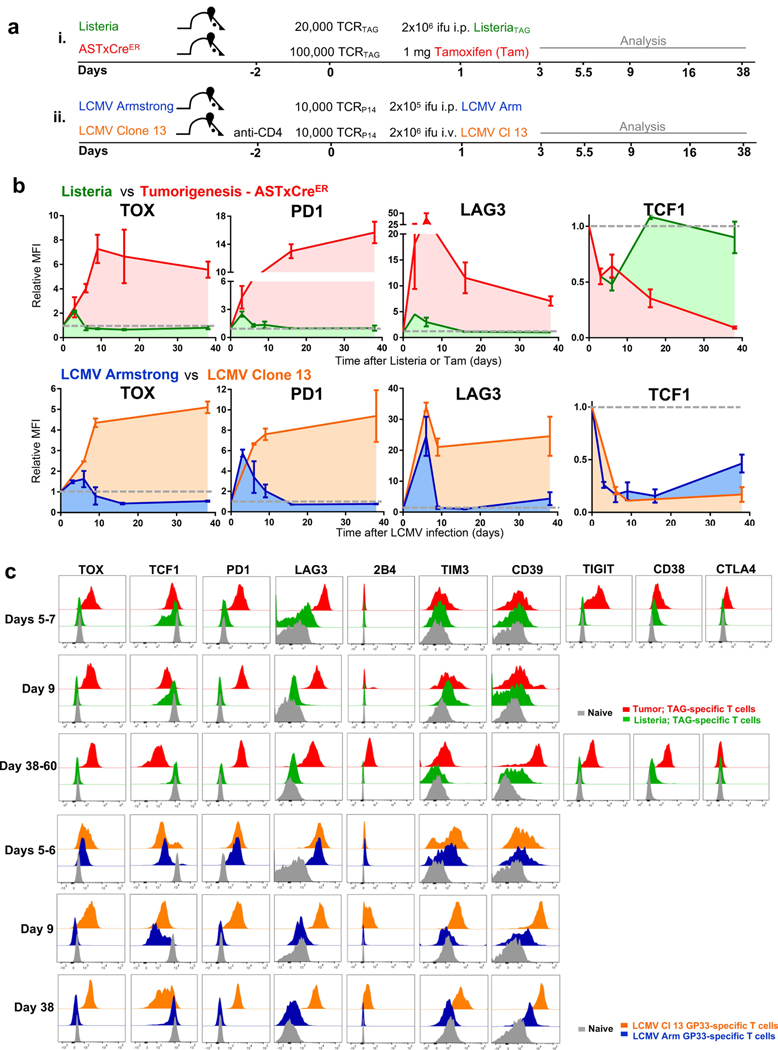
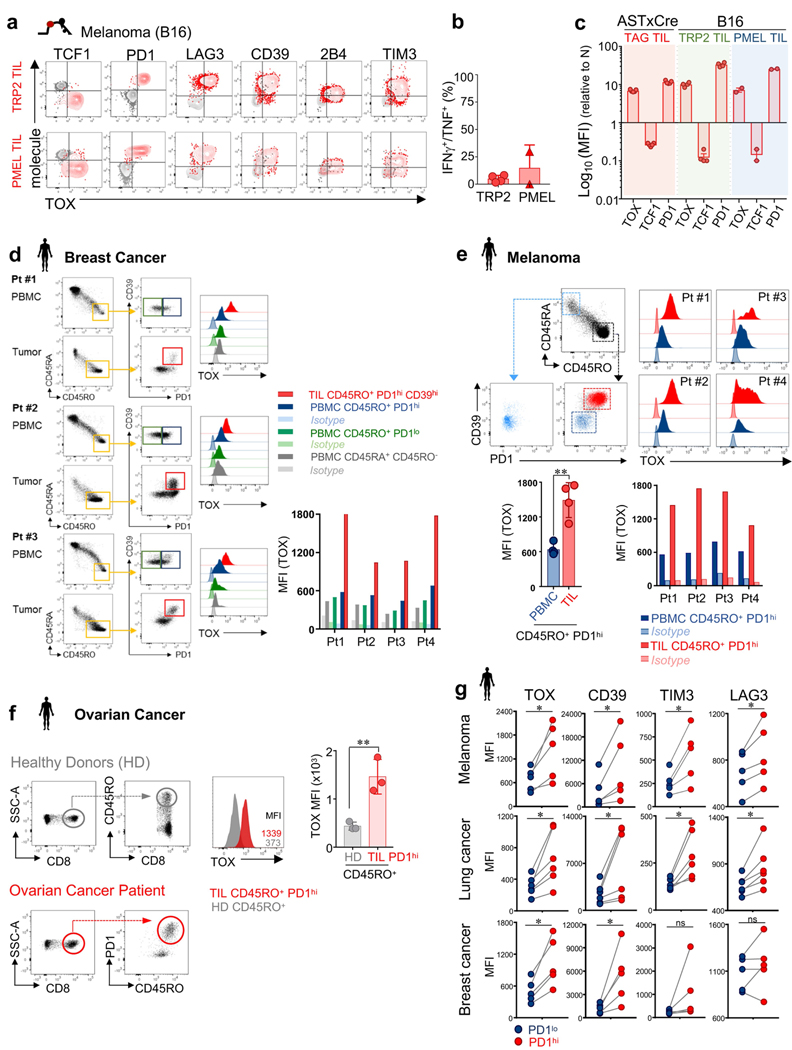
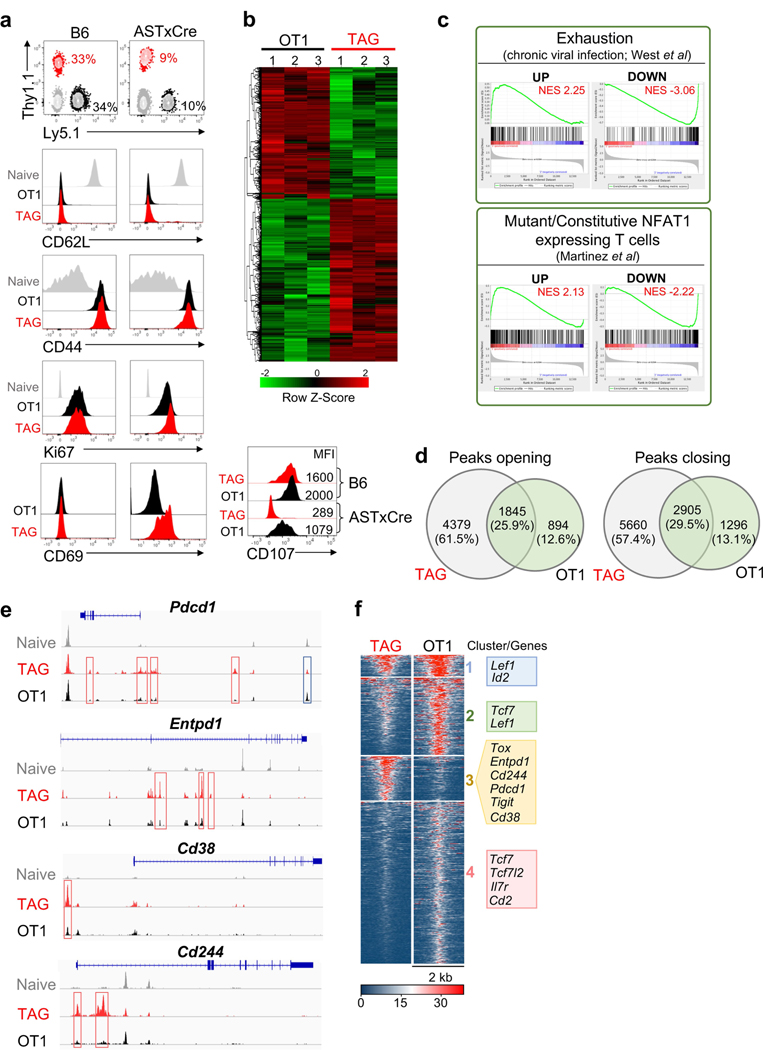
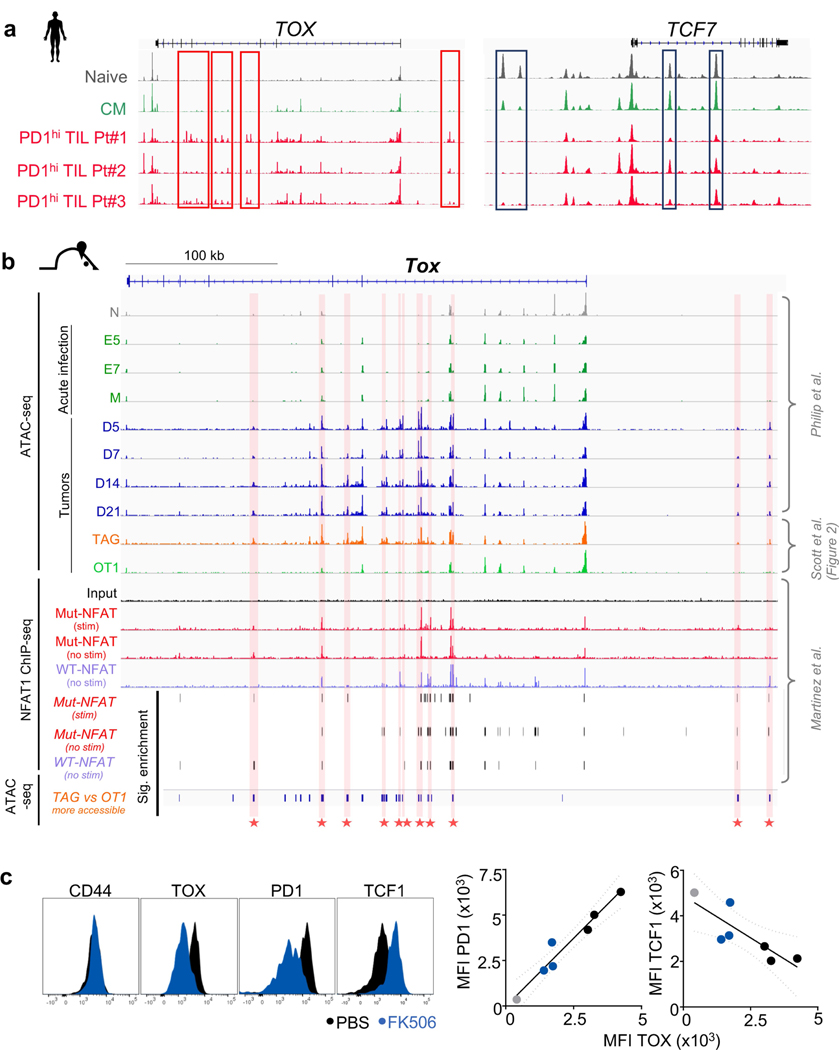
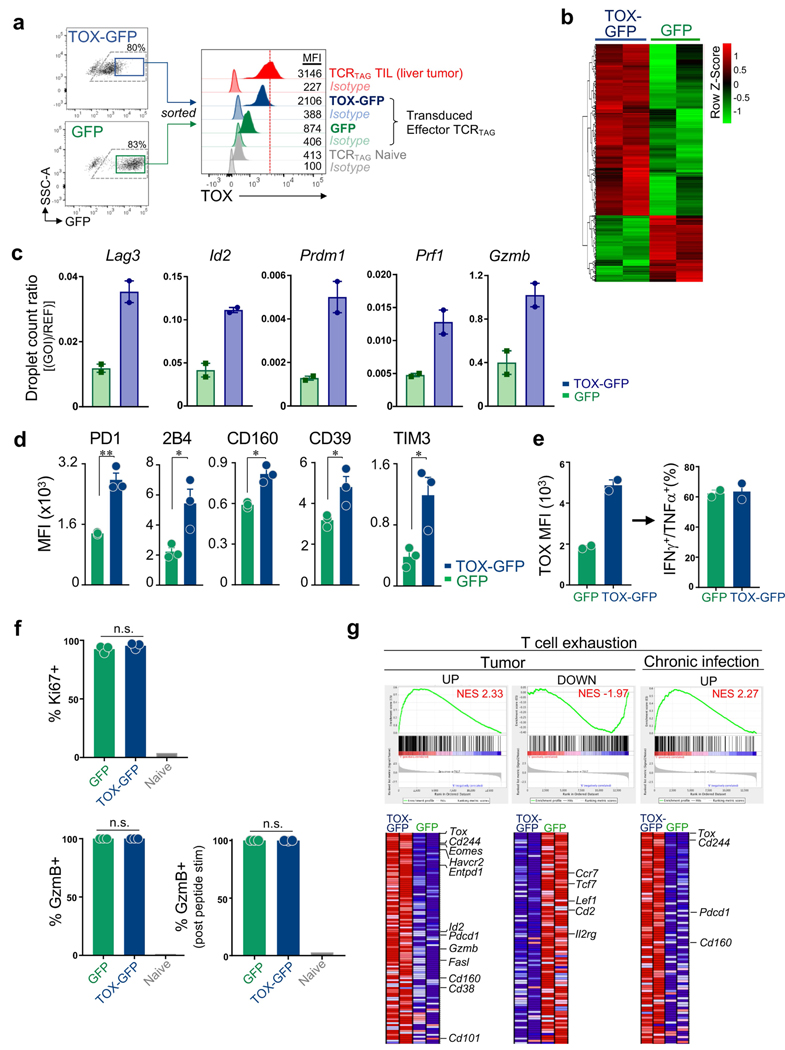
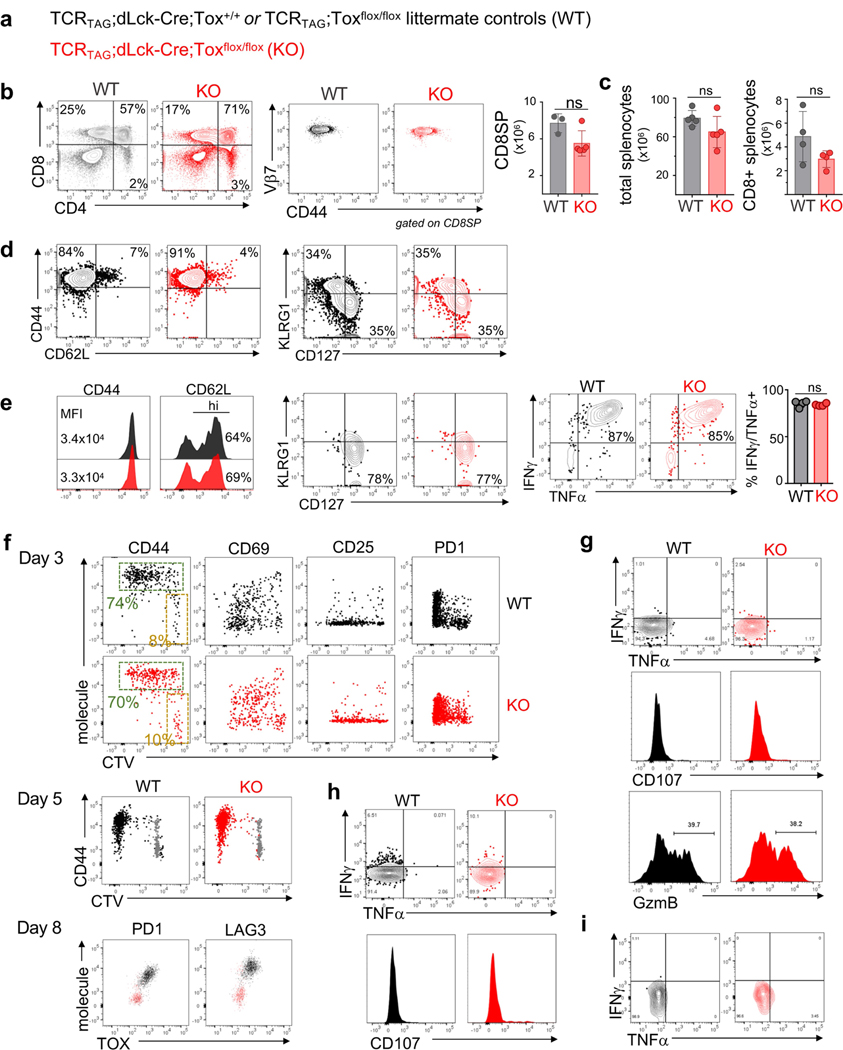
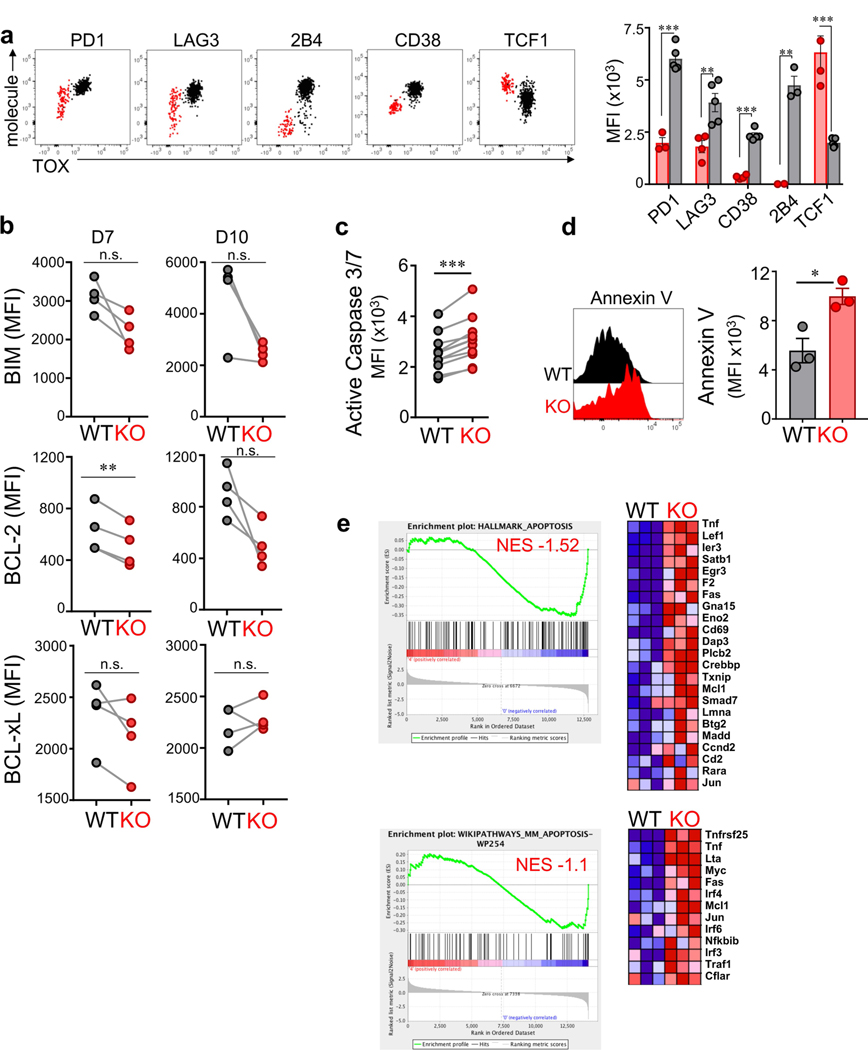
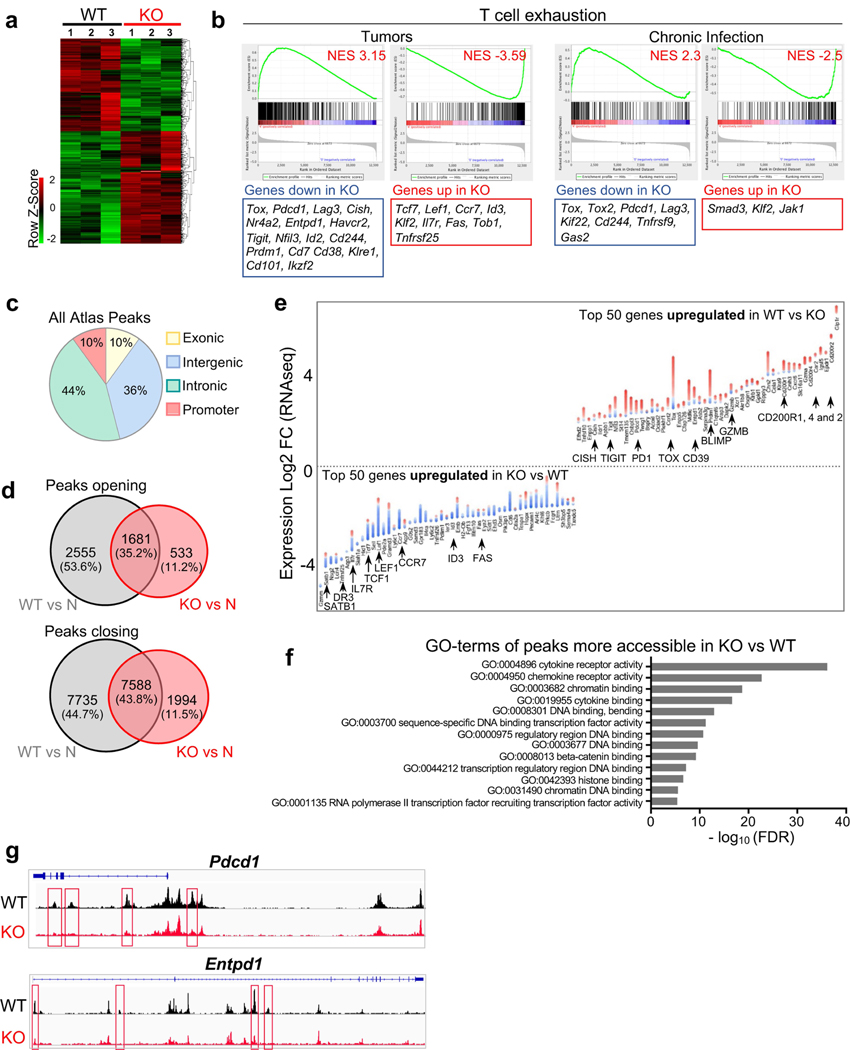
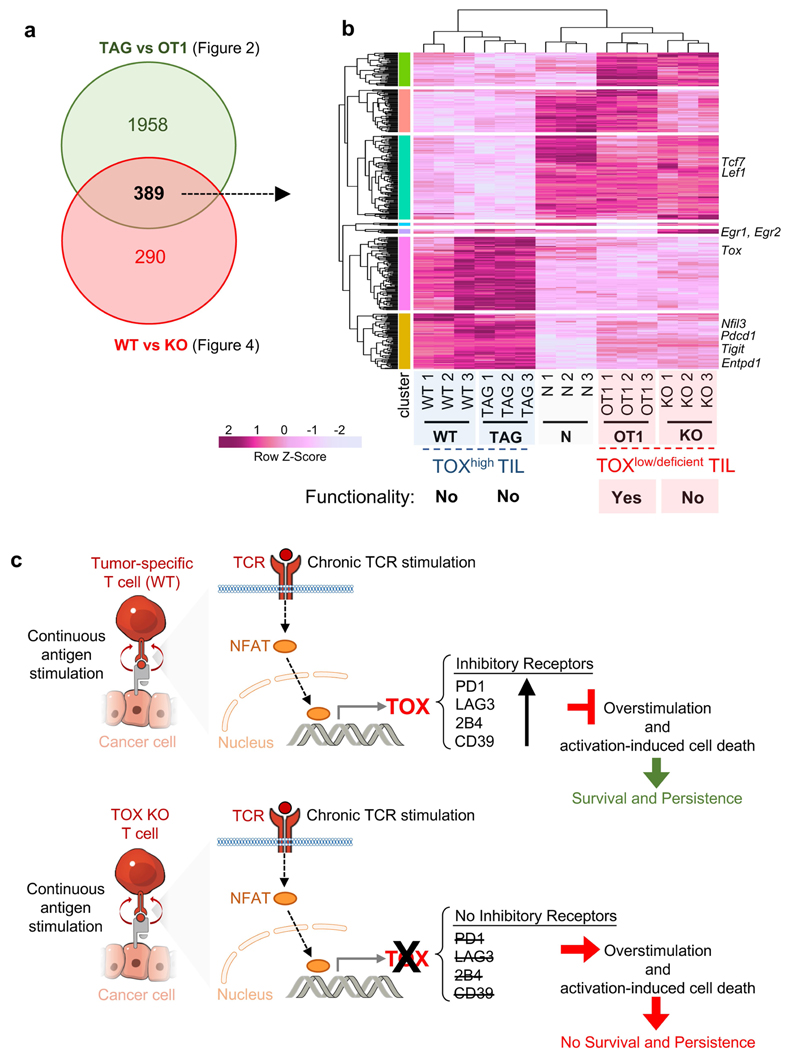
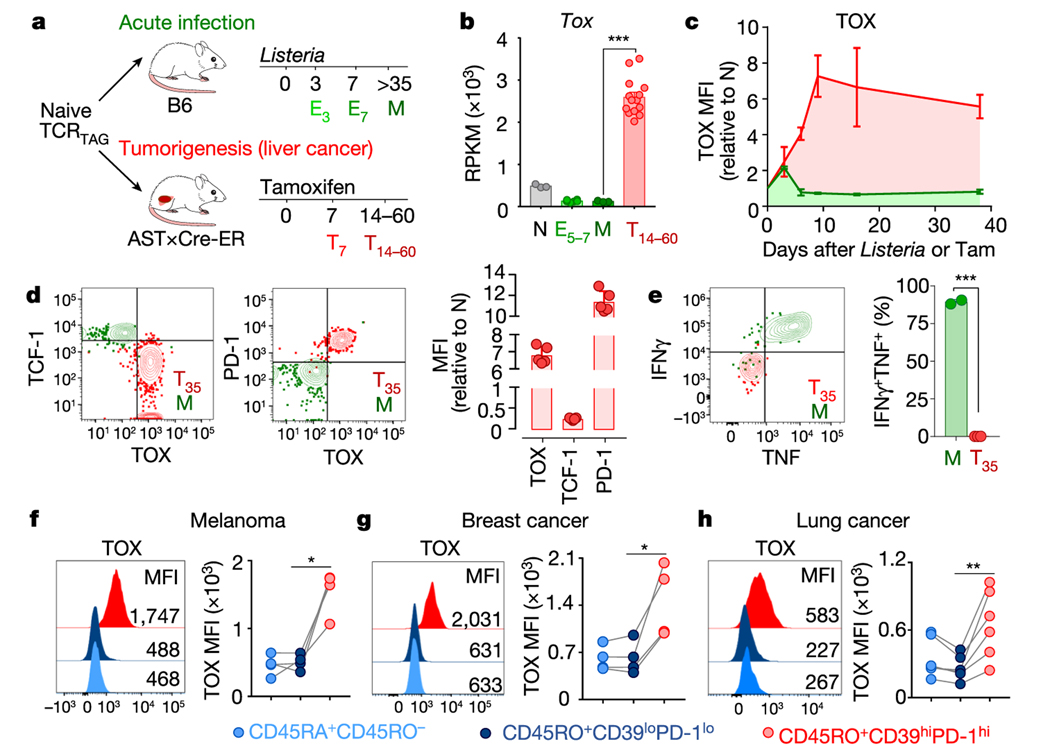
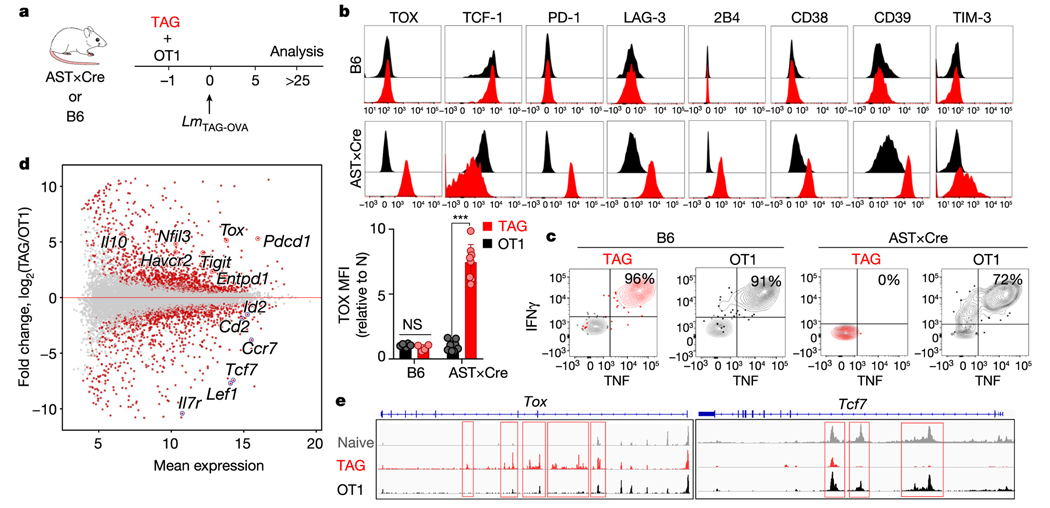
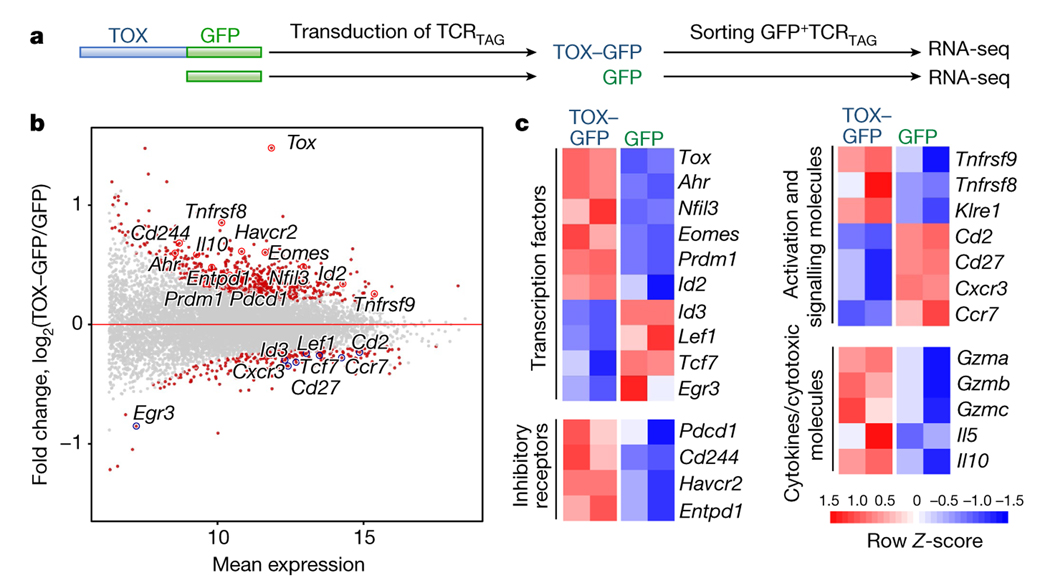
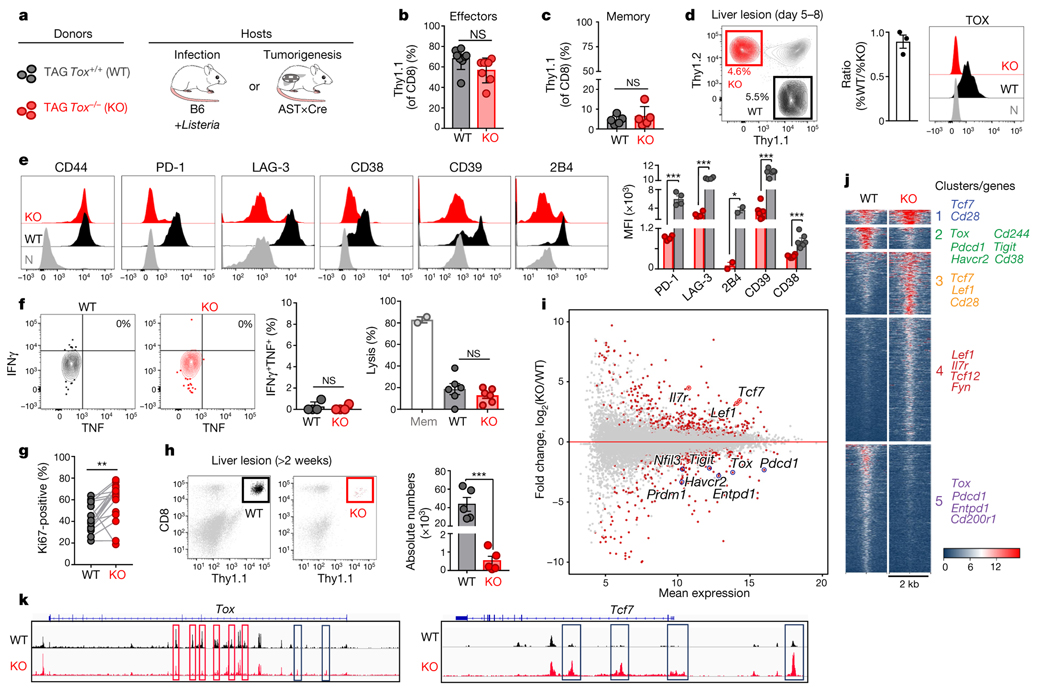
Tumour-specific CD8 T cell dysfunction is a differentiation state that is distinct from the functional effector or memory T cell states1-6. Here we identify the nuclear factor TOX as a crucial regulator of the differentiation of tumour-specific T (TST) cells. We show that TOX is highly expressed in dysfunctional TST cells from tumours and in exhausted T cells during chronic viral infection. Expression of TOX is driven by chronic T cell receptor stimulation and NFAT activation. Ectopic expression of TOX in effector T cells in vitro induced a transcriptional program associated with T cell exhaustion. Conversely, deletion of Tox in TST cells in tumours abrogated the exhaustion program: Tox-deleted TST cells did not upregulate genes for inhibitory receptors (such as Pdcd1, Entpd1, Havcr2, Cd244 and Tigit), the chromatin of which remained largely inaccessible, and retained high expression of transcription factors such as TCF-1. Despite their normal, 'non-exhausted' immunophenotype, Tox-deleted TST cells remained dysfunctional, which suggests that the regulation of expression of inhibitory receptors is uncoupled from the loss of effector function. Notably, although Tox-deleted CD8 T cells differentiated normally to effector and memory states in response to acute infection, Tox-deleted TST cells failed to persist in tumours. We hypothesize that the TOX-induced exhaustion program serves to prevent the overstimulation of T cells and activation-induced cell death in settings of chronic antigen stimulation such as cancer.


Figures

Extended Data Fig. 1 |
Extended Data Fig. 1 |. T cell differentiation during tumorigenesis.
a, Scheme of autochthonous liver cancer model to investigate tumour-specific CD8 T cell differentiation and dysfunction. AST×Cre liver cancer model. Cre-mediated deletion of the flox-stop cassette leads to TAG expression and tumour initiation. TAG-specific CD8 T cells isolated from TCRTAG transgenic mice recognize TAG epitope I (shown in red) on major histocompatibility complex (MHC) class I H-2Db. Tamoxifen-inducible Cre-ERT2 (AST×Cre-ERT2) or constitutive Alb-Cre (AST×Alb-Cre) mouse strains are used as indicated. b, Top, scheme of Listeria infection. Bottom, phenotypic characterization of Thy1.1+ effector and memory TCRTAG cells isolated from spleens 7 and more than 35 days after transfer into B6 mice followed by Listeria infection. Gating strategy is shown. KLRG1, CD127, CD44 and CD62L expression levels are shown. c, Naive congenically marked (Thy1.1+) TCRTAG CD8 T cells were adoptively transferred into (Thy1.2+) B6 mice and immunized with TAG-expressing Listeria strain, or were transferred into tumour-bearing (Thy1.2+) AST×Alb-Cre mice. T cells were isolated 7 or more than 20 days after transfer from either spleens (for effector and memory T cells after Listeria infection) or liver tumour lesions of AST×Alb-Cre mice. TOX expression was assessed by flow cytometry. TOX isotype is shown as a control for each sample. Naive TCRTAG cells are shown in grey as a control. d, Flow cytometric analysis of TCRTAG cells isolated from liver lesions of AST×Cre-ERT2 mice more than 20 days after transfer (red). TOX expression with PD-1, LAG-3, 2B4, CD39, TIGIT, TIM-3, CD101, CD38, CTLA4 and TCF-1 expression levels are shown. Naive TCRTAG cells are shown in grey as a control. eg, Intracellular IFNγ and TNF production of TCRTAG cells isolated at days 7–10 and day 60 after transfer into AST×Cre-ERT2 mice after 4-h ex vivo peptide stimulation with antigen-presenting cells (APCs) (from B6 spleens) (e), or peptide stimulation with in vitro (f, top) or in vivo (f, bottom) LPS-activated splenocytes (f), or stimulation with PMA and ionomycin (g). LPS-mediated activation of APCs was confirmed by flow cytometric analysis assessing the upregulation of MHC-II, CD80, CD86 and CD40 on CD11c+ APCs, CD11b+ APCs and CD19+ B cells (splenocytes). Memory TCRTAG cells are shown as controls. Gates are set based on no-peptide controls. All FACS plots are gated on CD8+Thy1.1+ TCRTAG cells (experiments in f and g are repeated twice). These data are representative of more than ten independent experiments.
Extended Data Fig. 2 |
Extended Data Fig. 2 |. Antigen-specific CD8 T cell differentiation during acute and chronic viral LCMV infections, acute Listeria infection, and during tumorigenesis.
a, Top, experimental scheme for acute L. monocytogenes (expressing TAG epitope I) infection (green) and AST×Cre-ERT2 liver tumorigenesis after treatment with tamoxifen (red). Bottom, experimental scheme for acute (Armstrong; blue) and chronic (clone 13; orange) infection with LCMV. b, Expression profiles of TOX, PD-1, LAG-3 and TCF-1 at various time points after infection or tamoxifen treatment. Relative MFI values are shown normalized to naive transgenic TCRP14 T cells (specific for the LCMV epitope GP33) or naive TCRTAG T cells (dashed grey line). c, Top, flow cytometric analysis of TOX, TCF-1, PD-1, LAG-3, 2B4, TIM-3, CD39, TIGIT, CD38 and CTLA4 expression levels of TCRTAG T cells after Listeria infection (green) or tamoxifen treatment (red). Bottom, flow cytometric analysis of TOX, TCF-1, PD-1, LAG-3, 2B4, TIM-3 and CD39 expression levels of GP33-specific T cells at indicated time points after infections with LCMV Armstrong (blue) and LCMV clone 13 (orange). Naive T cells are shown in grey as a control. Data are mean ± s.d. and are representative of two independent experiments with n = 2 (Listeria) and n = 2–3 (AST×Cre-ERT2; LCMV Armstrong; LCMV clone 13) mice per time point.
Extended Data Fig. 3 |
Extended Data Fig. 3 |. Phenotypic and functional characterization of TILs from mouse and human tumours.
a–c, TCRTRP2 (TRP2) and TCRPMEL (PMEL) TILs in mouse B16 melanoma tumours. a, TOX expression and TCF-1, PD-1, LAG-3, CD39, 2B4 and TIM-3 expression levels of TRP2 (Thy1.1+) TILs (red; top) and PMEL (Thy1.1+) TILs (red; bottom) isolated more than 15 days after adoptive transfer from established B16 melanoma tumours growing subcutaneously in B6 (Thy1.2+) mice. Naive CD8 T cells are shown in grey as a control. T cells are gated on CD8+Thy1.1+ cells. b, Intracellular IFNγ and TNF production of TRP2 and PMEL TILs after 4-h peptide stimulation ex vivo. c, Relative MFI values of TOX, TCF-1 and PD-1 of the indicated tumour models and TIL specificities shown on a log10 scale. Each symbol represents an individual mouse. Data are mean ± s.e.m of n = 2 (PMEL); n = 4 (TRP2); and n = 5 (TAG) mice, and are representative of two independent experiments. d–g, Phenotypic characterization and TOX expression profiles of human TILs and PBMCs isolated from patients with melanoma, lung, breast and ovarian cancer. d, Flow cytometric analysis of PBMCs and TILs of patients with breast cancer. TOX expression of TILs and matched PBMC CD8+ T cells. Gating strategy is shown. CD45RO+PD-1hiCD39hi (TILs; red), CD45RO+PD-1hi (PBMCs; blue), CD45RO+PD-1lo (PBMCs; green), and CD45RA+CD45RO (naive PBMCs; grey). TOX isotypes are shown as controls for each sample. e, Top, TOX expression in human CD45RO+PD-1loCD39lo (dark blue) and CD45RO+PD-1hiCD39hi (red) TILs isolated from human primary melanoma. Isotypes are shown and data correspond to Fig. 1f. Bottom, TOX expression of TILs and matched PBMC CD8+ T cells from patients with melanoma. CD45RO+PD-1hi (TIL; red; n = 4), CD45RO+PD-1hi (PBMCs; blue, n = 4). TOX isotypes are shown as controls for each sample/patient. Bar plot shows MFI values for TOX. Each symbol represents an individual TIL and PBMC matched pair. f, TOX expression in human PD-1hi TILs isolated from human primary ovarian tumours. Flow plots are gated on CD8+CD45RO+PD-1hi T cells (red). CD8+CD45RO+ T cells from healthy donors are shown in grey. Gating strategy is shown. Each symbol represents a patient or healthy donor sample. g, TOX, CD39, TIM-3 and LAG-3 expression of CD8+CD45RO+PD-1hi (red) and CD8+CD45RO+PD-1lo (blue) TILs from human melanoma (n = 5), breast (n = 5) and lung (n = 6) tumours. Each symbol represents an individual matched PD-1hi/PD-1lo patient sample. Data are mean ± s.e.m. *P ≤ 0.05, **P ≤ 0.01, ***P ≤ 0.001, two-sided Student’s t-test. ns, not significant.
Extended Data Fig. 4 |
Extended Data Fig. 4 |. Phenotypic, functional, transcriptional and epigenetic characterization of TCR TAG and TCROT1 cells in liver tumours.
a, Approximately 3 × 10⁴ TCRTAG (TAG, red; Thy1.1+) and TCROT1 (OT1, black; Ly5.1+) T cells were transferred into wild-type B6 mice or liver tumour-bearing AST×Alb-Cre mice and immunized with 5 × 10⁶ CFU of Listeria LmTAG-I-OVA. Three to four weeks after immunization, livers from AST×Alb-Cre mice and spleens from B6 mice were analysed for the presence of donor TAG and OT1 T cells by FACS; the percentages of CD8 T cells are shown. Expression of CD62L, CD44, CD69 and Ki67 of TAG and OT1 T cells. Naive T cells are shown in grey as a control. CD107 expression after 4-h TAG or OVA peptide stimulation of TAG and OT1 TILs isolated 3–4 weeks after transfer. Flow plots are gated on CD8+Thy1.1+ and CD8+Ly5.1+ cells. Data are representative of three independent experiments. b, Heat map of RNA-seq-normalized expression values (log2(counts per million)) across all samples (colour corresponds to z-scores) for genes differentially expressed between TAG and OT1 T cells (FDR < 0.05). c, GSEA of RNA-seq data generated from TAG and OT1T cells isolated from AST×Cre liver lesions 3 weeks after adoptive transfer and Listeria infection. Gene sets used: T cell exhaustion during chronic viral infection (GEO accession GSE30962) and mutant/constitutivelyactive form of NFAT1-overexpressing CD8 T cells. NES, normalized enrichment score. d, Venn diagrams showing the numbers and percentage of significantly opening (left) and closing (right) peaks between TAG and OT1 T cells (FDR < 0.05, log2-transformed fold change > 2). e, Genome browser view of ATAC-seq signal intensities of TAG and OT1 T cells at Pdcd1, Entpd1, Cd38 and Cd244 loci. Red or blue boxes indicate peaks that become significantly more accessible or inaccessible in TAG versus OT1 T cells, respectively. ATAC-seq peaks from naive TAG T cells are shown in grey as a control. f, Chromatin accessibility heat map for TAG and OT1 T cells. Each row represents one peak (differentially accessible between TAG and OT1 T cells; FDR < 0.05) displayed over a 2-kb window centred on the peak summit; regions were clustered using k-means clustering. Genes associated with individual clusters are highlighted.
Extended Data Fig. 5 |
Extended Data Fig. 5 |. Chromatin accessibility of the mouse and human Tox locus.
a, Accessibility of TOX and TCF7 loci in human tumour-infiltrating PD-1hiCD8+ T cells. ATAC-seq signal profiles of TOX (left) and TCF7 (right) in naive CD8+CD45RA+ (grey), CD8+CD45RO+CD62L+ central memory T cells (green) and CD8+CD45RO+PD-1hi TILs isolated from patients with melanoma and lung cancer (red). Red or blue boxes, respectively, indicate peaks that become accessible or inaccessible in PD-1hi TILs as compared to naive or memory T cells. Naive and memory T cells were isolated from PBMCs of healthy donors. b, c, NFAT1 binds to differentially accessible regions in the Tox locus in mice and pharmacological targeting of NFAT1 reduces TOX expression. b, Genome browser view of the Tox locus and numerous ATAC-seq and ChIP–seq tracks. On top, ATAC-seq signals of naive (N; grey), effector (E5, E7; green), memory (M; green), dysfunctional liver tumour-infiltrating TCRTAG cells (blue series, with D indicating the days after transfer when T cells were isolated from liver lesions) are shown. These data are from ref. . These are followed by newly generated ATAC-seq data from TCRTAG (TAG; orange) and TCROT1 (OT1; green) cells from AST×Cre liver lesions (as described in Fig. 2) as well as NFAT1 ChIP–seq tracks generated previously representing wild-type NFAT1 (blue) and mutant/constitutive active NFAT1-overexpressing T cells (red) (with and without stimulation). The vertical bars at the bottom of the plot represent statistically significantly enriched NFAT1-binding sites (peaks) as well as regions with statistically significantly changing accessibility between ATAC-seq of OT1 and TAG T cells. Red stars and pink boxes highlight NFAT1-binding sites that overlap with regions of increased chromatin accessibility in dysfunctional TCRTAG compared to TCROT1 cells. c, Pharmacological targeting of NFAT signalling decreases TOX expression in vivo. Naive TCRTAG (Thy1.1+) cells were transferred into AST×Cre-ERT2 (Thy1.2+) mice, which were treated with tamoxifen (Tam) 1 day later. At days 2–9, mice were treated with the calcineurin inhibitor FK506 (2.5 mg per kg per mouse; blue, n = 3) or PBS (control group; black, n = 3). At day 10, TCRTAG cells were isolated from livers and assessed for expression of CD44, TOX, PD-1 and TCF-1. Linear regression analysis of MFI values are shown. Naive TCRTAG cells are shown in grey as a control (n = 1). Each symbol represents an individual mouse. R2= 0.6886 (TOX/TCF-1); R2 = 0.947 (TOX/PD-1); data are representative of two independent experiments. Dotted lines represent 95% confidence interval.
Extended Data Fig. 6 |
Extended Data Fig. 6 |. Ectopic expression of TOX in T cells in vitro induces a molecular signature of T cell exhaustion.
a, Gating strategy for TOX–GFP-expressing (blue) and GFP-expressing (green) TCRTAG cells, and their corresponding TOX expression levels. TOX isotypes are shown for each sample. Naive TCRTAG cells adoptively transferred into AST×Cre mice and isolated from liver tumours after transfer (red), and naive TCRTAG cells (grey) are shown as controls. Inset numbers show MFI values. b, Heat map of RNA-seq expression values (row normalized log2(counts per million)) for genes differentially expressed between TOX–GFP and GFP TCRTAG cells (FDR < 0.10). c, Relative expression of selected genes as determined by digital droplet PCR. Data show raw droplet counts normalized to the housekeeping gene, Gapdh; n = 2 (TOX– GFP, GFP). d, Flow cytometric analysis of PD-1, 2B4, CD160, CD39 and TIM-3 expression levels of TOX–GFP (n = 3) or GFP (n = 3)-expressing TCRTAG cells. e, FACS analysis of TOX expression (left) on day 6 after spinfection of TCRTAG cells transduced with TOX–GFP (n = 2) or GFP (n = 2), and cytokine production (right) after 4-h peptide stimulation. f, Percentage of Ki67+ cells (top), and GZMB+ cells (with or without 4-h peptide stimulation) (bottom) in TCRTAG cells transduced with TOX–GFP (blue, n = 3) or GFP (green, n = 3). Naive TCRTAG cells are shown in grey as a control (n = 1). Data are mean ± s.e.m and representative of two independent experiments (n = 3 per experiment, with n representing a biological replicate/individual transduced spleen). *P ≤ 0.05, **P ≤ 0.01, two-sided Student’s t-test. g, GSEA of TCRTAG cells transduced with TOX–GFP or GFP. T cell exhaustion gene sets used: tumour-specific T cell dysfunction (left), and T cell exhaustion during chronic viral infection (GEO accession GSE30962) (right). Corresponding heat maps with selected genes with significant enrichment scores are shown below.
Extended Data Fig. 7 |
Extended Data Fig. 7 |. Phenotypic and functional characterization of TOX wild-type and knockout TCRTAG mice.
a, Mouse strains generated and used in this study. We define wild type as littermate controls TCRTAG;dLck-Cre;Tox+/+ or TCRTAG;Toxfl/fl. We define knockout as TOX-deficient T cells from TCRTAG;dLck-Cre;Toxfl/fl mice. b, Thymocytes and peripheral CD8 T cells from knockout mice develop normally. CD4 and CD8 flow staining of thymocytes isolated from knockout (red, n = 5) or littermate controls (grey, n = 3). TCR Vβ7 and CD44 expression, and enumeration of single-positive CD8+ thymocytes from knockout and wild-type mice. c, Enumeration of total splenocytes (n = 5) and CD8+ splenocytes (n = 4) of knockout and wild-type mice. d, e, TOX is not required for effector and memory CD8 T cell differentiation during acute Listeria infection. d, Approximately 1 × 10⁵ congenically marked naive wild-type and knockout TCRTAG T cells were adoptively transferred into B6 mice, and infected with Listeria 1 day later. Flow cytometric analysis of CD44, CD62L, CD127 and KLRG1 expression directly ex vivo (inset numbers show percentage in respective quadrants) of wild-type and knockout effector TCRTAG cells isolated from spleens of LmTAG-immunized B6 mice 7 days after immunization. e, Flow cytometric analysis of CD44, CD62L, CD127 and KLRG1 expression of wild-type and knockout memory TCRTAG cells isolated from spleens of LmTAG-immunized B6 mice 3 weeks after immunization. Right, intracellular IFNγ and TNF production after 4-h ex vivo TAG peptide stimulation of wild-type (n = 4) and knockout (n = 4) memory TCRTAG T cells. Flow plots are gated on CD8+Thy1.1+ cells. Data are representative of at least three independent experiments. fi, Phenotypic and functional characterization of TOX wild-type and knockout TCRTAG cells differentiating in developing liver tumours of AST×Cre mice. f, Top, CD44, CD69, CD25 and PD-1 expression and CellTrace Violet (CTV) dilution of adoptively transferred, CTV-labelled naive wild-type (black) or knockout (red) TCRTAG cells isolated from livers of AST×Cre mice 3 days after transfer. Data are representative of three independent experiments. Middle, expression of CD44 and proliferation (CTV dilution) of wild-type (black) or knockout (red) TCRTAG cells isolated from AST×Cre liver lesions 5 days after transfer. CTV-labelled TCRTAG cells transferred into B6 control mice are shown in grey as controls transferred and isolated at the same time points. Bottom, PD-1 and LAG-3 expression together with TOX expression of wild-type and knockout TCRTAG cells isolated from the livers of AST×Cre mice 8 days after transfer. All FACS plots are gated on CD8+ and Thy1.1+. g, Flow cytometric analysis of intracellular IFNγ and TNF production (top), CD107 degranulation (middle), and GZMB expression (bottom) of day 7–10 wild-type (black) or knockout (red) TCRTAG cells after 4-h peptide stimulation. h, i, PMA and ionomycin stimulation (h) or 4-h peptide stimulation using in vivo LPS-activated APCs (i). Each sample is gated on its respective no-peptide control. All flow plots are gated on CD8+Thy1.1+ T cells. Data are representative of three independent experiment and shown as mean ± s.e.m. P values determined by two sided Student’s t-test.
Extended Data Fig. 8 |
Extended Data Fig. 8 |. TOX wild-type and knockout TCRTAG cells reveal differences in genes and proteins associated with apoptosis.
a, Flow cytometric analysis of PD-1 (n = 3 (KO); n = 5 (WT)), LAG-3 (n = 4 (KO); n = 5 (WT)), CD38 (n = 4 (KO); n = 5 (WT)), 2B4 (n = 2 (KO); n = 3 (WT)), and TCF-1 (n = 4 (KO); n = 5 (WT)), expression levels in wild-type (black) or knockout (red) TCRTAG cells isolated from liver lesions approximately 3 weeks after adoptive transfer. Data are representative of at least three independent experiments. b, Flow cytometric analysis of TOX wild-type (black) and knockout (red) TCRTAG cells isolated 7–10 days after transfer from AST×Cre liver lesions. BIM, BCL-2 and BCL-xL expression levels were assessed directly ex vivo. Each pair of symbols represents an individual mouse (n = 4). Data are representative of two independent experiments. c, Flow cytometric analysis of active caspases 3 and 7 in TOX wild-type (black) and knockout (red) TCRTAG cells. These data are combined results of two experiments (n = 11). Each pair of symbols represents an individual mouse. d, Representative histograms and quantification of annexin V+ wild-type (black, n = 3) and knockout (red, n = 3) TCRTAG cells isolated 7–10 days after transfer from AST×Cre liver lesions. e, GSEA of DEGs between TOX wild-type and knockout T cells. ‘Hallmark_apoptosis’ and ‘wikipathways_MM_apoptosis_WP254’ gene sets show normalized enrichment score (NES) of −1.52 and −1.1, respectively, and the corresponding heat maps of genes with significant enrichment scores are shown. Data are mean ± s.e.m. *P ≤ 0.05, **P ≤ 0.01, ***P ≤ 0.001, two-sided Student’s t-test.
Extended Data Fig. 9 |
Extended Data Fig. 9 |. TOX wild-type and knockout TCRTAG cells reveal transcriptional and chromatin accessibility changes.
a, Heat map of RNA-seq expression (row normalized log2(counts per million)) for genes differentially expressed between TOX wild-type and knockout TCRTAG cells (FDR < 0.05). b, GSEA between wild-type and knockout TCRTAG. T cell exhaustion gene sets used: tumour-specific T cell dysfunction (left) and T cell exhaustion during chronic viral infection (GEO accession GSE30962) (right). Selected genes with significant enrichment score are listed. c, Pie chart showing the proportions of reproducible ATAC-seq peaks in indicated regions for all peaks within the atlas. d, Venn diagrams showing the numbers and percentages of significantly opening (top) and closing (bottom) peaks between TOX wild-type and knockout TCRTAG cells (FDR < 0.05, log2-transformed fold change > 2). e, Gains and losses of regulatory elements for the top 100 most DEGs between TOX wild-type and knockout TCRTAG cells that were part of the gene set of tumour-specific T cell dysfunction. The plot is divided into top and bottom 50 genes with the highest and lowest respective log2-transformed fold change of gene expression. Each gene is illustrated by a stack of diamonds, in which each diamond represents a region of high chromatin accessibility (peak) overlapping with the locus of the respective gene. Red diamonds denote peaks that are more accessible in wild-type (and less accessible in TOX KO) T cells; blue diamonds denote peaks that are more accessible in TOX knockout T cells. f, Molecular function (GO terms) enriched in genes associated with peaks that are more accessible in TOX knockout versus wild-type T cells. g, ATAC-seq signal profiles across the Pdcd1 and Entpd1 loci. Peaks less accessible in knockout TCRTAG cells are highlighted in red.
Extended Data Fig. 10 |
Extended Data Fig. 10 |. Comparison of functional TOXlow OT1 and dysfunctional TOX knockout T cells in tumours with proposed model on the role of TOX in tumour-specific CD8 T cell exhaustion and dysfunction.
a, DEGs of the TAG versus OT1 comparison (see Fig. 2) were compared with DEGs of the wild-type versus TOX-knockout comparison (see Fig. 4). There were 389 genes identified to be significantly differentially expressed in both (WT vs KO and TAG vs OT1). b, Heat map of normalized expression values (log2(counts per million)) across all samples (colour corresponds to z-scores) for these 389 genes. Selected genes of interest are highlighted. c, Proposed model on the role of TOX in tumour-specific CD8 T cell exhaustion and dysfunction. Top, antigen-specific T cells in solid tumours are continuously triggered with tumour antigen. Chronic TCR stimulation leads to NFAT-mediated expression of TOX. TOX induces a transcriptional and epigenetic program and phenotype associated with exhaustion, including the expression of numerous inhibitory receptors (for example, PD-1, LAG-3, 2B4, CD39 and CD38) and downregulation of transcription factors (such as TCF-1). The TOX-mediated exhaustion program prevents T cells from overactivation or overstimulation and activation-induced cell death. Bottom, TOX-deficient T cells do not upregulate inhibitory receptors, become overstimulated or overactivated, and eventually undergo activation-induced cell death. Despite their non-exhausted phenotype, TOX-deficient T cells are dysfunctional.
Fig. 1 |
Fig. 1 |. TOX is highly expressed in tumour-infiltrating CD8 T cells of mouse and human tumours.
a, Experimental scheme for acute infection (green) and tumorigenesis (red). E3 and E7, effector cells isolated 3 and 7 days after immunization, respectively; M, memory cells; T7 and T14–60, T cells isolated from liver tumours at 7 and 14–60 days after transfer. b, Reads per kilobase of transcript per million mapped read (RPKM) values of Tox. n = 3 (naive (N), memory); n = 6 (E5–7); n = 14 (T14–60) TCRTAG cells isolated from liver tumour lesions of AST×Cre-ERT2 mice at 14, 21, 28, 35 and more than 60 days after transfer. c, Expression levels of TOX protein in TCRTAG cells during Listeria infection (green) or tumorigenesis (red), assessed by flow cytometry at indicated time points with n = 2–3 mice. MFI, mean fluorescent intensity; Tam, tamoxifen. d, Expression of TOX, TCF-1 and PD-1 in TCRTAG cells isolated from liver tumour lesions 35 days after transfer (T35; red, n= 5); memory TCRTAG cells are shown as control (M; green). e, IFNγ and TNF production of memory TCRTAG cells (M; green, n= 2) and liver tumour-infiltrating TCRTAG cells (T; red, n= 3). Data are representative of more than five independent experiments. fh, TOX expression in human tumour-infiltrating CD8+ T cells isolated from patients with melanoma (n = 4) (f), breast cancer (n = 4) (g), and lung cancer (n = 6) (h). Each symbol represents an individual mouse (for be) or individual patient (for fh). Data are mean ± s.e.m. *P ≤ 0.05, **P ≤ 0.01, ***P ≤ 0.001, two-sided Student’s t-test.
Fig. 2 |
Fig. 2 |. Chronic TCR stimulation drives TOX expression in tumour-specific CD8 T cells.
a, Experimental scheme of TCRTAG (TAG) and TCROT1 (OT1) T cell co-transfer. b, Top, expression profiles of TAG (red) and OT1 (black) isolated from the spleens of B6 mice (top; n = 6 (OT1), n = 4 (TAG)) or the livers of AST×Alb-Cre mice (bottom; n = 8 (OT1), n = 8 (TAG)), 3–4 weeks after transfer and immunization. Bottom, MFI values of TOX expression relative to naive T cells. Each symbol represents an individual mouse. Data are representative of three independent experiments. c, Intracellular IFNγ and TNF production of TAG and OT1 isolated 3–4 weeks after transfer and immunization from spleens of B6 mice (left) or liver tumour lesions of AST×Cre mice (right). Data are representative of three independent experiments. d, MA plot of the RNA-seq dataset. Significantly DEGs are shown in red. e, ATAC-seq signal profiles across the Tox and Tcf7 loci. Peaks uniquely lost or gained in TAG compared with OT1 are highlighted in red. Data are mean ± s.e.m. ***P ≤ 0.001, two-sided Student’s t-test. NS, not significant.
Fig. 3 |
Fig. 3 |. Ectopic expression of TOX is sufficient to induce a global molecular program characteristic of T cell exhaustion.
a, Experimental scheme (see also Methods). b, MA plot of RNA-seq dataset. Significantly DEGs are coloured in red. c, Heat map of RNA-seq expression (rownormalized log2 (counts per million) for DEGs; false discovery rate (FDR) < 0.10) in TOX–GFP+ and GFP+ TCRTAG cells.
Fig. 4 |
Fig. 4 |. Phenotypic, functional, transcriptional and epigenetic analysis of TOX-deficient T cells.
a, Experimental scheme. b, c, Percentage of wild-type (WT; black) and knockout (KO; red) Thy1.1+ effector (b) or memory (c) TCRTAG cells isolated from spleens 7 days (b) or 3 weeks (c) after LmTAG infection, respectively. For b, n = 8 (WT); n = 7 (KO); for c, n = 5 (WT); n = 5 (KO); two independent experiments. d, Left, wild-type and knockout TCRTAG cells isolated from malignant liver lesions 5–8 days after transfer into AST×Cre-ERT2 (Thy1.1+Thy1.2+) mice. Middle, ratio of the percentage of wild-type and knockout T cells. Right, TOX expression of liver-infiltrating wild-type and knockout TCRTAG cells; naive TCRTAG cells are shown in grey as a control. e, Expression profiles of liver-infiltrating wild-type and knockout TCRTAG cells 8–10 days after adoptive transfer. Naive TCRTAG cells are shown in grey. Data are representative of more than five independent experiments (n = 4 (PD-1/LAG-3); n = 2 (2B4); n = 6 (CD39/CD38)). f, Left, intracellular IFNγ and TNF production of wild-type (n = 4) and TOX-knockout (n = 4) TCRTAG cells isolated 10 days after transfer from liver lesions of AST×Cre mice. Right, specific lysis of TAG-peptide-pulsed EL4 cells in chromium release assays by wild-type (n = 6) and knockout (n = 6) TCRTAG cells isolated and flow-sorted from liver tumour lesions. Results from two independent experiments. Memory (Mem) TCRTAG cells are shown as a control. g, Percentage of Ki67-positive wild-type and knockout TCRTAG cells from malignant liver lesions 6–8 days after transfer into AST×Cre mice. Data are from three independent experiments. h, Wild-type and knockout donor TCRTAG cells 19 days after transfer in liver tumours (WT, n = 5; KO, n = 5). Data are representative of two independent experiments. In bh, each symbol represents an individual mouse. i, MA plot of RNA-seq data. Significantly DEGs are in red. j, Chromatin accessibility of wild-type and knockout TCRTAG cells. Each row represents one peak (differentially accessible between wild-type and knockout; FDR < 0.05) displayed over a 2-kb window centred on the peak summit; regions were clustered with k-means clustering. Genes associated with peaks within individual clusters are highlighted. k, ATAC-seq signal profiles across the Tox and Tcf7 loci. Peaks uniquely lost or gained in knockout TCRTAG cells are highlighted in red or blue, respectively. Data are mean ± s.e.m. *P ≤ 0.05, **P ≤ 0.01, ***P ≤ 0.001, two-sided Student’s t-test.

References

    1. Thommen DS & Schumacher TN T cell dysfunction in cancer. Cancer Cell 33, 547–562 (2018). - PMC - PubMed
    1. Baitsch L et al. Exhaustion of tumor-specific CD8+ T cells in metastases from melanoma patients. J. Clin. Invest. 121, 2350–2360 (2011). - PMC - PubMed
    1. Schietinger A et al. Tumor-specific T cell dysfunction is a dynamic antigen-driven differentiation program initiated early during tumorigenesis. Immunity 45, 389–401 (2016). - PMC - PubMed
    1. Mognol GP et al. Exhaustion-associated regulatory regions in CD8+ tumor-infiltrating T cells. Proc. Natl Acad. Sci. USA 114, E2776–E2785 (2017). - PMC - PubMed
    1. Philip M et al. Chromatin states define tumour-specific T cell dysfunction and reprogramming. Nature 545, 452–456 (2017). - PMC - PubMed

MeSH terms