

Patterns of Opioid Administration Among Opioid-Naive Inpatients and Associations With Postdischarge Opioid Use: A Cohort Study
- PMID: 31207646
- PMCID: PMC6815349
- DOI: 10.7326/M18-2864
Patterns of Opioid Administration Among Opioid-Naive Inpatients and Associations With Postdischarge Opioid Use: A Cohort Study
Abstract
Background: Patterns of inpatient opioid use and their associations with postdischarge opioid use are poorly understood.
Objective: To measure patterns in timing, duration, and setting of opioid administration in opioid-naive hospitalized patients and to examine associations with postdischarge use.
Design: Retrospective cohort study using electronic health record data from 2010 to 2014.
Setting: 12 community and academic hospitals in Pennsylvania.
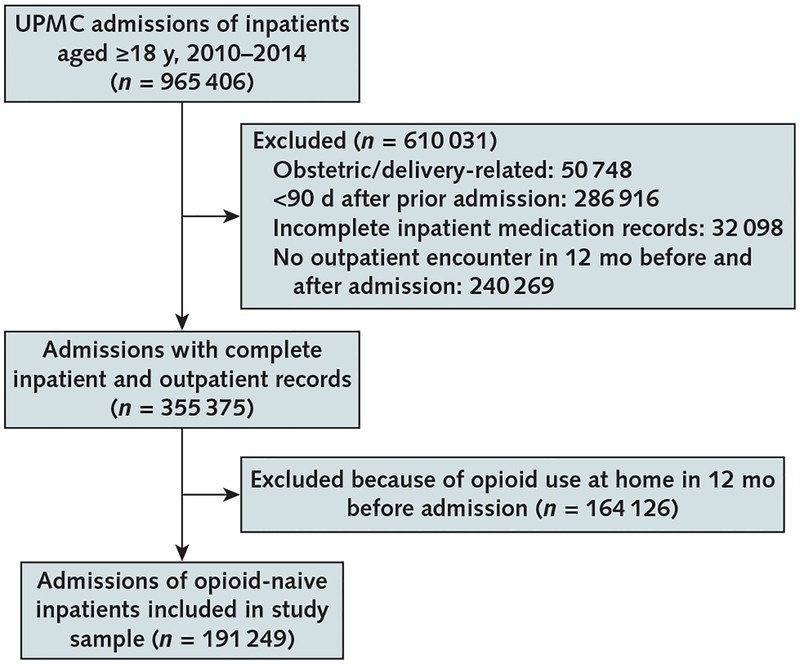
Patients: 148 068 opioid-naive patients (191 249 admissions) with at least 1 outpatient encounter within 12 months before and after admission.
Measurements: Number of days and patterns of inpatient opioid use; any outpatient use (self-report and/or prescription orders) 90 and 365 days after discharge.
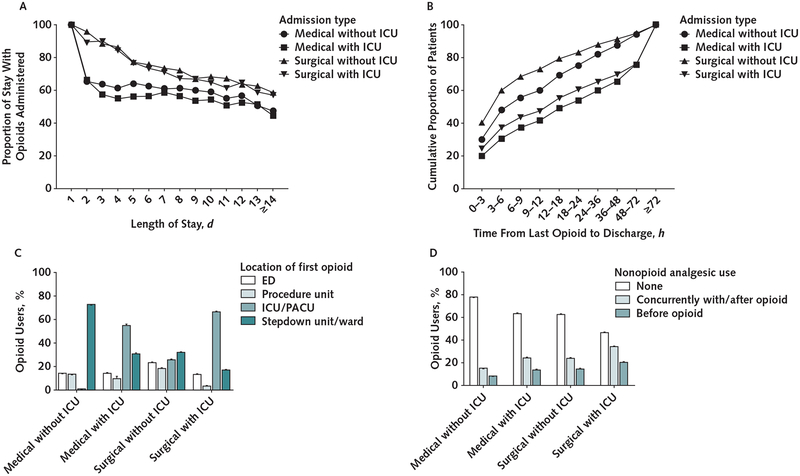
Results: Opioids were administered in 48% of admissions. Patients were given opioids for a mean of 67.9% (SD, 25.0%) of their stay. Location of administration of first opioid on admission, timing of last opioid before discharge, and receipt of nonopioid analgesics varied substantially. After adjustment for potential confounders, 5.9% of inpatients receiving opioids had outpatient use at 90 days compared with 3.0% of those without inpatient use (difference, 3.0 percentage points [95% CI, 2.8 to 3.2 percentage points]). Opioid use at 90 days was higher in inpatients receiving opioids less than 12 hours before discharge than in those with at least 24 opioid-free hours before discharge (7.5% vs. 3.9%; difference, 3.6 percentage points [CI, 3.3 to 3.9 percentage points]). Differences based on proportion of the stay with opioid use were modest (opioid use at 90 days was 6.4% and 5.4%, respectively, for patients with opioid use for ≥75% vs. ≤25% of their stay; difference, 1.0 percentage point [CI, 0.4 to 1.5 percentage points]). Associations were similar for opioid use 365 days after discharge.
Limitation: Potential unmeasured confounders related to opioid use.
Conclusion: This study found high rates of opioid administration to opioid-naive inpatients and associations between specific patterns of inpatient use and risk for long-term use after discharge.
Primary funding source: UPMC Health System and University of Pittsburgh.
Figures
Comment in
-
Opportunities to Address First Opioid Prescriptions to Reduce Incident Long-Term Opioid Use.Ann Intern Med. 2019 Jul 16;171(2):129-130. doi: 10.7326/M19-1394. Epub 2019 Jun 18. Ann Intern Med. 2019. PMID: 31207647 No abstract available.
References
-
- The White House. Council of Economic Advisers Report: The Underestimated Cost of the Opioid Crisis. 20 November 2017. Accessed at www.whitehouse.gov/briefings-statements/cea-report-underestimated-cost-o... on 26 April 2018.
-
- Krueger AB. Where have all the workers gone? An inquiry into the decline of the U.S. labor force participation rate. Brookings Papers on Economic Activity. 7 September 2017. Accessed at www.brookings.edu/bpea-articles/where-have-all-the-workers-gone-an-inqui... on 10 May 2019. - PMC - PubMed
-
- Hedegaard H, Warner M, Miniño AM. Drug Overdose Deaths in the United States, 1999–2016. NCHS Data Brief no. 294. December 2017. Accessed at www.cdc.gov/nchs/data/databriefs/db294.pdf on 10 May 2019. - PubMed
-
- Prescription Drug Abuse Policy System Web site. Accessed at www.pdaps.org on 10 May 2019.
Publication types
MeSH terms
Substances
Grants and funding
LinkOut - more resources
Full Text Sources