

Genome-Wide Profiling of Laron Syndrome Patients Identifies Novel Cancer Protection Pathways
- PMID: 31208077
- PMCID: PMC6627189
- DOI: 10.3390/cells8060596
Genome-Wide Profiling of Laron Syndrome Patients Identifies Novel Cancer Protection Pathways
Abstract
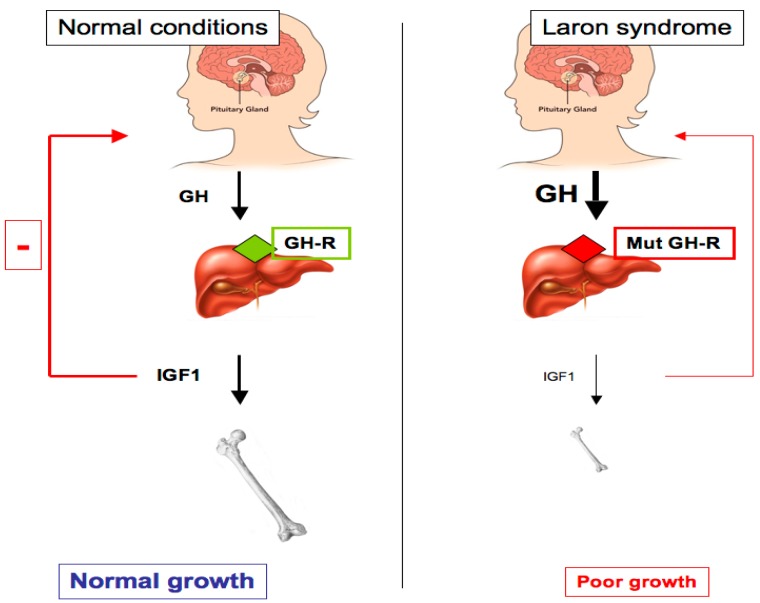
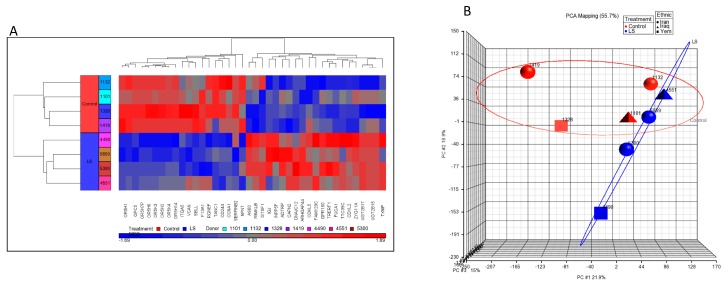
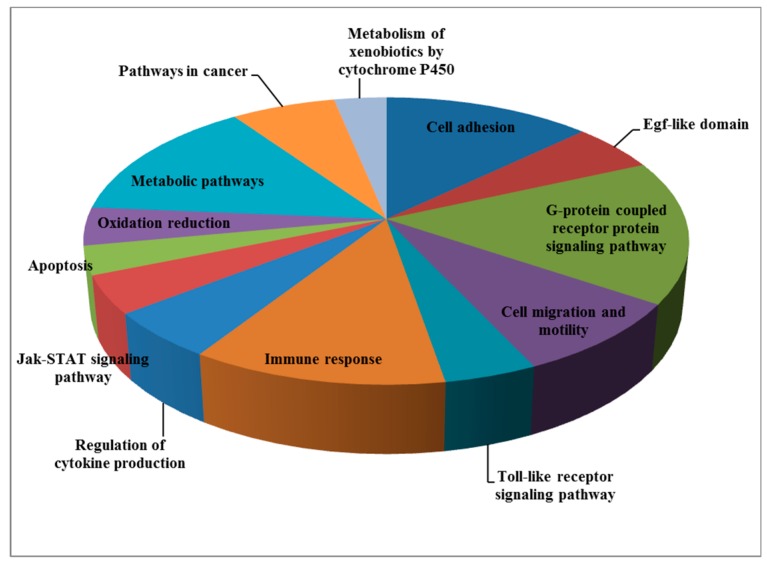
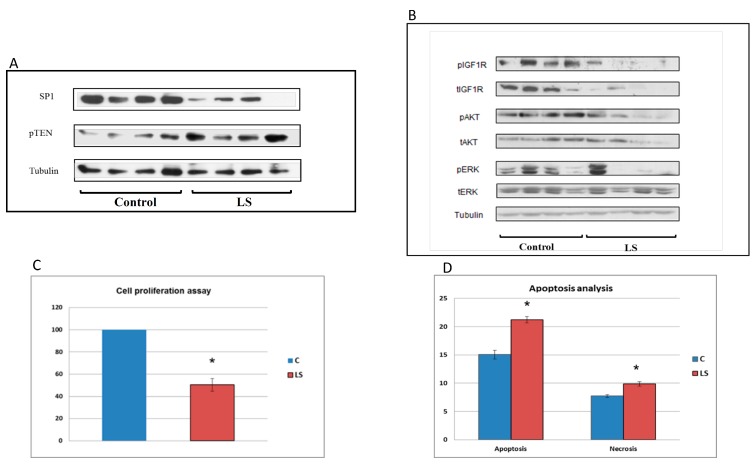
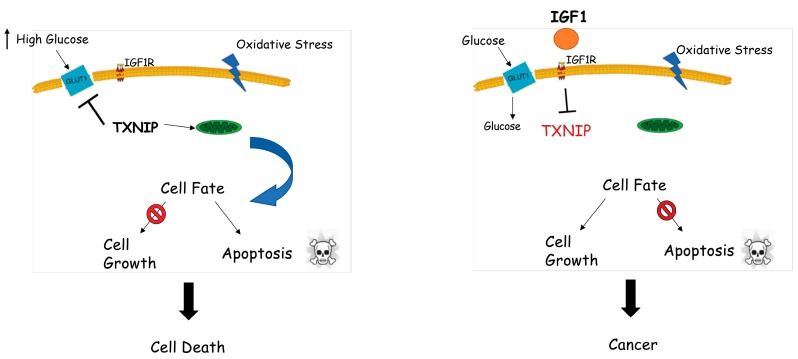
Laron syndrome (LS), or primary growth hormone resistance, is a prototypical congenital insulin-like growth factor 1 (IGF1) deficiency. The recent epidemiological finding that LS patients do not develop cancer is of major scientific and clinical relevance. Epidemiological data suggest that congenital IGF1 deficiency confers protection against the development of malignancies. This 'experiment of nature' reflects the critical role of IGF1 in tumor biology. The present review article provides an overview of recently conducted genome-wide profiling analyses aimed at identifying mechanisms and signaling pathways that are directly responsible for the link between life-time low IGF1 levels and protection from tumor development. The review underscores the concept that 'data mining' an orphan disease might translate into new developments in oncology.
Keywords: IGF1 receptor (IGF1R); Laron syndrome; cancer protection; growth hormone receptor (GH-R); insulin-like growth factor 1 (IGF1); thioredoxin-interacting protein (TXNIP).
Conflict of interest statement
The authors declare no conflict of interest.
Figures
Similar articles
-
Identification of signaling pathways associated with cancer protection in Laron syndrome.Endocr Relat Cancer. 2016 May;23(5):399-410. doi: 10.1530/ERC-16-0054. Epub 2016 Apr 18. Endocr Relat Cancer. 2016. PMID: 27090428
-
Identification of thioredoxin-interacting protein (TXNIP) as a downstream target for IGF1 action.Proc Natl Acad Sci U S A. 2018 Jan 30;115(5):1045-1050. doi: 10.1073/pnas.1715930115. Epub 2018 Jan 16. Proc Natl Acad Sci U S A. 2018. PMID: 29339473 Free PMC article.
-
Laron Syndrome Research Paves the Way for New Insights in Oncological Investigation.Cells. 2020 Nov 9;9(11):2446. doi: 10.3390/cells9112446. Cells. 2020. PMID: 33182502 Free PMC article. Review.
-
Identification of nephronectin as a new target for IGF1 action.Eur J Cancer. 2020 Dec;141:115-127. doi: 10.1016/j.ejca.2020.09.034. Epub 2020 Oct 30. Eur J Cancer. 2020. PMID: 33130549
-
The GH-IGF1 axis and longevity. The paradigm of IGF1 deficiency.Hormones (Athens). 2008 Jan-Mar;7(1):24-7. doi: 10.14310/horm.2002.1111034. Hormones (Athens). 2008. PMID: 18359741 Review.
Cited by
-
Disruption of Growth Hormone Receptor Signaling Abrogates Hepatocellular Carcinoma Development.J Hepatocell Carcinoma. 2022 Aug 15;9:823-837. doi: 10.2147/JHC.S368208. eCollection 2022. J Hepatocell Carcinoma. 2022. PMID: 35996397 Free PMC article.
-
Unraveling the IGF System Interactome in Sarcomas Exploits Novel Therapeutic Options.Cells. 2021 Aug 13;10(8):2075. doi: 10.3390/cells10082075. Cells. 2021. PMID: 34440844 Free PMC article. Review.
-
From Churchill to Elephants: The Role of Protective Genes against Cancer.Genes (Basel). 2024 Jan 18;15(1):118. doi: 10.3390/genes15010118. Genes (Basel). 2024. PMID: 38255007 Free PMC article. Review.
-
Digital Health for Supporting Precision Medicine in Pediatric Endocrine Disorders: Opportunities for Improved Patient Care.Front Pediatr. 2021 Jul 29;9:715705. doi: 10.3389/fped.2021.715705. eCollection 2021. Front Pediatr. 2021. PMID: 34395347 Free PMC article. Review.
-
Tissue-Specific GHR Knockout Mice: An Updated Review.Front Endocrinol (Lausanne). 2020 Oct 9;11:579909. doi: 10.3389/fendo.2020.579909. eCollection 2020. Front Endocrinol (Lausanne). 2020. PMID: 33162937 Free PMC article. Review.
References
Publication types
MeSH terms
Substances
LinkOut - more resources
Full Text Sources
Miscellaneous
