

Sirtuin 3 promotes microglia migration by upregulating CX3CR1
- PMID: 31208274
- PMCID: PMC6601551
- DOI: 10.1080/19336918.2019.1629224
Sirtuin 3 promotes microglia migration by upregulating CX3CR1
Abstract
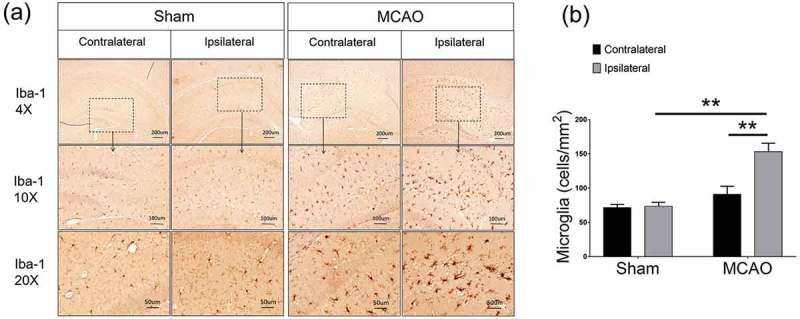
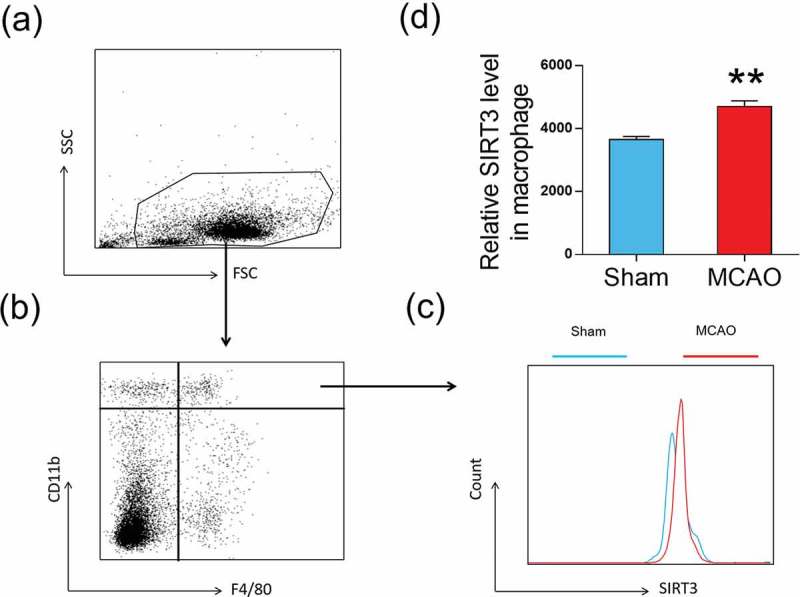
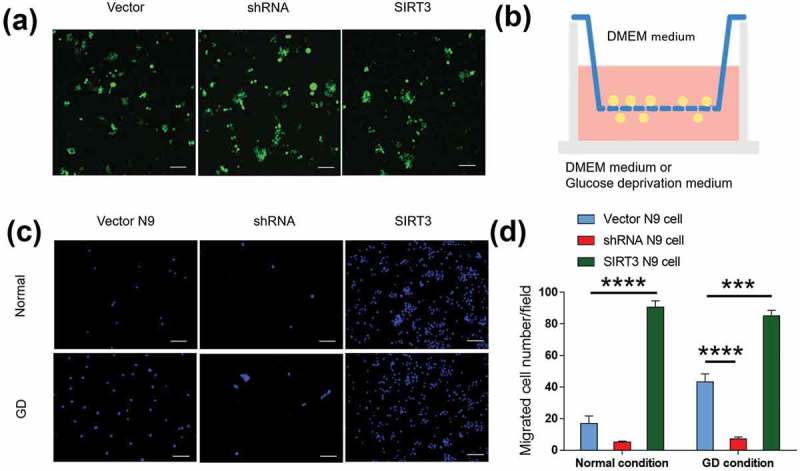
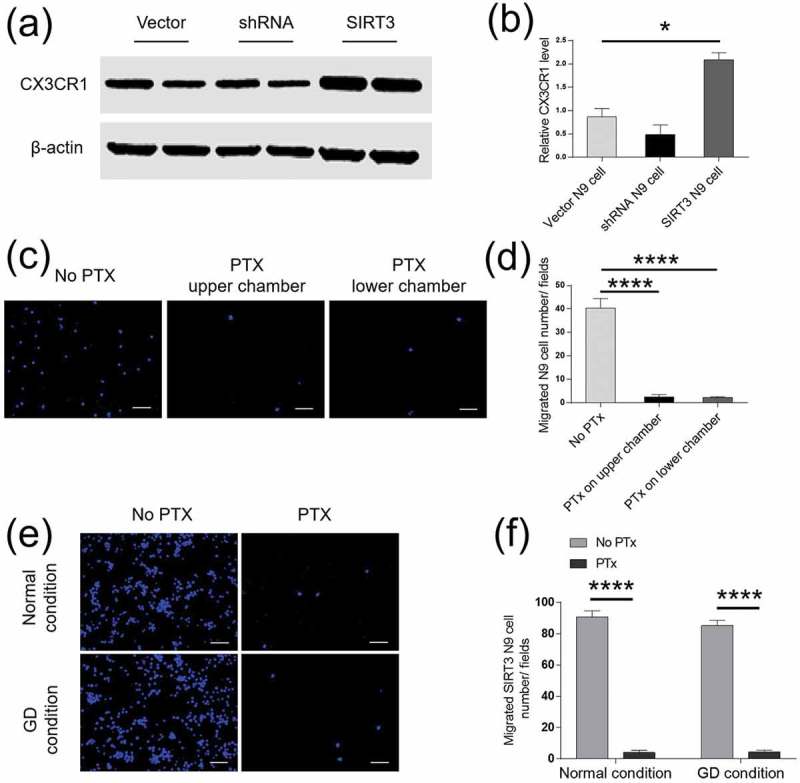
We studied the role of Sirtuin 3 (SIRT3) in microglial cell migration in ischemic stroke. We used a middle cerebral artery occlusion (MCAO) model of focal ischemia. We then applied lentivirus-packaged SIRT3 overexpression and knock down in microglial N9 cells to investigate the underlying mechanism driving microglial cell migration. More microglial cells appeared in the ischemic lesion side after MCAO. The levels of SIRT3 were increased in macrophages, the main source of microglia, after ischemia. CX3CR1 levels were increased with SIRT3 overexpression. SIRT3 promoted microglial N9 cells migration by upregulating CX3CR1 in both normal and glucose deprived culture media. These effects were G protein-dependent. Our study for the first time shows that SIRT3 promotes microglia migration by upregulating CX3CR1.
Keywords: CX3CR1; Ischemia; SIRT3; microglia migration.
Figures
Similar articles
-
CX3CR1 deficiency suppresses activation and neurotoxicity of microglia/macrophage in experimental ischemic stroke.J Neuroinflammation. 2014 Feb 3;11:26. doi: 10.1186/1742-2094-11-26. J Neuroinflammation. 2014. PMID: 24490760 Free PMC article.
-
Selective role of Na+ /H+ exchanger in Cx3cr1+ microglial activation, white matter demyelination, and post-stroke function recovery.Glia. 2018 Nov;66(11):2279-2298. doi: 10.1002/glia.23456. Epub 2018 Jul 25. Glia. 2018. PMID: 30043461 Free PMC article.
-
Targeted intracerebral delivery of the anti-inflammatory cytokine IL13 promotes alternative activation of both microglia and macrophages after stroke.J Neuroinflammation. 2018 Jun 4;15(1):174. doi: 10.1186/s12974-018-1212-7. J Neuroinflammation. 2018. PMID: 29866203 Free PMC article.
-
CX3C chemokine receptor 1 deficiency modulates microglia morphology but does not affect lesion size and short-term deficits after experimental stroke.BMC Neurosci. 2017 Jan 6;18(1):11. doi: 10.1186/s12868-016-0325-0. BMC Neurosci. 2017. PMID: 28061814 Free PMC article.
-
Role of CX3CR1 (fractalkine receptor) in brain damage and inflammation induced by focal cerebral ischemia in mouse.J Cereb Blood Flow Metab. 2008 Oct;28(10):1707-21. doi: 10.1038/jcbfm.2008.64. Epub 2008 Jun 25. J Cereb Blood Flow Metab. 2008. PMID: 18575457
Cited by
-
Role of SIRT3 in neurological diseases and rehabilitation training.Metab Brain Dis. 2023 Jan;38(1):69-89. doi: 10.1007/s11011-022-01111-4. Epub 2022 Nov 14. Metab Brain Dis. 2023. PMID: 36374406 Free PMC article. Review.
-
Potential Beneficial Actions of Fucoidan in Brain and Liver Injury, Disease, and Intoxication-Potential Implication of Sirtuins.Mar Drugs. 2020 May 5;18(5):242. doi: 10.3390/md18050242. Mar Drugs. 2020. PMID: 32380741 Free PMC article. Review.
-
Microglia at the blood brain barrier in health and disease.Front Cell Neurosci. 2024 Mar 13;18:1360195. doi: 10.3389/fncel.2024.1360195. eCollection 2024. Front Cell Neurosci. 2024. PMID: 38550920 Free PMC article. Review.
-
Effects of Microglial Activation and Polarization on Brain Injury After Stroke.Front Neurol. 2021 Jul 1;12:620948. doi: 10.3389/fneur.2021.620948. eCollection 2021. Front Neurol. 2021. PMID: 34276530 Free PMC article. Review.
-
Sirtuins functions in central nervous system cells under neurological disorders.Front Physiol. 2022 Aug 30;13:886087. doi: 10.3389/fphys.2022.886087. eCollection 2022. Front Physiol. 2022. PMID: 36111151 Free PMC article. Review.
References
Publication types
MeSH terms
Substances
LinkOut - more resources
Full Text Sources
Medical