

Trading Symmetry for Energy Cost During Walking in Healthy Adults and Persons Poststroke
- PMID: 31208276
- PMCID: PMC6688943
- DOI: 10.1177/1545968319855028
Trading Symmetry for Energy Cost During Walking in Healthy Adults and Persons Poststroke
Abstract
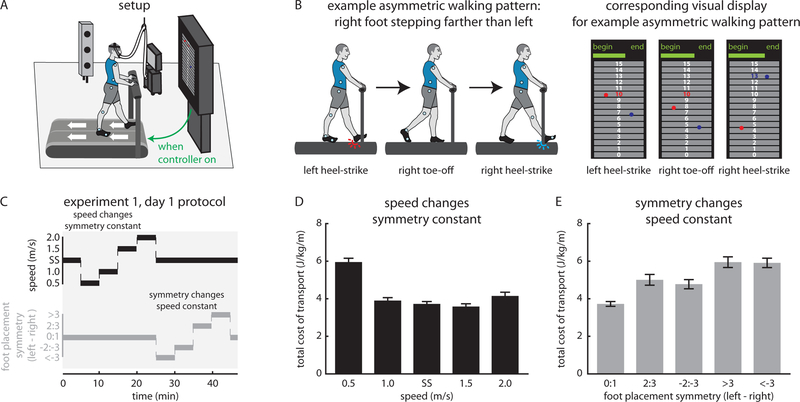
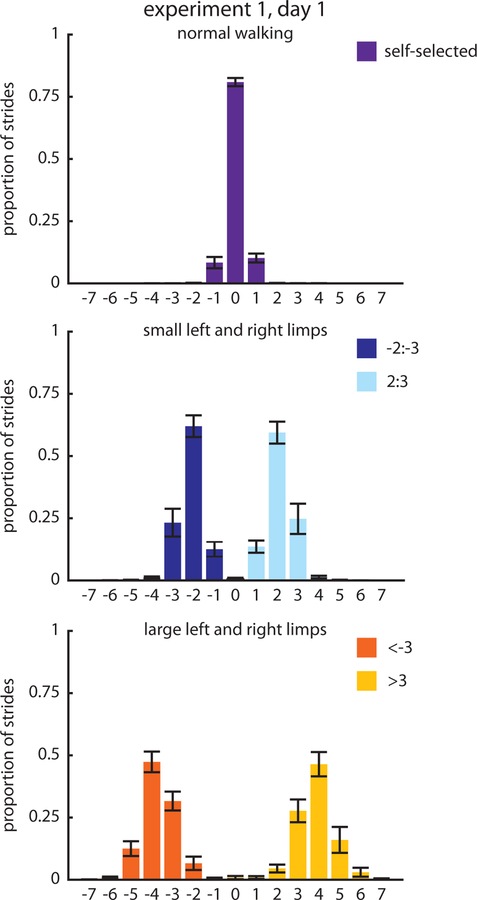
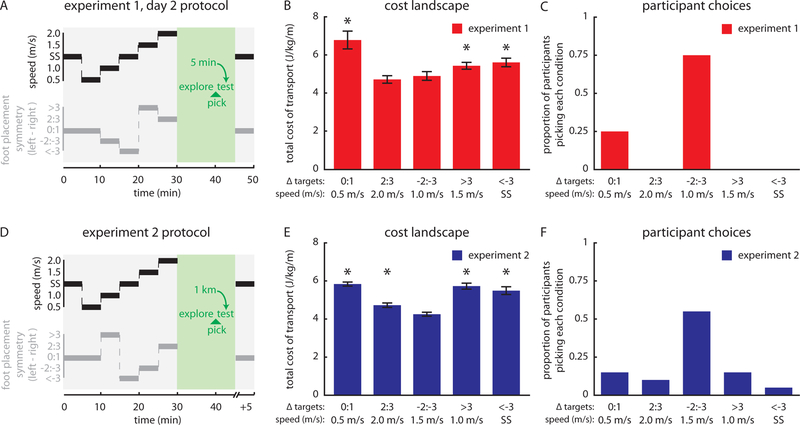
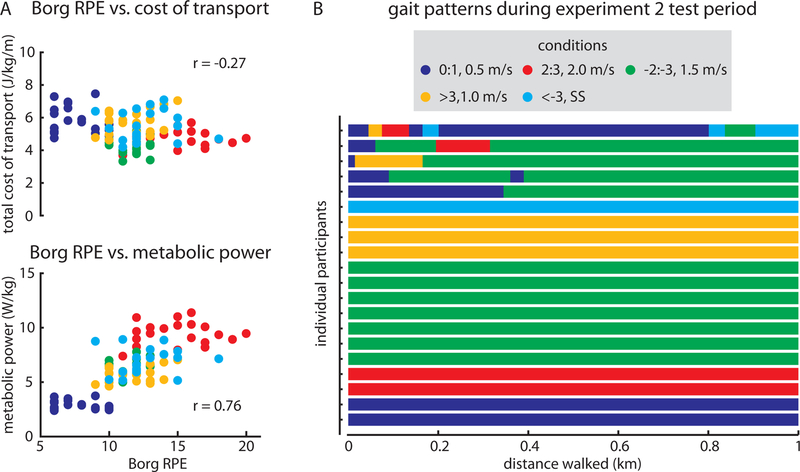
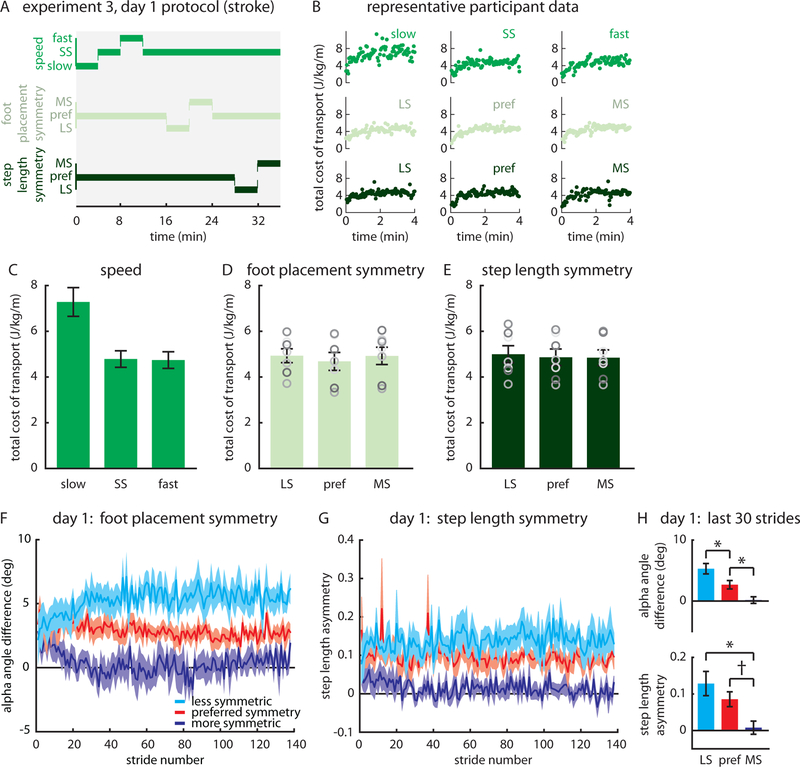
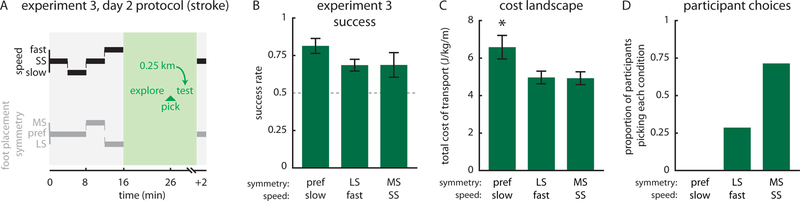
Background. Humans typically walk in ways that minimize energy cost. Recent work has found that healthy adults will even adopt new ways of walking when a new pattern costs less energy. This suggests potential for rehabilitation to drive changes in walking by altering the energy costs of walking patterns so that the desired pattern becomes energetically optimal (ie, costs least energy of all available patterns). Objective. We aimed to change gait symmetry in healthy adults and persons poststroke by creating environments where changing symmetry allowed the participants to save energy. Methods. Across 3 experiments, we tested healthy adults (n = 12 in experiment 1, n = 20 in experiment 2) and persons poststroke (n = 7 in experiment 3) in a novel treadmill environment that linked asymmetric stepping and gait speed-2 factors that influence energy cost-to create situations where walking with one's preferred gait symmetry (or asymmetry, in the case of the persons poststroke) was no longer the least energetically costly way to walk. Results. Across the 3 experiments, we found that most participants changed their gait when experiencing the new energy landscape. Healthy adults often adopted an asymmetric gait if it saved energy, and persons poststroke often began to step more symmetrically than they prefer to walk in daily life. Conclusions. We used a novel treadmill environment to show that people with and without stroke change clinically relevant features of walking to save energy. These findings suggest that rehabilitation approaches aimed at making symmetric walking energetically "easier" may promote gait symmetry after stroke.
Keywords: cost; feedback; gait; locomotion; rehabilitation; stroke.
Figures
Similar articles
-
Persons post-stroke improve step length symmetry by walking asymmetrically.J Neuroeng Rehabil. 2020 Aug 3;17(1):105. doi: 10.1186/s12984-020-00732-z. J Neuroeng Rehabil. 2020. PMID: 32746886 Free PMC article.
-
The human preference for symmetric walking often disappears when one leg is constrained.J Physiol. 2021 Feb;599(4):1243-1260. doi: 10.1113/JP280509. Epub 2020 Nov 24. J Physiol. 2021. PMID: 33231294 Free PMC article.
-
Step time asymmetry but not step length asymmetry is adapted to optimize energy cost of split-belt treadmill walking.J Physiol. 2020 Sep;598(18):4063-4078. doi: 10.1113/JP279195. Epub 2020 Jul 28. J Physiol. 2020. PMID: 32662881
-
The Split-Belt Walking Paradigm: Exploring Motor Learning and Spatiotemporal Asymmetry Poststroke.Phys Med Rehabil Clin N Am. 2015 Nov;26(4):703-13. doi: 10.1016/j.pmr.2015.06.010. Epub 2015 Sep 26. Phys Med Rehabil Clin N Am. 2015. PMID: 26522907 Free PMC article. Review.
-
Methodological Considerations in Assessing Interlimb Coordination on Poststroke Gait: A Scoping Review of Biomechanical Approaches and Outcomes.Sensors (Basel). 2022 Mar 4;22(5):2010. doi: 10.3390/s22052010. Sensors (Basel). 2022. PMID: 35271155 Free PMC article.
Cited by
-
Different Biomechanical Variables Explain Within-Subjects Versus Between-Subjects Variance in Step Length Asymmetry Post-Stroke.IEEE Trans Neural Syst Rehabil Eng. 2021;29:1188-1198. doi: 10.1109/TNSRE.2021.3090324. Epub 2021 Jun 29. IEEE Trans Neural Syst Rehabil Eng. 2021. PMID: 34138713 Free PMC article.
-
A biomechanics and energetics dataset of neurotypical adults walking with and without kinematic constraints.Sci Data. 2024 Jun 18;11(1):646. doi: 10.1038/s41597-024-03444-4. Sci Data. 2024. PMID: 38890343 Free PMC article.
-
Understanding patient preference in prosthetic ankle stiffness.J Neuroeng Rehabil. 2021 Aug 25;18(1):128. doi: 10.1186/s12984-021-00916-1. J Neuroeng Rehabil. 2021. PMID: 34433472 Free PMC article.
-
Minimization of metabolic cost of transport predicts changes in gait mechanics over a range of ankle-foot orthosis stiffnesses in individuals with bilateral plantar flexor weakness.Front Bioeng Biotechnol. 2024 May 23;12:1369507. doi: 10.3389/fbioe.2024.1369507. eCollection 2024. Front Bioeng Biotechnol. 2024. PMID: 38846804 Free PMC article.
-
Self-selected step length asymmetry is not explained by energy cost minimization in individuals with chronic stroke.J Neuroeng Rehabil. 2020 Aug 26;17(1):119. doi: 10.1186/s12984-020-00733-y. J Neuroeng Rehabil. 2020. PMID: 32847596 Free PMC article.
References
-
- Cutting JE, Kozlowski LT. Recognizing friends by their walk: gait perception without familiarity clues. Bull Psychon Soc 1977;9(5):353–356.
-
- O’Neill MC. Gait-specific metabolic costs and preferred speeds in ring-tailed lemurs (Lemur catta), with implications for the scaling of locomotor costs. Am J Phys Anthropol 2012;149(3):356–64. - PubMed
-
- Langman VA et al. Moving cheaply: energetics of walking in the African elephant. J Exp Biol 1995;198(3):629–32. - PubMed
-
- Zani PA, Kram R. Low metabolic cost of locomotion in ornate box turtles, Terrapene ornata. J Exp Biol 2008;211(23):3671–6. - PubMed
Publication types
MeSH terms
Grants and funding
LinkOut - more resources
Full Text Sources
Medical
