

Probabilistic modeling of personalized drug combinations from integrated chemical screen and molecular data in sarcoma
- PMID: 31208434
- PMCID: PMC6580486
- DOI: 10.1186/s12885-019-5681-6
Probabilistic modeling of personalized drug combinations from integrated chemical screen and molecular data in sarcoma
Abstract
Background: Cancer patients with advanced disease routinely exhaust available clinical regimens and lack actionable genomic medicine results, leaving a large patient population without effective treatments options when their disease inevitably progresses. To address the unmet clinical need for evidence-based therapy assignment when standard clinical approaches have failed, we have developed a probabilistic computational modeling approach which integrates molecular sequencing data with functional assay data to develop patient-specific combination cancer treatments.
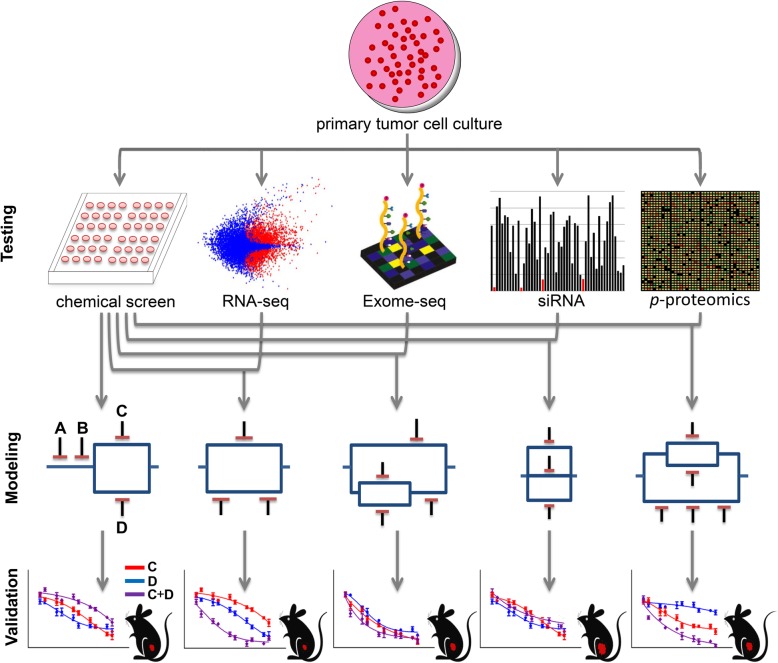
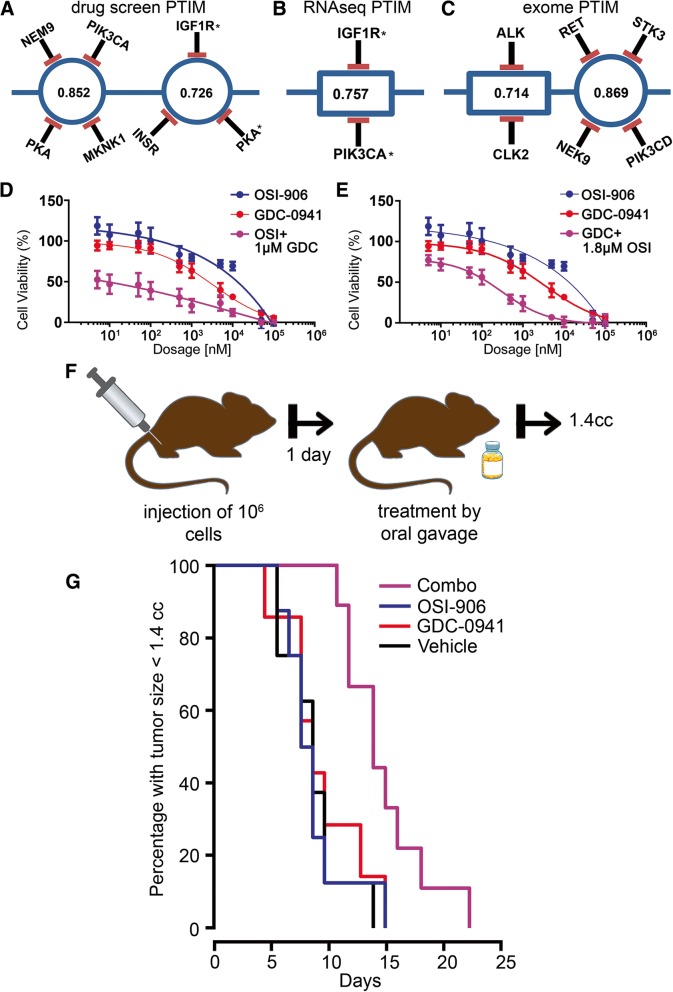
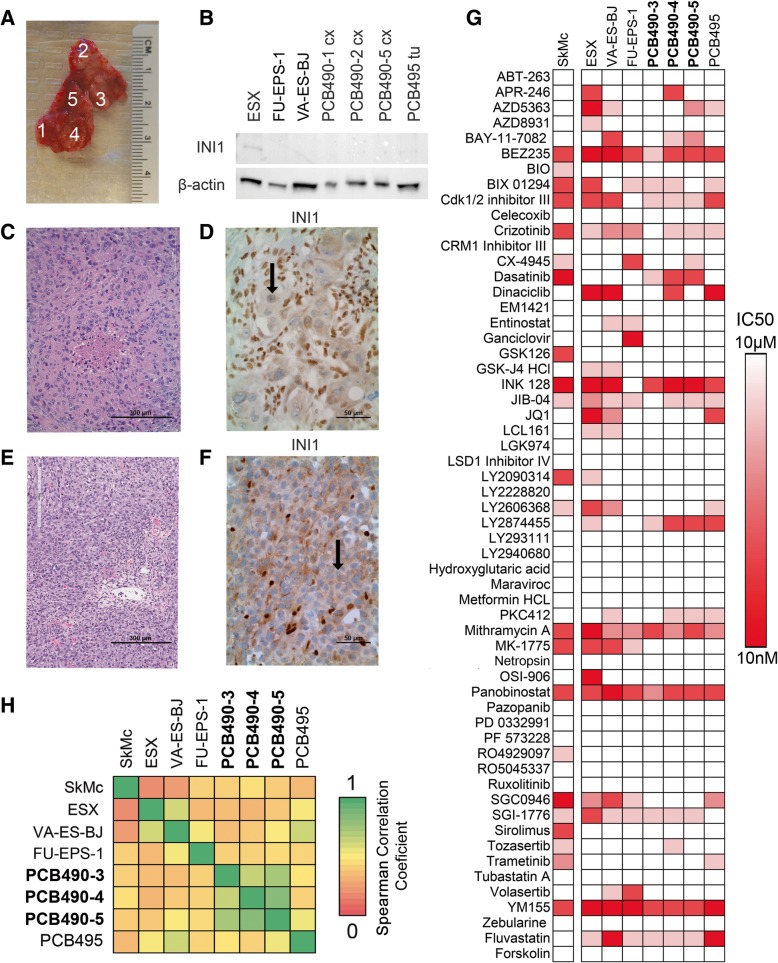
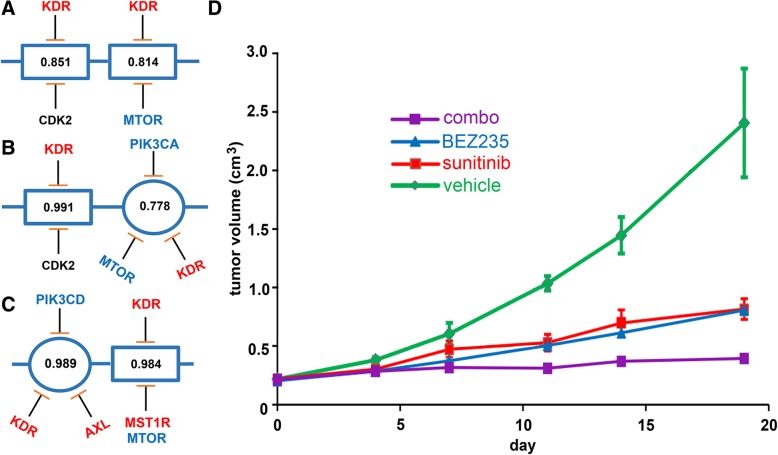
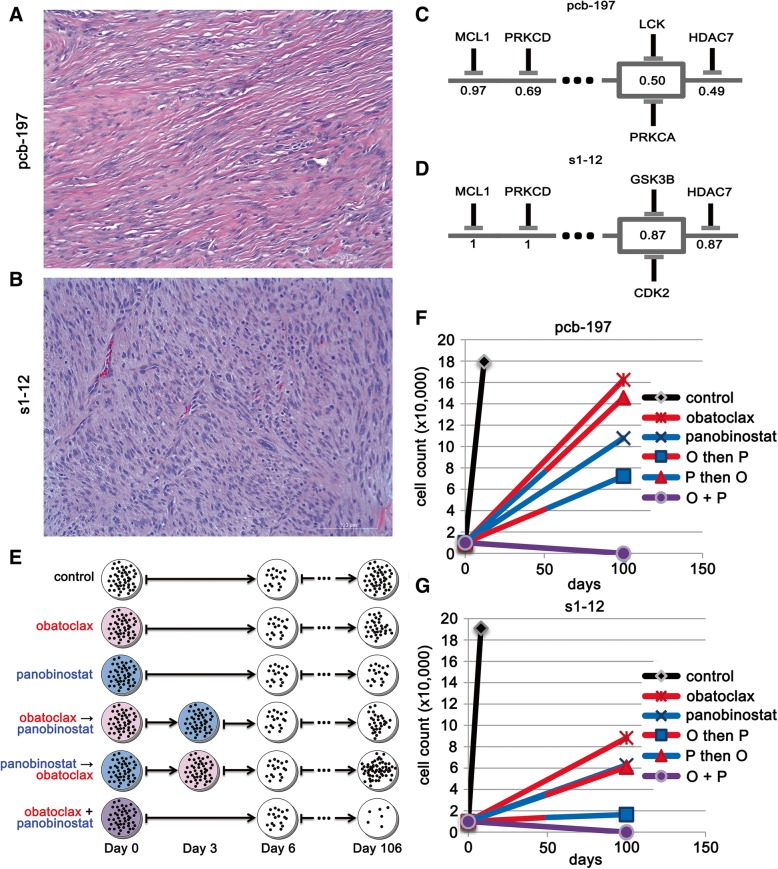
Methods: Tissue taken from a murine model of alveolar rhabdomyosarcoma was used to perform single agent drug screening and DNA/RNA sequencing experiments; results integrated via our computational modeling approach identified a synergistic personalized two-drug combination. Cells derived from the primary murine tumor were allografted into mouse models and used to validate the personalized two-drug combination. Computational modeling of single agent drug screening and RNA sequencing of multiple heterogenous sites from a single patient's epithelioid sarcoma identified a personalized two-drug combination effective across all tumor regions. The heterogeneity-consensus combination was validated in a xenograft model derived from the patient's primary tumor. Cell cultures derived from human and canine undifferentiated pleomorphic sarcoma were assayed by drug screen; computational modeling identified a resistance-abrogating two-drug combination common to both cell cultures. This combination was validated in vitro via a cell regrowth assay.
Results: Our computational modeling approach addresses three major challenges in personalized cancer therapy: synergistic drug combination predictions (validated in vitro and in vivo in a genetically engineered murine cancer model), identification of unifying therapeutic targets to overcome intra-tumor heterogeneity (validated in vivo in a human cancer xenograft), and mitigation of cancer cell resistance and rewiring mechanisms (validated in vitro in a human and canine cancer model).
Conclusions: These proof-of-concept studies support the use of an integrative functional approach to personalized combination therapy prediction for the population of high-risk cancer patients lacking viable clinical options and without actionable DNA sequencing-based therapy.
Keywords: Artificial intelligence and machine learning; Combination therapy; Computational modeling; Drug screening; High-throughput sequencing; Pediatric cancer; Personalized therapy; Sarcoma.
Conflict of interest statement
Investigators N.E.B., C.K. and R.P. have previously filed invention disclosures for the probabilistic Boolean model that integrates chemical screening and genomics data, and are in the process of forming a related company. The ‘s have declared these conflicts to their respective institutions, which are developing conflict of interest management plans.
All other authors declare no competing interests.
Figures
Similar articles
-
Stratification and prediction of drug synergy based on target functional similarity.NPJ Syst Biol Appl. 2020 Jun 2;6(1):16. doi: 10.1038/s41540-020-0136-x. NPJ Syst Biol Appl. 2020. PMID: 32487991 Free PMC article.
-
One mouse, one patient paradigm: New avatars of personalized cancer therapy.Cancer Lett. 2014 Mar 1;344(1):1-12. doi: 10.1016/j.canlet.2013.10.010. Epub 2013 Oct 22. Cancer Lett. 2014. PMID: 24157811 Free PMC article. Review.
-
Using a rhabdomyosarcoma patient-derived xenograft to examine precision medicine approaches and model acquired resistance.Pediatr Blood Cancer. 2014 Sep;61(9):1570-7. doi: 10.1002/pbc.25039. Epub 2014 Mar 31. Pediatr Blood Cancer. 2014. PMID: 24687871
-
Prospective molecular profiling of canine cancers provides a clinically relevant comparative model for evaluating personalized medicine (PMed) trials.PLoS One. 2014 Mar 17;9(3):e90028. doi: 10.1371/journal.pone.0090028. eCollection 2014. PLoS One. 2014. PMID: 24637659 Free PMC article.
-
Use of conditional reprogramming cell, patient derived xenograft and organoid for drug screening for individualized prostate cancer therapy: Current and future perspectives (Review).Int J Oncol. 2022 May;60(5):52. doi: 10.3892/ijo.2022.5342. Epub 2022 Mar 24. Int J Oncol. 2022. PMID: 35322860 Review.
Cited by
-
Functional genomic analysis of epithelioid sarcoma reveals distinct proximal and distal subtype biology.Clin Transl Med. 2022 Jul;12(7):e961. doi: 10.1002/ctm2.961. Clin Transl Med. 2022. PMID: 35839307 Free PMC article.
-
Potential of CDC25 phosphatases in cancer research and treatment: key to precision medicine.Front Pharmacol. 2024 Jan 19;15:1324001. doi: 10.3389/fphar.2024.1324001. eCollection 2024. Front Pharmacol. 2024. PMID: 38313315 Free PMC article. Review.
-
Predicting likelihood of in vivo chemotherapy response in canine lymphoma using ex vivo drug sensitivity and immunophenotyping data in a machine learning model.Vet Comp Oncol. 2021 Mar;19(1):160-171. doi: 10.1111/vco.12656. Epub 2020 Oct 20. Vet Comp Oncol. 2021. PMID: 33025640 Free PMC article.
-
Feasibility of functional precision medicine for guiding treatment of relapsed or refractory pediatric cancers.Nat Med. 2024 Apr;30(4):990-1000. doi: 10.1038/s41591-024-02848-4. Epub 2024 Apr 11. Nat Med. 2024. PMID: 38605166 Free PMC article.
-
Functional precision medicine: the future of cancer care.Trends Mol Med. 2025 May;31(5):404-408. doi: 10.1016/j.molmed.2024.10.015. Epub 2024 Nov 19. Trends Mol Med. 2025. PMID: 39567286
References
-
- American Cancer Society. Cancer Facts & Figures 2019. Atlanta: American Cancer Society; 2019. https://www.cancer.org/content/dam/cancer-org/research/cancer-facts-and-....
MeSH terms
Grants and funding
LinkOut - more resources
Full Text Sources
Molecular Biology Databases
