

Impact of planned dose reporting methods on Gamma pass rates for IROC lung and liver motion phantoms treated with pencil beam scanning protons
- PMID: 31208439
- PMCID: PMC6580526
- DOI: 10.1186/s13014-019-1316-y
Impact of planned dose reporting methods on Gamma pass rates for IROC lung and liver motion phantoms treated with pencil beam scanning protons
Abstract
Purpose: The purpose of this study is to evaluate the impact of two methods of reporting planned dose distributions on the Gamma analysis pass rates for comparison with measured 2D film dose and simulated delivered 3D dose for proton pencil beam scanning treatment of the Imaging and Radiation Oncology Core (IROC) proton lung and liver mobile phantoms.
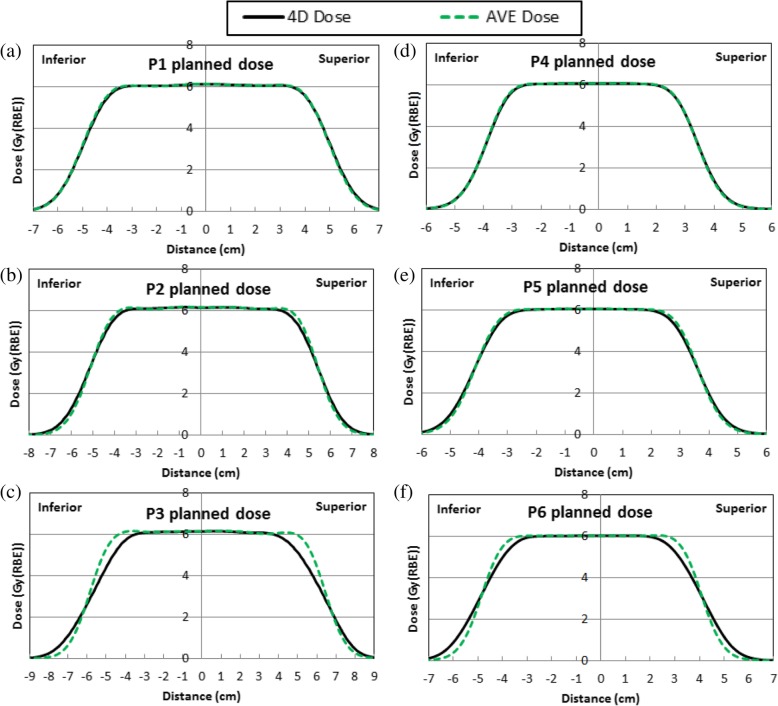
Methods and materials: Four-dimensional (4D) computed-tomography (CT) image sets were acquired for IROC proton lung and liver mobile phantoms, which include dosimetry inserts that contains targets, thermoluminescent dosimeters and EBT2 films for plan dose verification. 4DCT measured fixed motion magnitudes were 1.3 and 1.0 cm for the lung and liver phantoms, respectively. To study the effects of motion magnitude on the Gamma analysis pass rate, three motion magnitudes for each phantom were simulated by creating virtual 4DCT image sets with motion magnitudes scaled from the scanned phantom motion by 50, 100, and 200%. The internal target volumes were contoured on the maximum intensity projection CTs of the 4DCTs for the lung phantom and on the minimum intensity projection CTs of the 4DCTs for the liver phantom. Treatment plans were optimized on the average intensity projection (AVE) CTs of the 4DCTs using the RayStation treatment planning system. Plan doses were calculated on the AVE CTs, which was defined as the planned AVE dose (method one). Plan doses were also calculated on all 10 phase CTs of the 4DCTs and were registered using target alignment to and equal-weight-summed on the 50% phase (T50) CT, which was defined as the planned 4D dose (method two). The planned AVE doses and 4D doses for phantom treatment were reported to IROC, and the 2D-2D Gamma analysis pass rates for measured film dose relative to the planned AVE and 4D doses were compared. To evaluate motion interplay effects, simulated delivered doses were calculated for each plan by sorting spots into corresponding respiratory phases using spot delivery time recorded in the log files by the beam delivery system to calculate each phase dose and accumulate dose to the T50 CTs. Ten random beam starting phases were used for each beam to obtain the range of the simulated delivered dose distributions. 3D-3D Gamma analyses were performed to compare the planned 4D/AVE doses with simulated delivered doses.
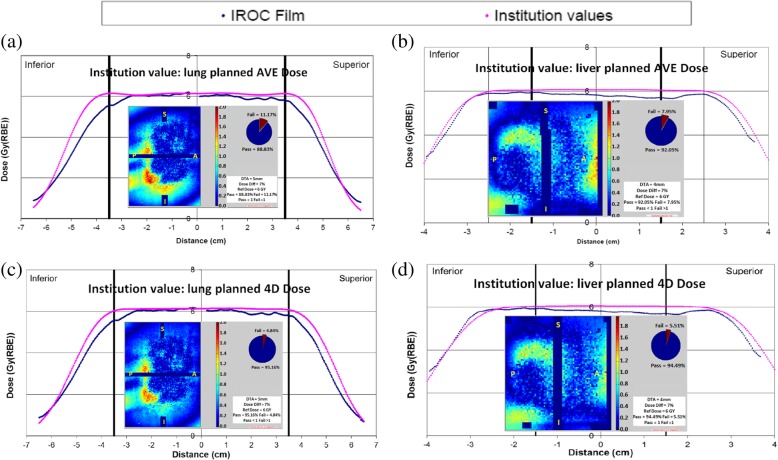
Results: The planned 4D dose matched better with the measured 2D film dose and simulated delivered 3D dose than the planned AVE dose. Using planned 4D dose as institution reported planned dose to IROC improved IROC film dose 2D-2D Gamma analysis pass rate from 92 to 96% on average for three films for the lung phantom (7% 5 mm), and from 92 to 94% in the sagittal plane for the liver phantom (7% 4 mm), respectively, compared with using the planned AVE dose. The 3D-3D Gamma analysis (3% 3 mm) pass rate showed that the simulated delivered doses for lung and liver phantoms using 10 random beam starting phases for each delivered beam matched the planned 4D dose significantly better than the planned AVE dose for phantom motions larger than 1 cm (p ≤ 0.04).
Conclusions: It is recommended to use the planned 4D dose as the institution reported planned dose to IROC to compare with the measured film dose for proton mobile phantoms to improve film Gamma analysis pass rate in the IROC credentialing process.
Keywords: Liver phantom; Lung phantom; Motion phantom; Pencil beam scanning proton; Proton therapy.
Conflict of interest statement
The authors declare that they have no competing interests.
Figures


Similar articles
-
Experimental validation of 4D log file-based proton dose reconstruction for interplay assessment considering amplitude-sorted 4DCTs.Med Phys. 2022 Jun;49(6):3538-3549. doi: 10.1002/mp.15625. Epub 2022 Apr 11. Med Phys. 2022. PMID: 35342943
-
Technical note: Towards more realistic 4DCT(MRI) numerical lung phantoms.Med Phys. 2024 Jan;51(1):579-590. doi: 10.1002/mp.16451. Epub 2023 May 11. Med Phys. 2024. PMID: 37166067
-
Synthetic 4DCT(MRI) lung phantom generation for 4D radiotherapy and image guidance investigations.Med Phys. 2022 May;49(5):2890-2903. doi: 10.1002/mp.15591. Epub 2022 Mar 17. Med Phys. 2022. PMID: 35239984 Free PMC article.
-
Proton Beam Therapy for Pancreatic Tumors: A Consensus Statement from the Particle Therapy Cooperative Group Gastrointestinal Subcommittee.Int J Radiat Oncol Biol Phys. 2025 May 1;122(1):19-30. doi: 10.1016/j.ijrobp.2024.12.020. Epub 2025 Jan 5. Int J Radiat Oncol Biol Phys. 2025. PMID: 39761799
-
Advances in 4D treatment planning for scanned particle beam therapy - report of dedicated workshops.Technol Cancer Res Treat. 2014 Dec;13(6):485-95. doi: 10.7785/tcrtexpress.2013.600274. Epub 2013 Dec 17. Technol Cancer Res Treat. 2014. PMID: 24354749 Free PMC article. Review.
Cited by
-
Dose-response of deformable radiochromic dosimeters for spot scanning proton therapy.Phys Imaging Radiat Oncol. 2020 Nov 20;16:134-137. doi: 10.1016/j.phro.2020.11.004. eCollection 2020 Oct. Phys Imaging Radiat Oncol. 2020. PMID: 33458356 Free PMC article.
-
A review of the clinical introduction of 4D particle therapy research concepts.Phys Imaging Radiat Oncol. 2024 Jan 10;29:100535. doi: 10.1016/j.phro.2024.100535. eCollection 2024 Jan. Phys Imaging Radiat Oncol. 2024. PMID: 38298885 Free PMC article. Review.
-
Motion-induced dose perturbations in photon radiotherapy and proton therapy measured by deformable liver-shaped 3D dosimeters in an anthropomorphic phantom.Phys Imaging Radiat Oncol. 2024 Jul 6;31:100609. doi: 10.1016/j.phro.2024.100609. eCollection 2024 Jul. Phys Imaging Radiat Oncol. 2024. PMID: 39132555 Free PMC article.
-
Analysis of Performance and Failure Modes of the IROC Proton Liver Phantom.Int J Part Ther. 2023 Jul 14;10(1):23-31. doi: 10.14338/IJPT-22-00043.1. eCollection 2023 Summer. Int J Part Ther. 2023. PMID: 37823015 Free PMC article.
References
-
- Taylor PA, Kry SF, Alvarez P, Keith T, Lujano C, Hernandez N, et al. Results from the imaging and radiation oncology Core Houston's anthropomorphic phantoms used for proton therapy clinical trial credentialing. Int J Radiat Oncol Biol Phys. 2016;95(1):242–248. doi: 10.1016/j.ijrobp.2016.01.061. - DOI - PMC - PubMed
MeSH terms
Substances
LinkOut - more resources
Full Text Sources
Research Materials
