. 2019 Jun 17;17(1):66.
doi: 10.1186/s12964-019-0381-z.

Novel interconnections of HOG signaling revealed by combined use of two proteomic software packages

Affiliations

Novel interconnections of HOG signaling revealed by combined use of two proteomic software packages

Marion Janschitz et al. Cell Commun Signal. .

Abstract

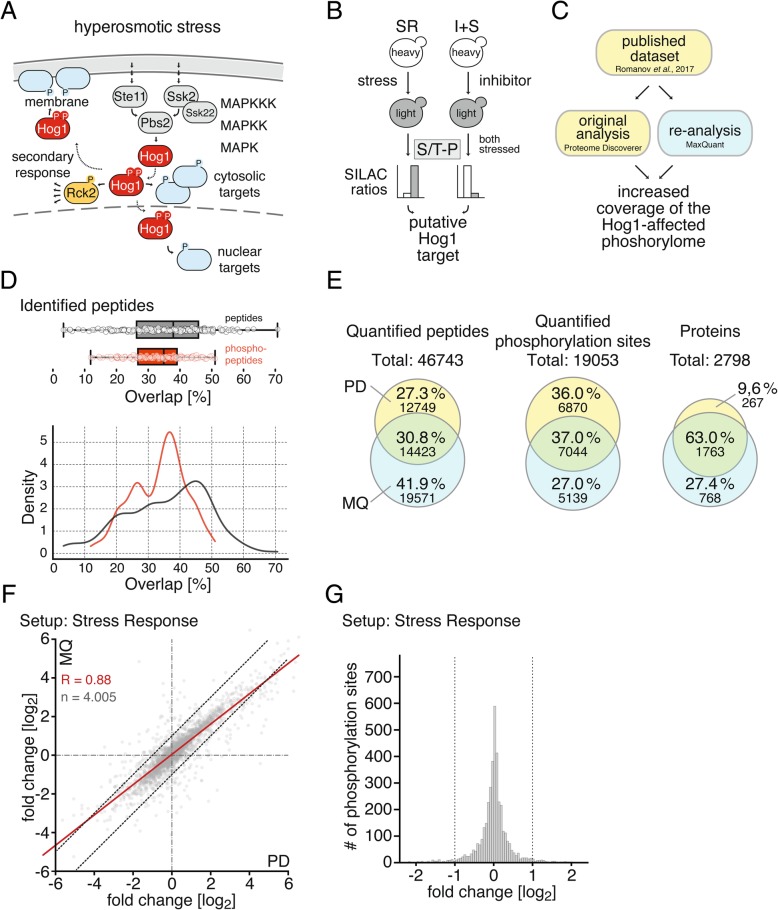
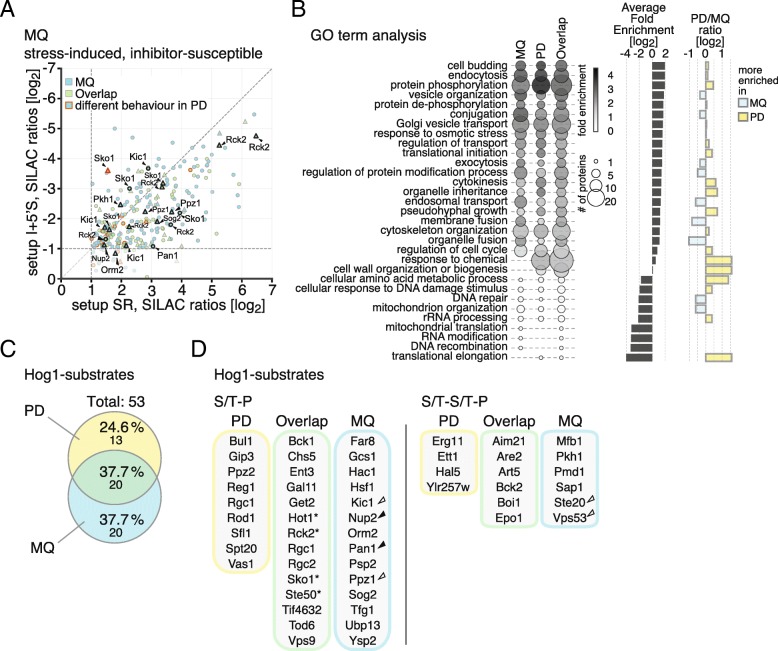
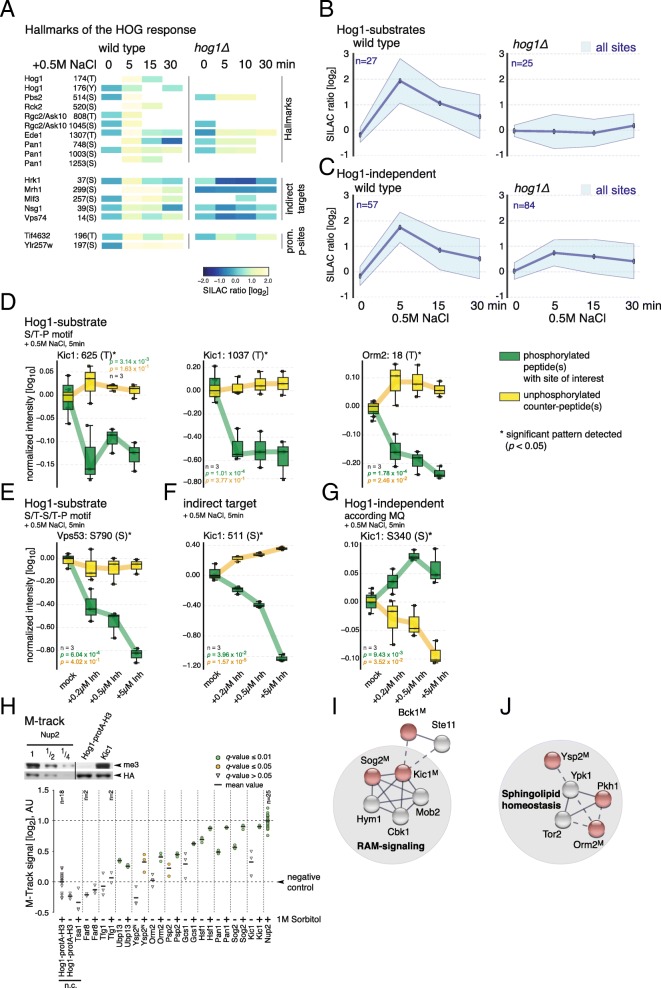
Modern quantitative mass spectrometry (MS)-based proteomics enables researchers to unravel signaling networks by monitoring proteome-wide cellular responses to different stimuli. MS-based analysis of signaling systems usually requires an integration of multiple quantitative MS experiments, which remains challenging, given that the overlap between these datasets is not necessarily comprehensive. In a previous study we analyzed the impact of the yeast mitogen-activated protein kinase (MAPK) Hog1 on the hyperosmotic stress-affected phosphorylome. Using a combination of a series of hyperosmotic stress and kinase inhibition experiments, we identified a broad range of direct and indirect substrates of the MAPK. Here we re-evaluate this extensive MS dataset and demonstrate that a combined analysis based on two software packages, MaxQuant and Proteome Discoverer, increases the coverage of Hog1-target proteins by 30%. Using protein-protein proximity assays we show that the majority of new targets gained by this analysis are indeed Hog1-interactors. Additionally, kinetic profiles indicate differential trends of Hog1-dependent versus Hog1-independent phosphorylation sites. Our findings highlight a previously unrecognized interconnection between Hog1 signaling and the RAM signaling network, as well as sphingolipid homeostasis.

Keywords: High-osmolarity glycerol (HOG); Hog1; Hyperosmotic stress response; Kic1; MaxQuant; Mitogen-activated protein kinase (MAPK); ORMDL; Orm2; Proteome discoverer; Proteomics; p38.


Conflict of interest statement

The authors declare that they have no competing interests.

Figures

Fig. 1
Fig. 1
a Cartoon illustrating the HOG pathway. Its central module consists of the MAPK Hog1, the MAPK kinase (MAPKK) Pbs2, and the three MAPKK kinases (MAPKKK) Ste11, Ssk2, and Ssk22. Upon activation by extracellular hyperosmolarity, Hog1 coordinates the osmostress response by phosphorylating its target proteins. Ultimately, the cascade leads to the activation of downstream kinases, such as Rck2. b Illustration of experimental conditions from Romanov et al., 2017 [4]. c Illustration of study concept. d Box- and density plot showing the degree of overlap in % of identified peptides (grey) and phosphorylated peptides (red) between PD and MQ outputs for each raw file (dot). Black line in box plot indicates median overlap (e) Venn diagrams showing percentage and total number of quantified peptides, quantified phosphorylation sites and proteins identified by MQ (light blue), PD (yellow) or both (green). f Correlation of SILAC log2-ratios of mutually quantified phosphorylation sites of setup SR. Lines indicate limits of +/− 1 quantification difference (g) Histogram displaying quantification difference calculated as MQ/PD SILAC-ratio [log2] of quantified phosphorylation sites of setup SR. Lines indicate cut-off (+/− 1 quantification difference)
Fig. 2
Fig. 2
a Scatter plot displaying SILAC ratios of setups SR (x-axis) and I + 5′S (y-axis). S/T-P motifs: triangles. Other motifs: circles. Ratios are log2-transformed. Similar analyses were made with setups I + 0′S and I + 10′S, respectively (not shown). b Results from gene ontology (GO) enrichment for three sets of Hog1-dependent phosphorylation sites derived from MQ, PD, and both search engines. GO-terms were filtered to have at least one q-value ≤0.1 in either set, allowing hierarchical levels ≥2 and solely “biological processes” as a GO category. The bubble size corresponds to the number of proteins associated with a given term; the color corresponds to the fold enrichment. The GO-terms were sorted according to the average fold-enrichment (side bar plot). On the right-hand side the PD/MQ-ratio between the respective enrichments are shown as a bar plot. In case the ratio is ≥1 (signified by red dashed line), the enrichment of the corresponding term is higher in PD vs. MQ (yellow coloring), and vice versa (blue coloring). c Venn diagram showing percentage and total number of stress- and Hog1-induced S/T-P motifs. Light blue: MQ, yellow: PD, green: overlap. d Putative Hog1-target proteins identified via genuine S/T-P (left) or S/T-S/T-P (right) motifs. Color-coding similar to (c). Filled arrowheads: known Hog1-target proteins in MQ-derived dataset. Open arrowheads: candidates that did not qualify as Hog1-substrates in [4] due to lack of overlap between experimental setups. *: alternative phosphorylation sites found with PD or MQ
Fig. 3
Fig. 3
a Heatmap showing SILAC ratios of selected phosphopeptides at 0, 5, 15 and 30 min after treatment with 0.5 M NaCl. Hallmarks: well-known phosphorylation events of osmostress signaling. Indirect targets: stress-inducible and inhibitor-susceptible phosphopeptides phosphorylated at non–S/T-P motif sequences [4]. Promiscuous p-sites: phosphorylation sites targeted by multiple kinases. b and c Average stress-induced phosphorylation kinetics of Hog1-dependent (above) and Hog1-independent (below) phosphorylation sites in a wild type and hog1Δ strain. d-g Illustration of PRM-measured phosphorylation patterns for Hog1-dependent and -independent sites upon hyperosmotic stress (+ 0.5 M NaCl) and inhibitor treatment (SPP86). N (biological replicates) = 3. For a given phosphorylation site, the green box plots represent the (mean) normalized intensities for the respective phosphopeptide(s). The yellow box plots illustrate the normalized intensities for unphosphorylated counter-peptides. Significance was assessed by comparing intensities derived from all pooled inhibitor-treated samples with those from the mock sample (t-test, p < 0.05). h Above: Representative Western blot showing M-track protein protein proximity signals obtained for Kic1. Hog1-protA-H3: background control, Nup2: positive control. Below: Proximity signals. n = 3 replicates per sample except when indicated differently. Ratios are log2-transformed. Black lines indicate average proximity signal. Proximity signals that differ significantly from background are marked in green (q ≤ 0.01) and orange (q ≤ 0.05 and > 0.01) filled circles. Grey filled triangles: q > 0.05. N: N-terminal HKMTmyc fusion. i and j Newly identified Hog1 network hubs based on STRING. Red filled circles: putative target proteins identified in this study. M: positive M-track signal. Gray circles: first neighbor according to STRING. Shaded circles enclosing groups of proteins highlight functional groups. Filled lines indicate high, dashed lines confidence score ≤ 0.4 according to STRING

Similar articles

Cited by

References

    1. Brezovich A, Schuschnig M, Ammerer G, Kraft C. An in vivo detection system for transient and low-abundant protein interactions and their kinetics in budding yeast. Yeast. 2015;32:355–365. doi: 10.1002/yea.3063. - DOI - PMC - PubMed
    1. Huh WK, Falvo JV, Gerke LC, Carroll AS, Howson RW, Weissman JS, O'Shea EK. Global analysis of protein localization in budding yeast. Nature. 2003;425:686–691. doi: 10.1038/nature02026. - DOI - PubMed
    1. Knop M, Siegers K, Pereira G, Zachariae W, Winsor B, Nasmyth K, Schiebel E. Epitope tagging of yeast genes using a PCR-based strategy: more tags and improved practical routines. Yeast. 1999;15:963–972. doi: 10.1002/(SICI)1097-0061(199907)15:10B<963::AID-YEA399>3.0.CO;2-W. - DOI - PubMed
    1. Romanov Natalie, Hollenstein David Maria, Janschitz Marion, Ammerer Gustav, Anrather Dorothea, Reiter Wolfgang. Identifying protein kinase–specific effectors of the osmostress response in yeast. Science Signaling. 2017;10(469):eaag2435. doi: 10.1126/scisignal.aag2435. - DOI - PMC - PubMed
    1. Reiter W, Anrather D, Dohnal I, Pichler P, Veis J, Grotli M, Posas F, Ammerer G. Validation of regulated protein phosphorylation events in yeast by quantitative mass spectrometry analysis of purified proteins. Proteomics. 2012;12:3030–3043. doi: 10.1002/pmic.201200185. - DOI - PMC - PubMed

Publication types

Substances