. 2019 Jul 9;12(7):dmm038356.
doi: 10.1242/dmm.038356.

Standardised imaging pipeline for phenotyping mouse laterality defects and associated heart malformations, at multiple scales and multiple stages

Affiliations

Standardised imaging pipeline for phenotyping mouse laterality defects and associated heart malformations, at multiple scales and multiple stages

Audrey Desgrange et al. Dis Model Mech. .

Abstract

Laterality defects are developmental disorders resulting from aberrant left/right patterning. In the most severe cases, such as in heterotaxy, they are associated with complex malformations of the heart. Advances in understanding the underlying physiopathological mechanisms have been hindered by the lack of a standardised and exhaustive procedure in mouse models for phenotyping left/right asymmetries of all visceral organs. Here, we have developed a multimodality imaging pipeline, which combines non-invasive micro-ultrasound imaging, micro-computed tomography (micro-CT) and high-resolution episcopic microscopy (HREM) to acquire 3D images at multiple stages of development and at multiple scales. On the basis of the position in the uterine horns, we track in a single individual, the progression of organ asymmetry, the situs of all visceral organs in the thoracic or abdominal environment, and the fine anatomical left/right asymmetries of cardiac segments. We provide reference anatomical images and organ reconstructions in the mouse, and discuss differences with humans. This standardised pipeline, which we validated in a mouse model of heterotaxy, offers a fast and easy-to-implement framework. The extensive 3D phenotyping of organ asymmetry in the mouse uses the clinical nomenclature for direct comparison with patient phenotypes. It is compatible with automated and quantitative image analyses, which is essential to compare mutant phenotypes with incomplete penetrance and to gain mechanistic insight into laterality defects.

Keywords: 3D imaging; Congenital heart defects; Heterotaxy; Laterality defects; Left-right asymmetry; Situs.


Conflict of interest statement

Competing interestsThe authors declare no competing or financial interests.

Figures

Fig. 1.
Fig. 1.
Multimodality imaging pipeline of left/right asymmetries in the mouse. (A) Micro-ultrasound imaging of a pregnant mouse to assess in vivo the shape of the embryonic heart loop at E9.5. The position of the embryo in the uterine horn is recorded as shown schematically, L1 and R1 being the first embryo next to the vagina in the left and right horns, respectively. (B) Micro-CT of the same individuals at E18.5, to image the situs of thoracic and abdominal organs. (C) HREM on the explanted E18.5 heart to image its left/right anatomical features. In each panel, the sample preparation is shown on the top left, the equipment on the top right and an example of an image is shown below: (A) a micro-ultrasound snapshot; (B) a 3D projection with segmented organ contours; and (C) a 3D projection.
Fig. 2.
Fig. 2.
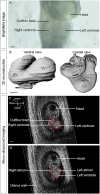
Micro-ultrasound imaging of the embryonic heart loop in utero. (A) Brightfield image of an explanted embryo at E9.5, showing the shape of the embryonic heart. (B) A 3D reconstruction on a ventral and cranial view, after segmentation of HREM images at E9.5, showing the helical shape of the embryonic heart. (C) Ventral and (D) dorsal sections of a 3D+t image of an E9.5 wild-type embryo acquired by micro-ultrasound imaging in utero. The contour of the embryonic heart is outlined in red. D, dorsal; LA, left atrium; LV, left ventricle; OFT, outflow tract; RA, right atrium; RV, right ventricle; V, ventral. Scale bars: 100 µm.
Fig. 3.
Fig. 3.
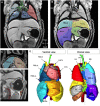
Imaging of the situs of thoracic and abdominal organs by micro-CT at E18.5. (A-D) Coronal sections from 3D images acquired by micro-CT of wild-type foetuses at E18.5, showing the thoracic and abdominal organs highlighted in different colours. (E) 3D reconstruction of the shape and position of organs within the body, from a ventral or dorsal view. The grey dotted line represents the plane of bilateral symmetry. Ao, aorta; Co, colon; Cran., cranial; Caud., caudal; GB, gall bladder; H, heart; ICV, inferior caval vein; L, left; LA, left atrium; LB, left bronchus; LLLiL, left lateral liver lobe; LLuL, left lung lobe; LMLiL, left medial liver lobe; LSCV, left superior caval vein; PA, pulmonary artery; PCLuL, post-caval (right) lung lobe; PP, papillary process; R, right; RA, right atrium; RB, right bronchus; RCLiL, right caudate liver lobe; RILuL, right inferior lung lobe; RLLiL, right lateral liver lobe; RMLiL, right medial liver lobe; RMLuL, right middle lung lobe; RSLuL, right superior lung lobe; RSCV, right superior caval vein; Sp, spleen; St, stomach.
Fig. 4.
Fig. 4.
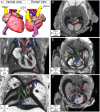
Imaging of the position of the heart and the great vessels by micro-CT. (A) Ventral and dorsal views of a 3D reconstruction of the heart (H) and great vessels, after image segmentation. Coronal (B,C) and transverse (D-F, in a cranio-caudal order) sections from micro-CT scans of E18.5 foetuses, showing the position of the heart and the great vessels. The red arrow points to the heart apex, which is on the left (levocardia) in a wild-type sample. The white dotted line represents the plane of bilateral symmetry, bisecting the neural tube. Structures specific to the circulation of deoxygenated and oxygenated blood are annotated in blue and red, respectively; bronchi are in green, other structures in white. aAo, ascending aorta; Aoa, aortic arch; CS, coronary sinus; dAo, descending aorta; ICV, inferior caval vein; LA, left atrium; LB, left bronchus; LV, left ventricle; LSCV, left superior caval vein; Oe, oesophagus; PA, pulmonary artery; PV, pulmonary veins; r., roof of the RA; RA, right atrium; RB, right bronchus; RSCV, right superior caval vein; RV, right ventricle; T, trachea; Th, thymus; v., vestibule of the RA.
Fig. 5.
Fig. 5.
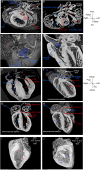
Imaging the fine cardiac anatomy by HREM. (A) A 3D projection and (B) transverse section of E18.5 hearts, imaged by HREM, at the level of the arterial valves. The images show the relative positions of the aorta and pulmonary artery, as well as the differential distribution of pectinate muscles in the left and right atrial chambers. The blue asterisk points to a pectinate muscle of the right atrial appendage, which attaches to the Eustachian valve at the end of the inferior caval vein. The red asterisk points to the smooth vestibular region of the left atrium. (C,D) 3D projections showing the coronary sinus, highlighted in blue, collecting the coronary veins and connected to the right atrium. Coronal sections (E,G) and 3D projections (F,H) showing the cardiac chambers, the great arteries and the valves. (I,J) 3D projections of the interventricular septum showing the smooth basal surface in the left ventricle (red asterisk, I) and trabeculated surface in the right ventricle (blue asterisk, J). The tricuspid valve has one septal leaflet (blue #, E). Structures specific to the circulation of deoxygenated and oxygenated blood are annotated in blue and red, respectively; other structures are in white. Apic., apical; Ant., anterior; Ao, aorta; Bas., basal; L, left; LA, left atrium; LAA, left atrial appendage; LV, left ventricle; MV, mitral valve; MVPM, mitral valve papillary muscles; PA, pulmonary artery; Post., posterior; PV, pulmonary veins; R, right; RA, right atrium; RAA, right atrial appendage; RV, right ventricle; TV, tricuspid valve.
Fig. 6.
Fig. 6.
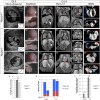
Application of the pipeline to phenotype heterotaxy: example of Rpgrip1l mutants. (A1,B1,C1) Representative sections of the 3D+t data set from micro-ultrasound imaging of Rpgrip1l+/+(A1) and Rpgrip1l−/− (B1,C1) embryos at E9.5. The insets outline the rightward loop of the embryonic heart tube in the control (A1), a reversed loop (B1) or no clear loop direction (C1) in the mutant samples. (A2,B2,C2) Brightfield images of the head of the same individuals at E18.5. The red arrows point to cleft upper lips and the black asterisks to undetectable eyes in mutant foetuses. (A3,B3,C3) Brightfield images of the hindlimb at E18.5, with numbered digits, showing polydactyly in the mutants. Coronal (A4,B4,C4,A5,B5,C5) and transverse (A6,B6,C6,A7,B7,C7) sections of micro-CT scans, showing the lung and stomach situs (A4,B4,C4), the position of the heart apex in the thoracic cavity (red arrow in A5,B5,C5), the position of the pulmonary venous return (red arrow in A6,B6,C6) and the position of the inferior caval vein (blue arrow in A7,B7,C7). Left and right anatomical features are annotated in blue and red, respectively. (A8,B8,C8,A9,B9,C9) HREM images of the heart at E18.5 isolated from the same individuals. In coronal sections of the four cardiac chambers (A8,B8,C8), the white asterisk shows complete atrioventricular septal defect in the mutants. In transverse sections (A9,B9,C9), the relative positions of the aorta and pulmonary artery appear normal in these mutants. The white dotted line represents the plane of bilateral symmetry, bisecting the neural tube or the atria. (D-F) Quantitative analyses of micro-CT scans, including the overall body size (D), the lung and liver lobation (E) and the normalised volume of the spleen and liver (F) in control (n=8) and mutant (n=5) foetuses. Data are presented as means±s.d. ***P<0.01 (Student's t-test). Ao, aorta; Caud., caudal; Cran., cranial; L, left; LA, left atrium; Li, liver; LLuL, left lung lobe; LV, left ventricle; ns, not significant; PA, pulmonary artery; PCLuL, post-caval lung lobe; Pe, pericardial effusion; R, right; RA, right atrium; RMLuL, right middle lung lobe; RSLuL, right superior lung lobe; RV, right ventricle; St, stomach.

Similar articles

Cited by

References

    1. Ai D., Liu W., Ma L., Dong F., Lu M.-F., Wang D., Verzi M. P., Cai C., Gage P. J., Evans S. et al. (2006). Pitx2 regulates cardiac left–right asymmetry by patterning second cardiac lineage-derived myocardium. Dev. Biol. 296, 437-449. 10.1016/j.ydbio.2006.06.009 - DOI - PMC - PubMed
    1. Bajolle F., Zaffran S., Kelly R. G., Hadchouel J., Bonnet D., Brown N. A. and Buckingham M. E. (2006). Rotation of the myocardial wall of the outflow tract is implicated in the normal positioning of the great arteries. Circ. Res. 98, 421-428. 10.1161/01.RES.0000202800.85341.6e - DOI - PubMed
    1. Ciszek B., Skubiszewska D. and Ratajska A. (2007). The anatomy of the cardiac veins in mice. J. Anat. 211, 53-63. 10.1111/j.1469-7580.2007.00753.x - DOI - PMC - PubMed
    1. Collignon J., Varlet I. and Robertson E. J. (1996). Relationship between asymmetric nodal expression and the direction of embryonic turning. Nature 381, 155-158. 10.1038/381155a0 - DOI - PubMed
    1. Couinaud C. (1957). Le foie; études anatomiques et chirurgicales. Paris: Masson.

Publication types