. 2019 Jul 16;8(7):bio042283.
doi: 10.1242/bio.042283.

Chemotropic signaling by BMP7 requires selective interaction at a key residue in ActRIIA

Affiliations

Chemotropic signaling by BMP7 requires selective interaction at a key residue in ActRIIA

Jeanette C Perron et al. Biol Open. .

Abstract

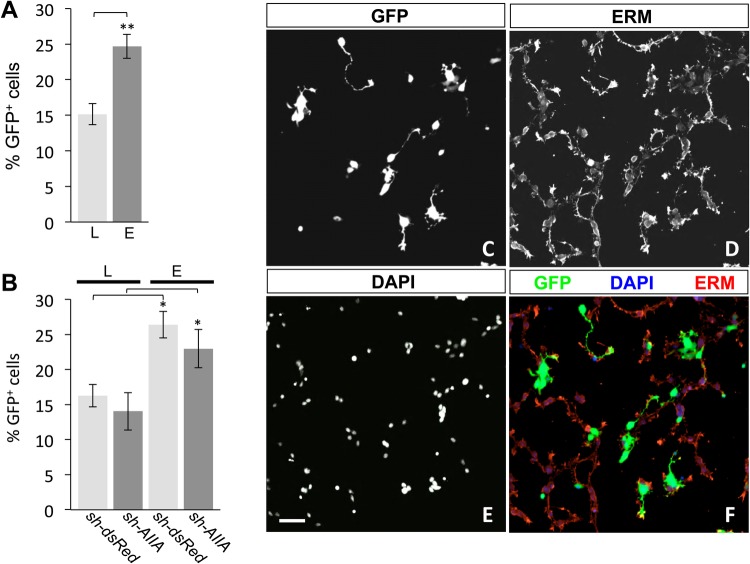
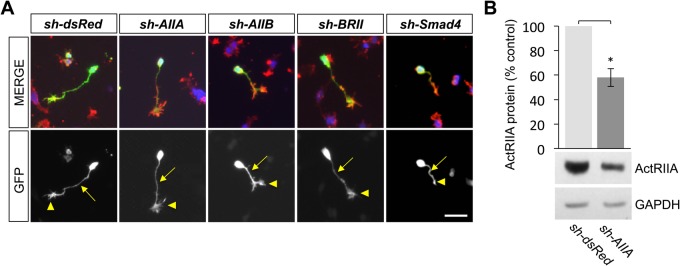
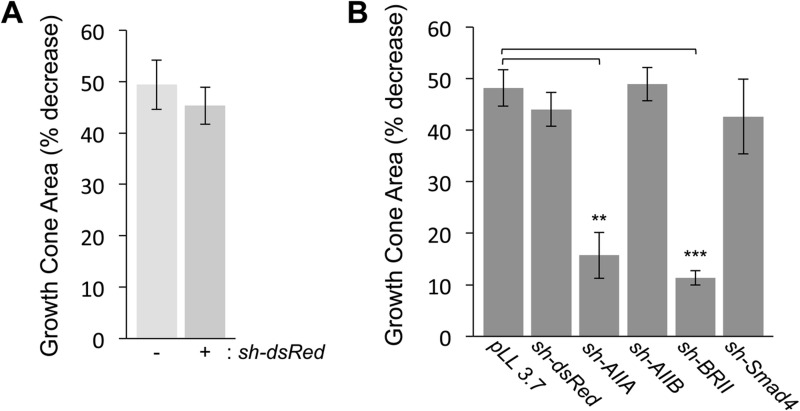
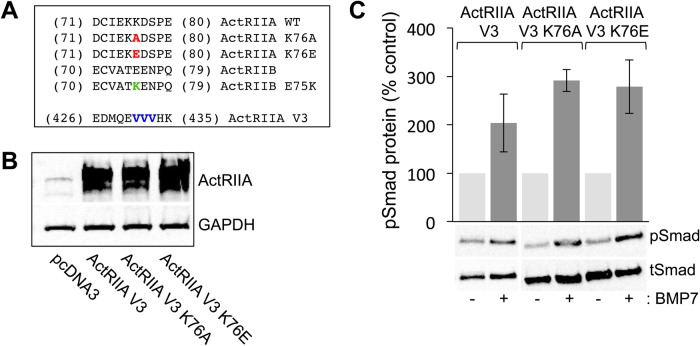
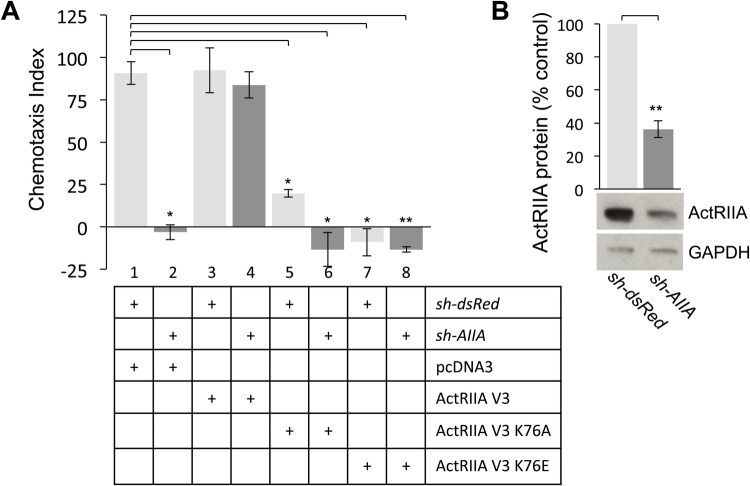
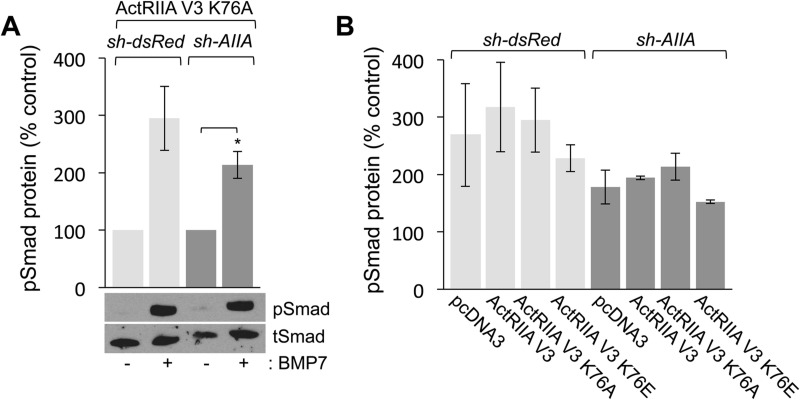
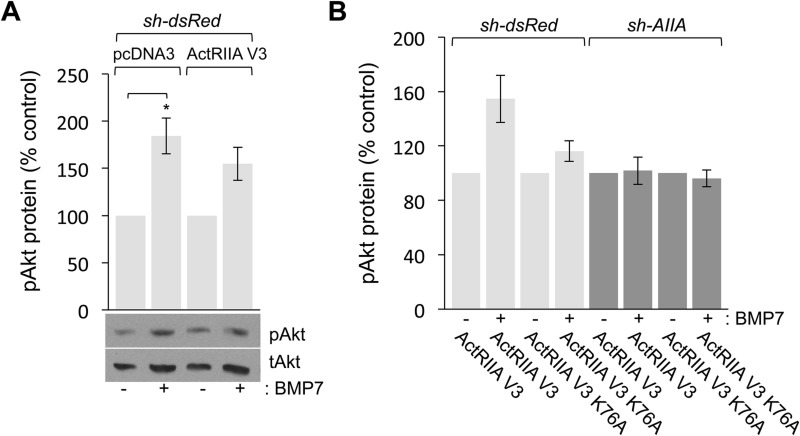
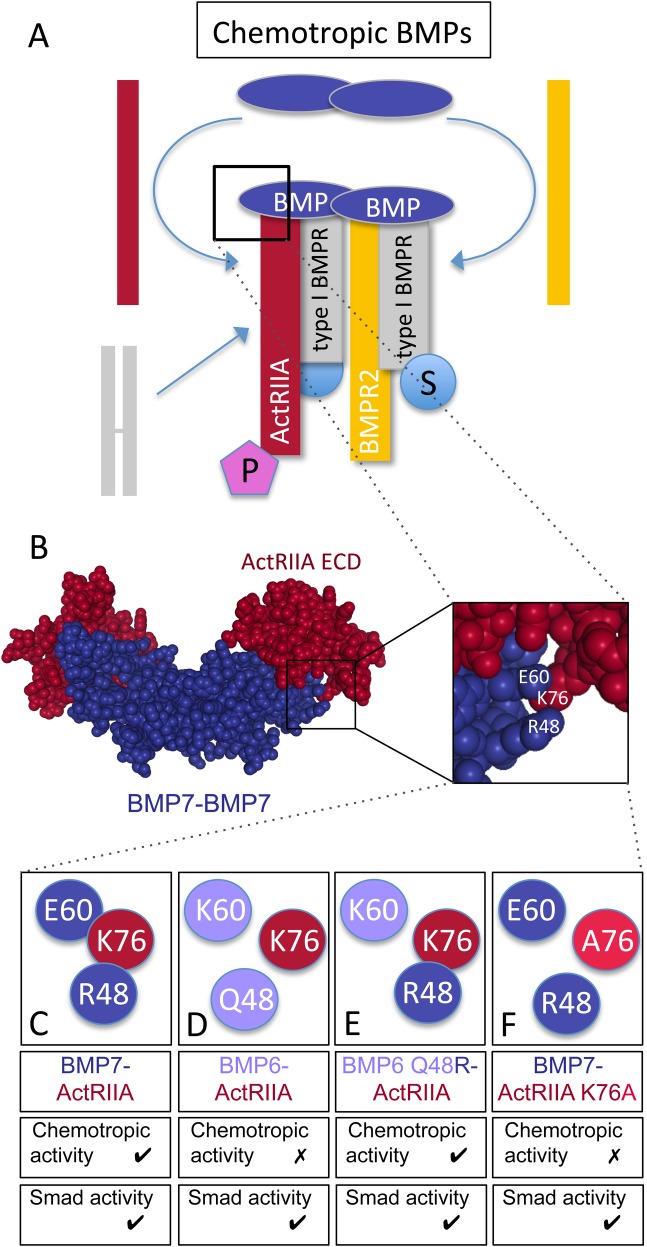
BMP7 evokes acute chemotropic PI3K-dependent responses, such as growth cone collapse and monocyte chemotaxis, as well as classical Smad-dependent gene transcription. That these divergent responses can be activated in the same cell raises the question of how the BMP-dependent signaling apparatus is manipulated to produce chemotropic and transcriptional signals. RNA interference and site-directed mutagenesis were used to explore functional and structural BMP receptor requirements for BMP7-evoked chemotropic activity. We show that specific type II BMP receptor subunits, ActRIIA and BMPR2, are required for BMP7-induced growth cone collapse in developing spinal neurons and for chemotaxis of monocytes. Reintroduction of wild-type ActRIIA into monocytic cells lacking endogenous ActRIIA restores BMP7-evoked chemotaxis, whereas expression of an ActRIIA K76A receptor variant fails to rescue. BMP7-evoked Smad-dependent signaling is unaffected by either ActRIIA knockdown or expression of the ActRIIA K76A variant. In contrast, BMP7-evoked PI3K-dependent signaling is significantly disturbed in the presence of ActRIIA K76A. These results support a model for selective engagement of chemotropic BMPs with type II BMP receptors, through specific residues, that results in strict regulation of PI3K-dependent signal transduction.This article has an associated First Person interview with the first author of the paper.

Keywords: ActRIIA; BMP7; Chemotaxis; Growth cone collapse; PI3K.


Conflict of interest statement

Competing interestsThe authors declare no competing or financial interests.

Figures

Fig. 1.
Fig. 1.
Transfection of shRNA vectors in DSC neurons by lipofection and electroporation. (A) Combined transfection efficiency assessed by the percentage of GFP+ neurons (mean±s.e.m.) in dsRedΔDSC and AIIAΔDSC cultures by lipofection (L, 15.2%±1.5%) or electroporation (E, 24.7%±1.7%). Electroporation significantly improved transfection efficiency compared with lipofection (**P<0.002, n=3) (Student's two-tailed t-test). (B) Transfection efficiencies (% GFP+ neurons; mean±s.e.m.; n=3 for each condition) for dsRedΔDSC and AIIAΔDSC cultures show no vector-specific differences in neurons transfected by either lipofection (dsRedΔDSC, 16.3%±1.6%; AIIAΔDSC, 14.0%±2.7%) or electroporation (dsRedΔDSC, 26.4%±1.9%; AIIAΔDSC, 23.0%±2.7%). In contrast, transfection efficiencies revealed that in dsRedΔDSC and AIIAΔDSC cultures, the percentage of GFP+ neurons increased by 62% and 63%, respectively, in electroporated cultures compared with transfection by lipofection (*P<0.05, n=3 for both conditions) (Student's two-tailed t-test). (C–F) Dissociated dsRedΔDSC culture labeled for (C) GFP, (D) ERM and (E) DAPI. Merged image (F) shows GFP expression in electroporated neurons (green), ERM labeling localized to the cellular membranes (red) and DAPI staining the nuclei (blue). Scale bar: 50 μm.
Fig. 2.
Fig. 2.
Growth cone expression of type II BMP receptor-targeted shRNA vectors in DSC neurons. (A) Representative images of DSC neurons electroporated with the indicated shRNA vectors in dissociated culture labeled for GFP (green), ERM (red) and DAPI (blue). The presence of GFP reflects expression of each of the shRNA vectors in cultured DSC neurons including in the axonal processes (arrows) and growth cones (arrowheads). In the far right column, a Smad4ΔDSC neuron is shown, treated with 50 ng/ml BMP7 for 30 min, and represents a collapsed growth cone (arrowhead). Scale bar: 50 μm. (B) Western blots of dsRedΔDSC or AIIAΔDSC lysates probed with an anti-ActRIIA antibody. Detection of GAPDH provided a loading control. Electroporation of sh-AIIA in DSC cultures decreases ActRIIA protein expression to 58%±7.4% of the expression levels in GFP-enriched, dsRedΔDSC lysates (mean±s.e.m.; n=4; *P<0.05) (Student's two-tailed t-test).
Fig. 3.
Fig. 3.
BMP7-evoked growth cone collapse in DSC neurons in the presence of control and type II BMP receptor shRNA vectors. (A) The percentage of growth cone area decrease [GCAD=(100–{[(GC area in the presence of BMP7–control GC area)/control GC area]×100}); mean±s.e.m.] in dsRedΔDSC neurons stimulated by 50 ng/ml BMP7 for 30 min is not affected by expression of the non-specific shRNA vector, sh-dsRed (GCAD=48.3%±3.3%) when compared with untransfected, GFP neurons (GCAD=49.4%±4.8%) in the same culture (n=3). (B) Growth cone area decrease (mean±s.e.m.) in response to 50 ng/ml BMP7 was measured for shRNA-transfected GFP+ neurons only. Expression of pLL3.7, the shRNA parent vector, (GCAD=48.2%±3.5%; n=3) or knockdown of ActRIIB (AIIBΔDSC, GCAD=54.4%±3.3%; n=3) or Smad4 (Smad4ΔDSC, GCAD=42.6%±7.2%; n=3) did not interfere with BMP7-evoked growth cone collapse. In contrast, BMP7-evoked growth cone collapse was significantly inhibited in AIIAΔDSC (GCAD=15.7%±4.4%; n=4, **P<0.005) and BRIIΔDSC cultures (GCAD=11.3%±1.4%; n=3, ***P<0.001) (Student's two-tailed t-test).
Fig. 4.
Fig. 4.
Site-directed mutagenesis of K76 in ActRIIA does not impede variant receptor expression or BMP7-stimulated Smad1/5/8 phosphorylation. (A) Amino acid sequences of mouse ActRIIA in the region of the K76 (red) and V3 (blue) mutations and mouse ActRIIB in the region of the E75 (green) mutation. Numbering corresponds to the amino acid number: for the K76 and E75 mutations according to PDB ID: 1LX5 and for the V3 mutations according to NCBI accession no.: NP_031422.3 (Fig. S3). The mutations at position 76 in ActRIIA replace lysine (K) with either alanine (A) or glutamic acid (E). The mutation at position 75 in ActRIIB replaces glutamic acid with lysine. The mutations at positions 431 to 433 do not replace the three valine (V) residues in the amino acid sequence but rather alter the nucleotide sequence to create an ActRIIA cDNA that is resistant to sh-AIIA while maintaining the amino acid sequence. (B) Western blots of whole-cell C2C12 lysates, transfected with pcDNA3, ActRIIA V3, ActRIIA V3 K76A or ActRIIA V3 K76E, were probed with an anti-ActRIIA antibody. Detection of GAPDH provided a loading control. (C) Quantification of western blots of transfected whole-cell C2C12 lysates incubated with or without 50 ng/ml BMP7 probed with a phospho-specific Smad1/5/8 antibody. Detection of total Smad1 provided a loading control. Densitometric analysis (mean±s.e.m.; n=2) shows an increase in response to BMP7 in cells expressing ActRIIA V3 (104% over control), ActRIIA V3 K76A (191% over control) and ActRIIA V3 K76E (179% over control).
Fig. 5.
Fig. 5.
ActRIIA V3 K76 receptor variants cannot rescue sh-AIIA-mediated inhibition of BMP7-stimulated chemotaxis. (A) Chemotaxis in response to 50 ng/mL BMP7 (CI={[(no. BMP7 treated cells in filter pores)–(no. control cells in filter pores)]/(no. control cells in filter pores)}×100; mean±s.e.m.). Chemotaxis indices for dsRedΔWEHI cells co-expressing pcDNA3 (lane 1, CI=90.9±6.8), ActRIIA V3 (lane 3, CI=92.3±13.2), ActRIIA V3 K76A (lane 5, CI=19.8±2.15) and ActRIIA V3 K76E (lane 7, CI=−4.5±9.5) (n=2). Chemotaxis indices for AIIAΔWEHI cells co-expressing pcDNA3 (lane 2, CI=−3.1±4.4), ActRIIA V3 (lane 4, CI=83.8±7.7), ActRIIA V3 K76A (lane 6, CI=−13.3±10) and ActRIIA V3 K75E (lane 8, CI=−13.4±1.6). BMP7-evoked chemotaxis in dsRedΔWEHI cells co-expressing pcDNA3 differs significantly from chemotaxis in dsRedΔWEHI cells co-expressing ActRIIA V3 K76A and ActRIIA V3 K76E and in AIIAΔWEHI cells co-expressing pcDNA3 and ActRIIA V3 K76A (*P<0.02, n=2) (Student's two-tailed t-test). The difference in BMP7-evoked chemotaxis between dsRedΔWEHI cells co-expressing pcDNA3 and AIIAΔWEHI cells co-expressing ActRIIA V3 K76E is also significant (**P<0.005, n=2) (Student's two-tailed t-test). (B) Western blots of dsRedΔWEHI or AIIAΔWEHI cell lysates co-expressing pcDNA3 were probed for ActRIIA expression. Detection of GAPDH provided a loading control. Electroporation of sh-AIIA in WEHI 274.1 cells decreases ActRIIA protein expression to 36%±5.1% of the expression levels in dsRedΔWEHI lysates (mean±s.e.m.; n=4; **P<0.005, Student's two-tailed t-test).
Fig. 6.
Fig. 6.
Expression of ActRIIA V3 K76 variant receptors does not inhibit BMP7-evoked Smad1/5/8 phosphorylation. (A) Western blots of dsRedΔWEHI or AIIAΔWEHI lysates co-expressing ActRIIA V3 K76A incubated with or without 50 ng/ml BMP7 for 30 min and probed for pSmad1/5/8. Detection of tSmad provided a loading control. BMP7 stimulated robust increases (mean±s.e.m.) in the levels of pSmad1/5/8 in dsRedΔWEHI (195% over control, n=2) or AIIAΔWEHI (113% over control, n=2; *P<0.05, Student's two-tailed t-test) cells co-expressing ActRIIA V3 K76A. (B) Quantification of western blots (mean±s.e.m.) of dsRedΔWEHI or AIIAΔWEHI lysates co-expressing pcDNA3, ActRIIA V3, ActRIIA V3 K76A and ActRIIA V3 K76E incubated in the presence of 50 ng/ml BMP7 for 30 min and probed for pSmad1/5/8. Detection of tSmad provided a loading control. Levels of pSmad1/5/8 were normalized to pSmad1/5/8 levels in unstimulated cells. All conditions demonstrated increases in response to BMP7 stimulation compared with control cells. The data for the unstimulated controls are not shown. There was no significant difference in the level of pSmad1/5/8 in dsRedΔWEHI lysates compared with pSmad1/5/8 levels in AIIAΔWEHI cells for any of the transfection conditions.
Fig. 7.
Fig. 7.
BMP7-evoked Akt phosphorylation is inhibited by loss of ActRIIA expression or expression of ActRIIA V3 K76A. (A,B) Quantification (mean±s.e.m.; n=2) of western blots of dsRedΔWEHI and AIIAΔWEHI lysates co-expressing the indicated cDNA expression constructs incubated with or without 50 ng/ml BMP7 for 30 min and probed for pAkt. Detection of tAkt provided a loading control. pAkt levels for each transfection condition were normalized to pAkt levels in the respective unstimulated cells. (A) BMP7 stimulated increases in the levels of pAkt in dsRedΔWEHI cells co-expressing pcDNA3 (84%±19% over control; *P<0.05, Student's two-tailed t-test) or ActRIIA V3 (55%±17% over control). (B) BMP7 stimulated increases in the levels of pAkt only in dsRedΔWEHI co-expressing ActRIIA V3 (55%±17% over control, lane 2). Increases in pAkt over control levels were not observed in any other condition in response to BMP7 including in dsRedΔWEHI co-expressing ActRIIA V3 K76A (16%±7.5% over control, lane 4), AIIAΔWEHI co-expressing ActRIIA V3 (1.8%±4.7% over control, lane 6) or AIIAΔWEHI co-expressing ActRIIA V3 K76A (−3.8%±6.2% over control, lane 8).
Fig. 8.
Fig. 8.
Signaling and receptor binding interactions of chemotropic BMPs. (A) Model of chemotropic BMP signaling indicating the potential asymmetric recruitment of ActRIIA (red) and BMPR2 (yellow) into the tetrameric receptor complex. A type I BMP receptor pair is represented as a preformed complex (PFC, gray subunits), though it is unclear whether BMP7 selectively engages PFCs containing ActRIIA and BMPR2 or recruits individual receptors into a complex with type I BMP receptor subunits. BMP7 stimulates Smad- (S) and PI3K-dependent (P) downstream signaling linked to type I and type II BMP receptors, respectively. (B) Spacefill representation of the crystal structure of a BMP7 dimer (blue) bound to the ActRIIA ECD (red) generated from Protein Data Bank ID, 1LX5 (Greenwald et al., 2003) using NGL Viewer (Rose et al., 2018). Enlarged area indicates amino acid positions for BMP7 R48 and E60 as well as ActRIIA K76. (C–F) Representations of wild-type and mutated amino acids in BMP-ActRIIA interactions and the associated chemotropic and Smad activity. (C) BMP7 R48 is predicted to associate with ActRIIA K76 and BMP7-evoked chemotropic activity requires interaction with ActRIIA. (D) BMP6 Q48 is not predicted to associate with ActRIIA K76 and BMP6 does not stimulate chemotropic activity. (E) BMP6 Q48R demonstrates potent chemotropic activity and would potentially interact with ActRIIA K76. (F) Mutation of K76 in ActRIIA to alanine (A76) is predicted to disrupt the interaction with BMP7 R48. The presence of ActRIIA K76A blocks BMP7-evoked chemotropic activity. Mutations at this site do not have any effect on BMP-stimulated Smad phosphorylation.

Similar articles

Cited by

References

    1. Allendorph G. P., Isaacs M. J., Kawakami Y., Izpisua Belmonte J. C. and Choe S. (2007). BMP-3 and BMP-6 structures illuminate the nature of binding specificity with receptors. Biochemistry 46, 12238-12247. 10.1021/bi700907k - DOI - PubMed
    1. Augsburger A., Schuchardt A., Hoskins S., Dodd J. and Butler S. (1999). BMPs as mediators of roof plate repulsion of commissural neurons. Neuron 24, 127-141. 10.1016/S0896-6273(00)80827-2 - DOI - PubMed
    1. Brazil D. P., Church R. H., Surae S., Godson C. and Martin F. (2015). BMP signalling: agony and antagony in the family. Trends Cell Biol. 25, 249-264. 10.1016/j.tcb.2014.12.004 - DOI - PubMed
    1. Butler S. J. and Dodd J. (2003). A role for BMP heterodimers in roof plate-mediated repulsion of commissural axons. Neuron 38, 389-401. 10.1016/S0896-6273(03)00254-X - DOI - PubMed
    1. Derynck R. and Zhang Y. E. (2003). Smad-dependent and Smad-independent pathways in TGF-beta family signalling. Nature 425, 577-584. 10.1038/nature02006 - DOI - PubMed