. 2019 Jul 2;116(27):13434-13439.
doi: 10.1073/pnas.1902484116. Epub 2019 Jun 17.

Drainage network position and historical connectivity explain global patterns in freshwater fishes' range size

Affiliations

Drainage network position and historical connectivity explain global patterns in freshwater fishes' range size

Juan Carvajal-Quintero et al. Proc Natl Acad Sci U S A. .

Abstract

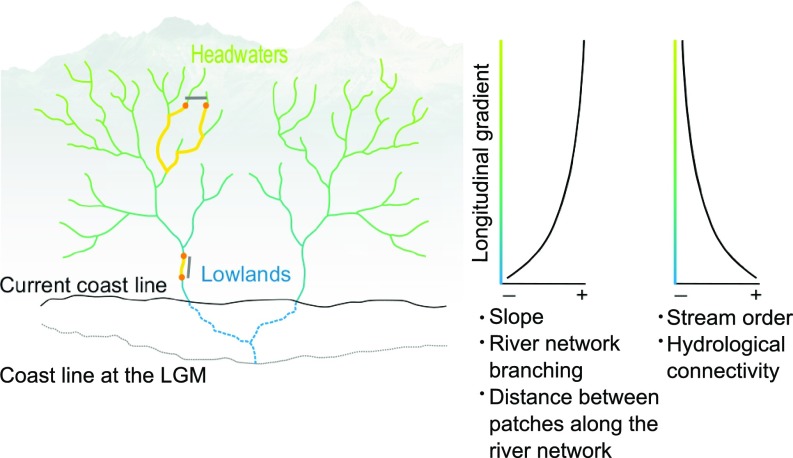
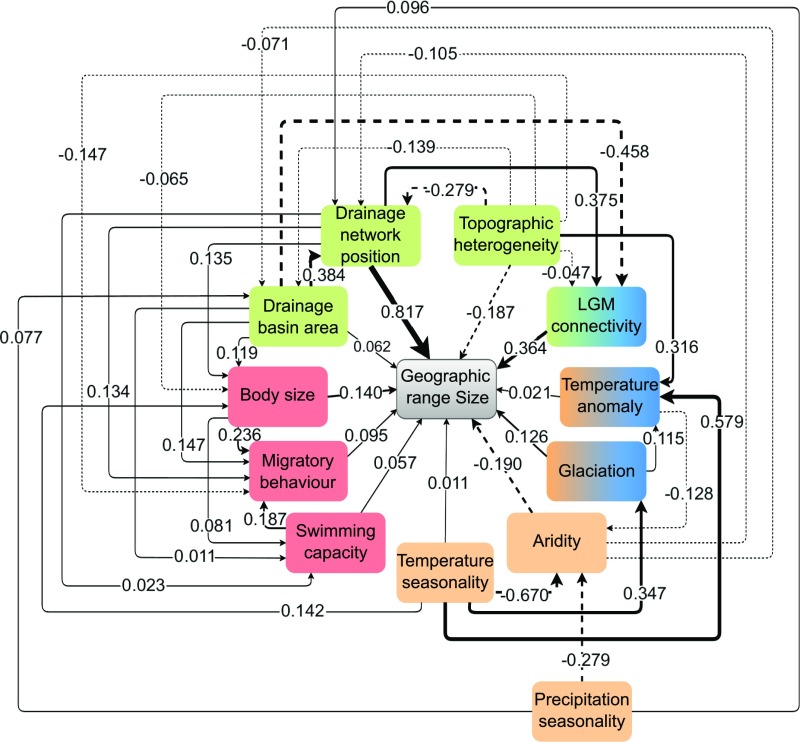
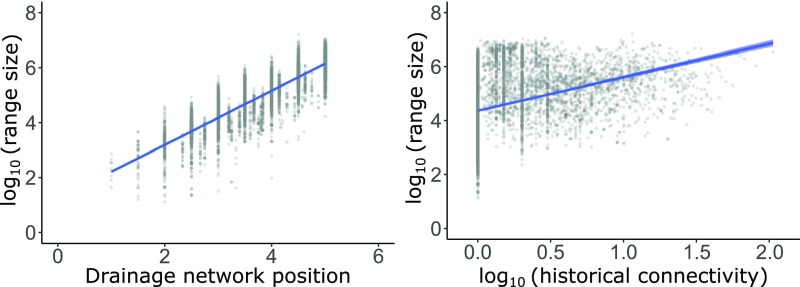
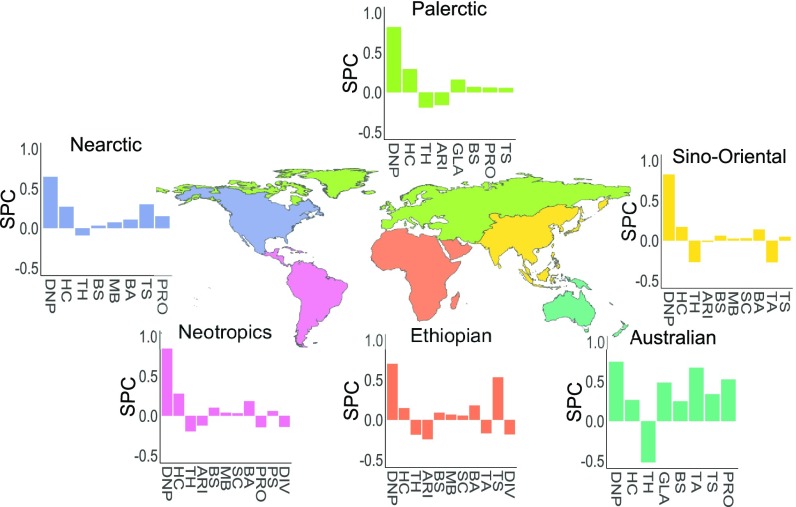
Identifying the drivers and processes that determine globally the geographic range size of species is crucial to understanding the geographic distribution of biodiversity and further predicting the response of species to current global changes. However, these drivers and processes are still poorly understood, and no ecological explanation has emerged yet as preponderant in explaining the extent of species' geographical range. Here, we identify the main drivers of the geographic range size variation in freshwater fishes at global and biogeographic scales and determine how these drivers affect range size both directly and indirectly. We tested the main hypotheses already proposed to explain range size variation, using geographic ranges of 8,147 strictly freshwater fish species (i.e., 63% of all known species). We found that, contrary to terrestrial organisms, for which climate and topography seem preponderant in determining species' range size, the geographic range sizes of freshwater fishes are mostly explained by the species' position within the river network, and by the historical connection among river basins during Quaternary low-sea-level periods. Large-ranged fish species inhabit preferentially lowland areas of river basins, where hydrological connectivity is the highest, and also are found in river basins that were historically connected. The disproportionately high explanatory power of these two drivers suggests that connectivity is the key component of riverine fish geographic range sizes, independent of any other potential driver, and indicates that the accelerated rates in river fragmentation might strongly affect fish species distribution and freshwater biodiversity.

Keywords: connectivity; freshwater fishes; global scale; river networks; species distribution.


Conflict of interest statement

The authors declare no conflict of interest.

Figures

Fig. 1.
Fig. 1.
Different features of hydrological connectivity across the longitudinal gradient of schematized river networks. Gradient solid lines represent two river drainages currently disconnected, but that formed a single paleo-basin during a lower-sea-level period at the LGM (dashed blue lines). Solid black line shows the current seashore line and the dashed gray line the seashore during the LGM. In a downstream position of the river network, the branching degree is lower and the Euclidian distance between two localities (gray lines) is similar to the distance measured along the river network (yellow lines). As we move to more derivate positions toward headwaters, the dendritic branching increases and the Euclidian distance between two localities can be much shorter than the actual distance through the network (15). This increase in river branching toward headwaters is also accompanied by an increase in river slope that configures changes in habitats along a river drainage basin (16). This results in a longitudinal gradient of hydrological connectivity that determines the travel distances and dispersal costs for aquatic organisms. On the right side are graphically represented the hydrological connectivity features along the longitudinal gradient.
Fig. 2.
Fig. 2.
Final path model describing direct and indirect drivers of the geographic range size of freshwater fish species at the global scale. Solid lines indicate positive relationships, and dashed lines indicate negative relationships. Arrows indicate the direction of the relationship. Bold lines indicate the strongest relationships, with line widths proportional to importance. Colors in the boxes show the group of hypotheses to which each predictor belongs: orange boxes represent climatic and energy drivers, blue boxes represent historical drivers, green boxes represent geomorphological drivers, and red boxes represent species traits. Boxes with two colors are drivers belonging to two different groups of hypotheses.
Fig. 3.
Fig. 3.
Relationships between species range size and the main predictors at the global scale: drainage network position and historical connectivity.
Fig. 4.
Fig. 4.
SPC for each direct driver of geographic range size across the biogeographic realms proposed by Leroy et al. (42). Abbreviations for drivers are: drainage network position (DNP), historical connectivity (HC), topographic heterogeneity (TH), aridity (ARI), drainage basin area (BA), temperature anomaly (TA), glaciation history (GLA), temperature seasonality (TS), precipitation seasonality (PS), productivity (PRO), diversification (DIV), body size (BS), migratory behavior (MB), and swimming capacity (SC).

Similar articles

Cited by

References

    1. Brown J. H., Stevens G. C., Kaufman D. M., The geographic range: Size, shape, boundaries, and internal structure. Annu. Rev. Ecol. Syst. 27, 597–623 (1996).
    1. Gaston K. J., The Structure and Dynamics of Geographic Ranges (Oxford University Press, 2003).
    1. Gotelli N. J., et al. , Patterns and causes of species richness: A general simulation model for macroecology. Ecol. Lett. 12, 873–886 (2009). - PubMed
    1. Jenkins C. N., Pimm S. L., Joppa L. N., Global patterns of terrestrial vertebrate diversity and conservation. Proc. Natl. Acad. Sci. U.S.A. 110, E2602–E2610 (2013). - PMC - PubMed
    1. IUCN , The IUCN Red List of threatened species. (2018). https://www.iucnredlist.org/en. Accessed 29 January 2019.

Publication types

LinkOut - more resources