. 2019 Jul 2;116(27):13174-13181.
doi: 10.1073/pnas.1821298116. Epub 2019 Jun 17.

Reactive school closure weakens the network of social interactions and reduces the spread of influenza

Affiliations

Reactive school closure weakens the network of social interactions and reduces the spread of influenza

Maria Litvinova et al. Proc Natl Acad Sci U S A. .

Abstract

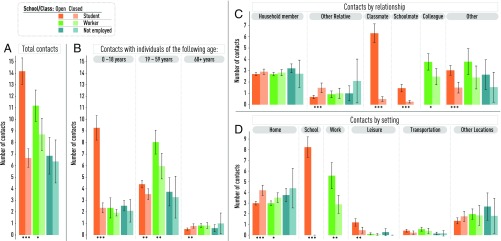
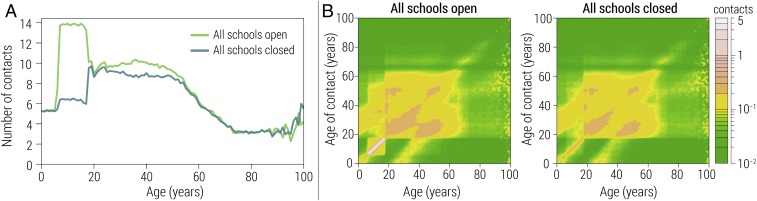
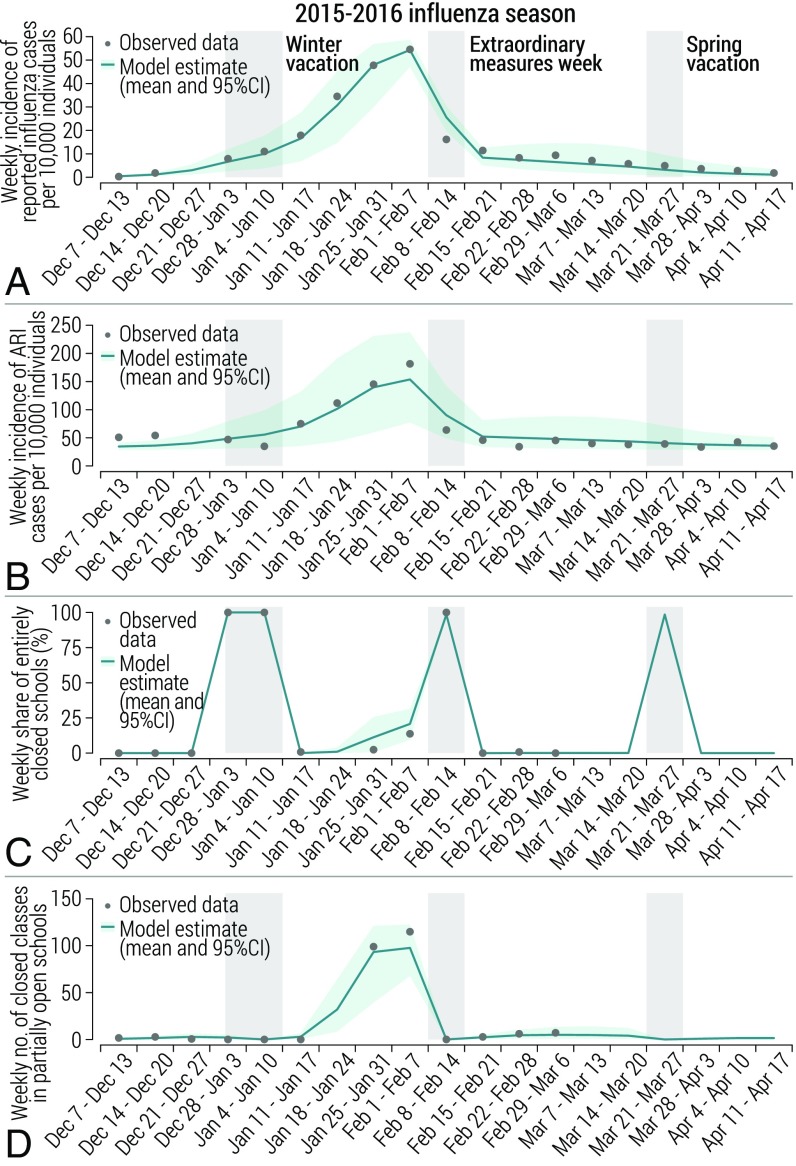
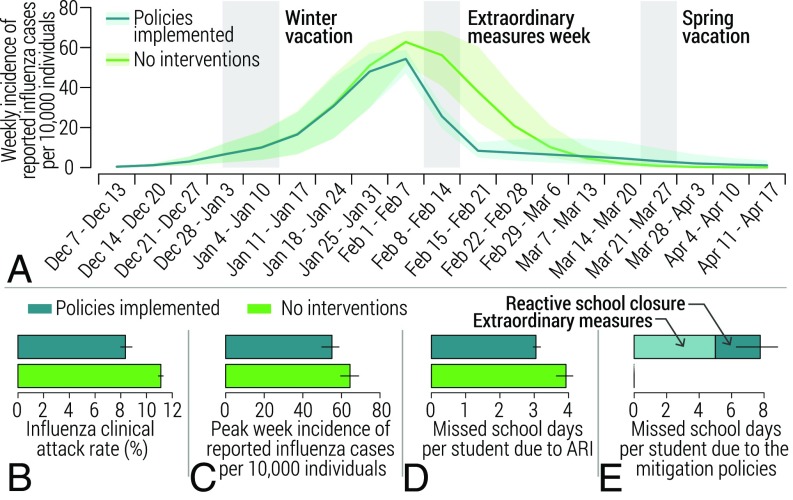
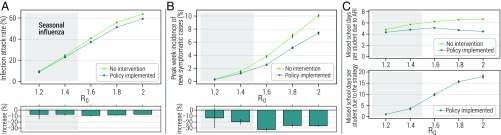
School-closure policies are considered one of the most promising nonpharmaceutical interventions for mitigating seasonal and pandemic influenza. However, their effectiveness is still debated, primarily due to the lack of empirical evidence about the behavior of the population during the implementation of the policy. Over the course of the 2015 to 2016 influenza season in Russia, we performed a diary-based contact survey to estimate the patterns of social interactions before and during the implementation of reactive school-closure strategies. We develop an innovative hybrid survey-modeling framework to estimate the time-varying network of human social interactions. By integrating this network with an infection transmission model, we reduce the uncertainty surrounding the impact of school-closure policies in mitigating the spread of influenza. When the school-closure policy is in place, we measure a significant reduction in the number of contacts made by students (14.2 vs. 6.5 contacts per day) and workers (11.2 vs. 8.7 contacts per day). This reduction is not offset by the measured increase in the number of contacts between students and nonhousehold relatives. Model simulations suggest that gradual reactive school-closure policies based on monitoring student absenteeism rates are capable of mitigating influenza spread. We estimate that without the implemented reactive strategies the attack rate of the 2015 to 2016 influenza season would have been 33% larger. Our study sheds light on the social mixing patterns of the population during the implementation of reactive school closures and provides key instruments for future cost-effectiveness analyses of school-closure policies.

Keywords: influenza; mixing patterns; network science; school-closure strategies.


Conflict of interest statement

The authors declare no conflict of interest.

Figures

Fig. 1.
Fig. 1.
Number of contacts. (A) Mean daily number of contacts by activity status of the participant (i.e., student, worker, or not employed) and school/class status (i.e., either open or closed as a result of the school-closure policy) based on the contact survey data. The asterisks below the bars denote the level of significance of the reduction (two-sided t test): * P <0.05, ** P <0.01, *** P <0.001. (B) As in A, but split by age group of the contacted individual. (C) As in A, but split by relation between the participant and the contact. (D) As in A, but split by location where the reported contact took place.
Fig. 2.
Fig. 2.
Estimated number of contacts at the population level. (A) Estimated mean daily number of contacts by age by assuming that all schools are either regularly open or closed at the same time as a consequence of the school-closure policy. (B) Estimated mean daily number of contacts by age of contact and contacted individuals, by assuming that all schools are regularly open (Left) and that all schools are closed at the same time as a consequence of the school-closure policy (Right).
Fig. 3.
Fig. 3.
The 2015 to 2016 influenza season. (A) Weekly incidence of reported influenza cases as observed in the data (calculated as the weekly ARI incidence multiplied by the share of collected samples testing positive for influenza in that week) and as estimated by the model (calculated as the incidence of symptomatic cases multiplied by the reporting rate). (B) Weekly incidence of ARI cases as observed in the data and as estimated by the model. (C) Weekly share of schools that are entirely closed as observed in the data and as estimated by the model. (D) Weekly number of closed classes in partially open schools as observed in the data and as estimated by the model.
Fig. 4.
Fig. 4.
Effect of the mitigation policies implemented during the 2015 to 2016 influenza season. (A) Weekly incidence of reported influenza cases as estimated by the calibrated model accounting for the performed mitigation policies and as resulting from the simulation of a counterfactual scenario not accounting for the interventions. Note that both scenarios account for winter and spring school vacations. (B) Estimated influenza clinical attack rate (which accounts for all symptomatic cases of influenza) in the two aforementioned scenarios. (C) As in B, but for the peak week incidence of reported influenza cases. (D) As in B, but for the number of school days missed per student due to ARI. (E) As in B, but for the number of school days missed per student due to the implementation of the mitigation policies.
Fig. 5.
Fig. 5.
Impact of school-closure policies. (A) Estimated mean infection attack rate of an influenza epidemic for different values of R0 when the epidemic is left untreated and when the Russian school-closure policy is implemented. The small vertical lines represent 95% CI. Bottom shows the estimated mean percentage increase when the policy is implemented. Vertical lines represent standard errors. (B) As in A, but for the peak week incidence of symptomatic cases. (C) As in A, Top, but for the number of school days missed per student due to influenza infection or other ARI over the entire course of the influenza season. Bottom shows the estimated number of school days missed per student due to the school-closure policy.

Similar articles

Cited by

References

    1. Hardelid P., et al. , Assessment of baseline age-specific antibody prevalence and incidence of infection to novel influenza A/H1N1 2009. Health Technol. Assess. 14, 115–192 (2010). - PubMed
    1. Reed C., Katz J. M., Hancock K., Balish A., Fry A. M., Prevalence of seropositivity to pandemic influenza A/H1N1 virus in the United States following the 2009 pandemic. PLoS One 7, e48187 (2012). - PMC - PubMed
    1. Weil M., et al. , The dynamics of infection and the persistence of immunity to A (H1N1) pdm09 virus in Israel. Influenza Other Respir. Viruses 7, 838–846 (2013). - PMC - PubMed
    1. Merler S., et al. , Pandemic influenza A/H1N1pdm in Italy: Age, risk and population susceptibility. PLoS One 8, e74785 (2013). - PMC - PubMed
    1. Fraser C., et al. , Pandemic potential of a strain of influenza A (H1N1): Early findings. Science 324, 1557–1561 (2009). - PMC - PubMed

Publication types

MeSH terms