. 2019 Aug 5;216(8):1925-1943.
doi: 10.1084/jem.20190009. Epub 2019 Jun 17.

C3- and CR3-dependent microglial clearance protects photoreceptors in retinitis pigmentosa

Affiliations

C3- and CR3-dependent microglial clearance protects photoreceptors in retinitis pigmentosa

Sean M Silverman et al. J Exp Med. .

Abstract

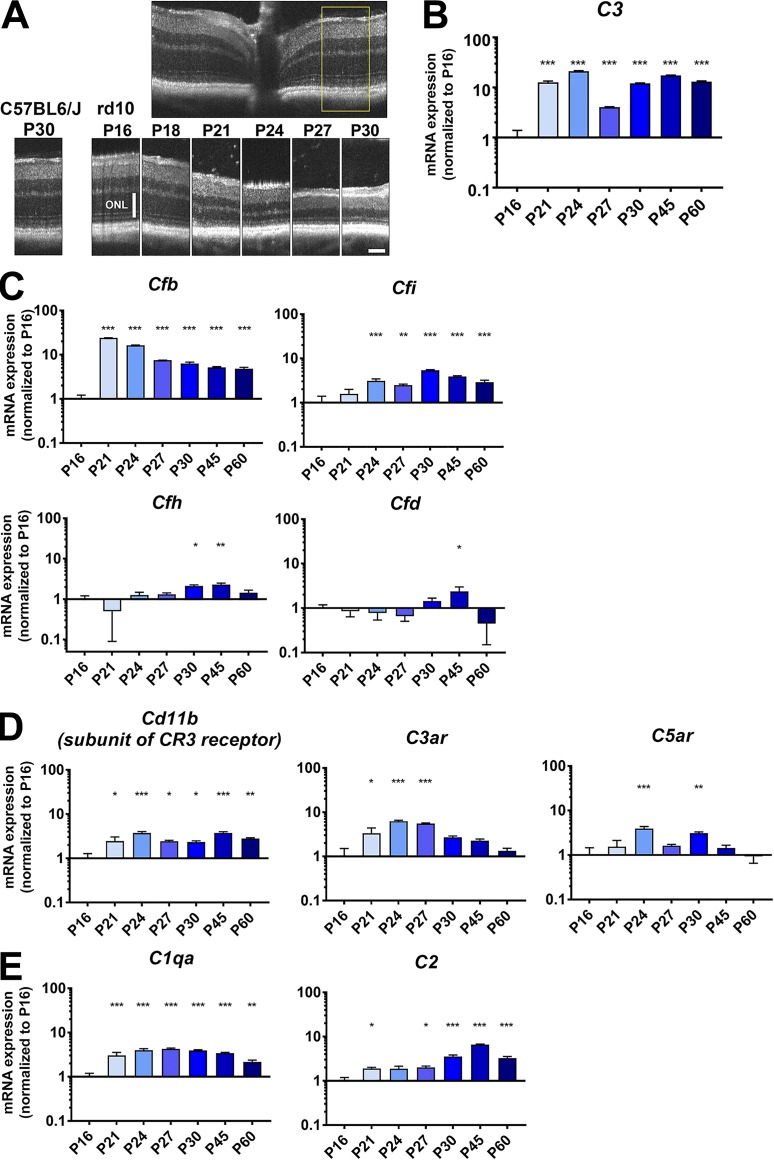
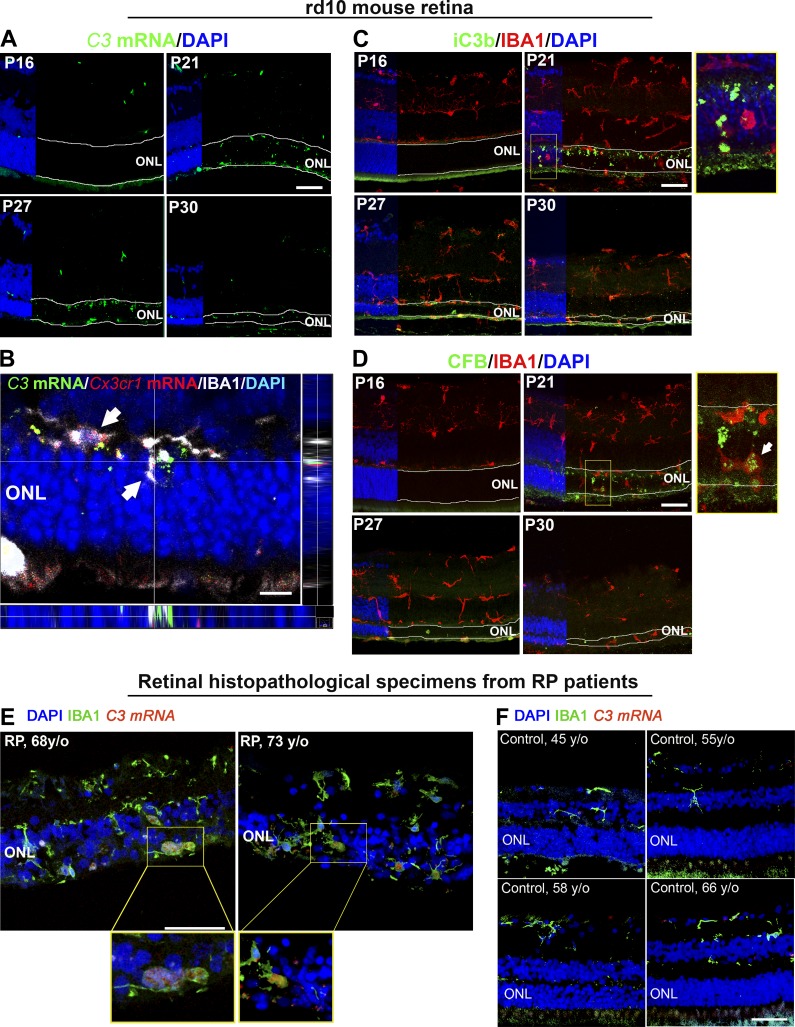
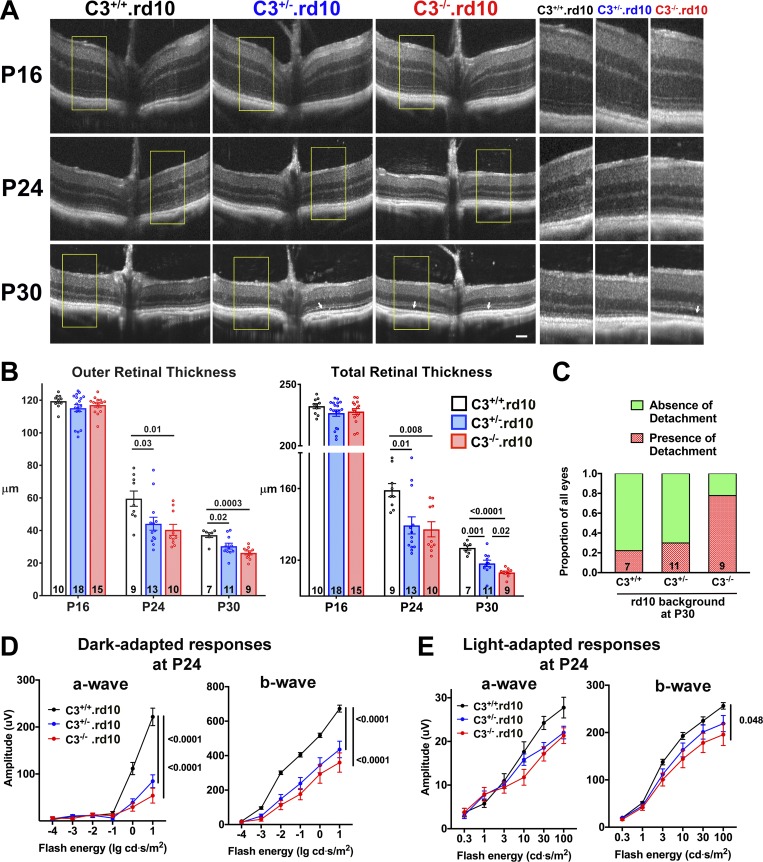
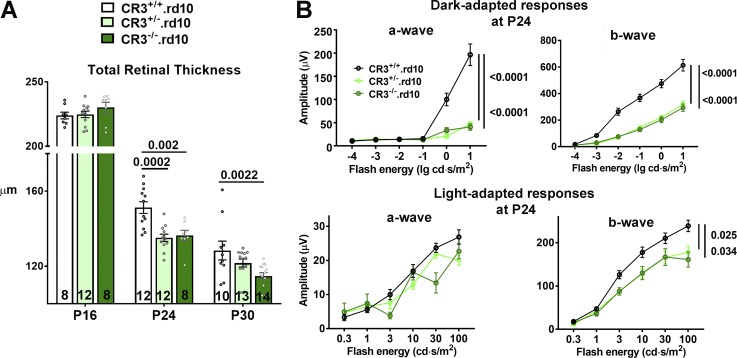
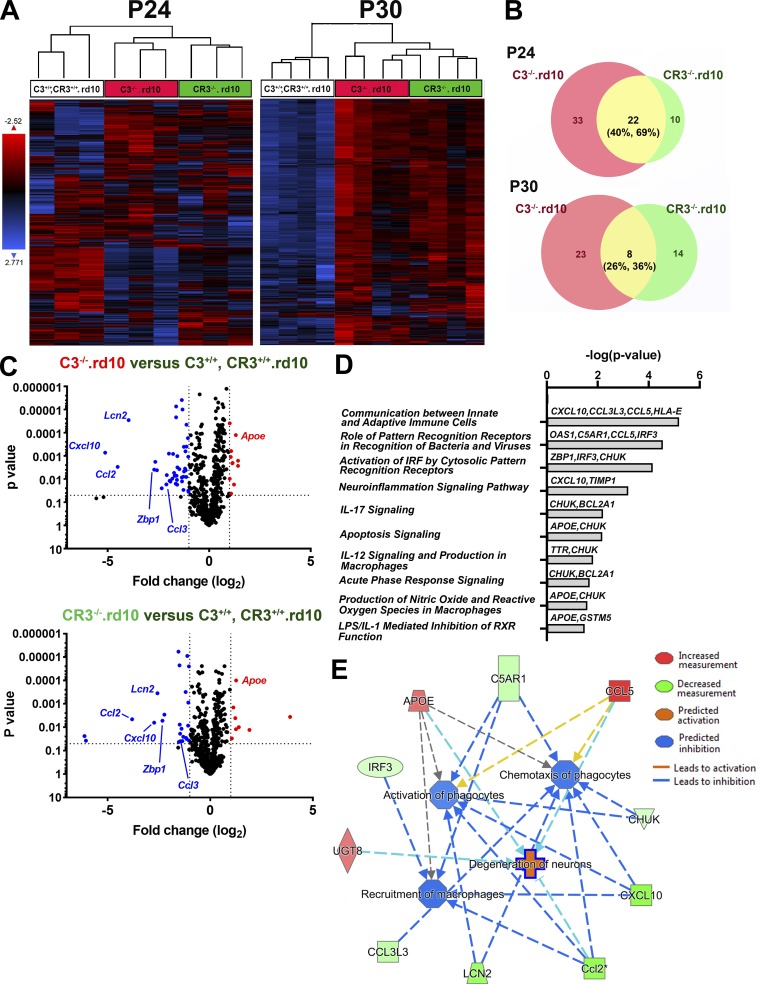
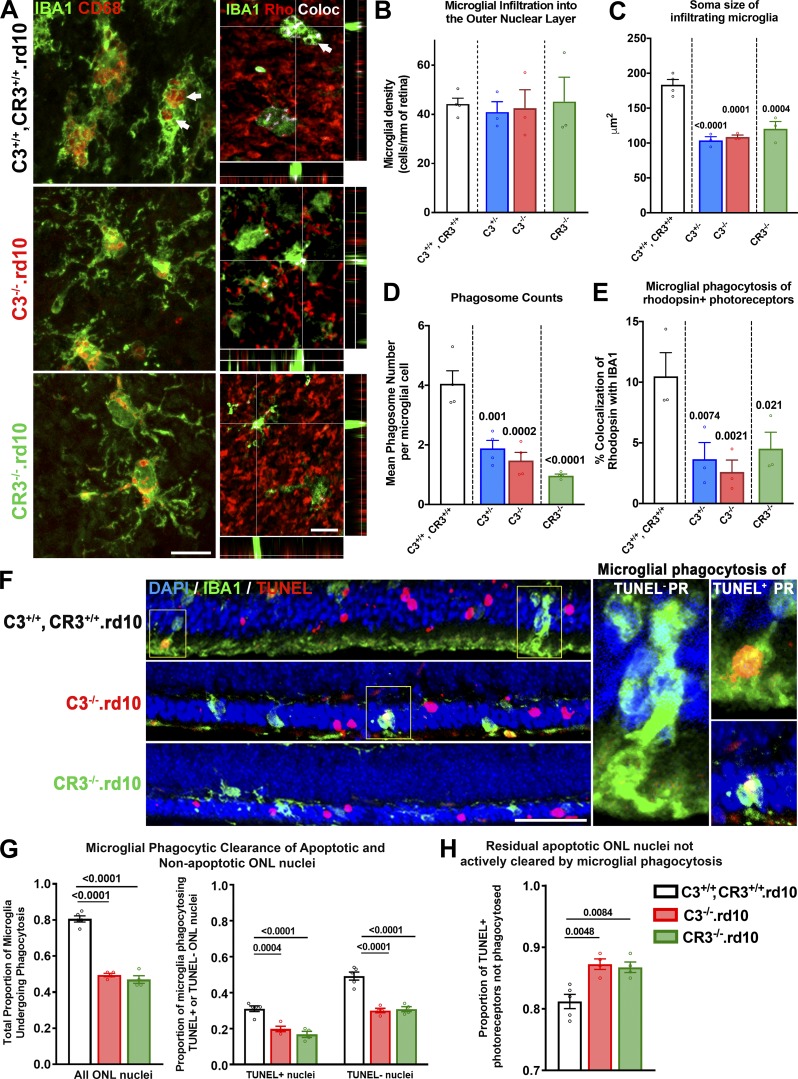
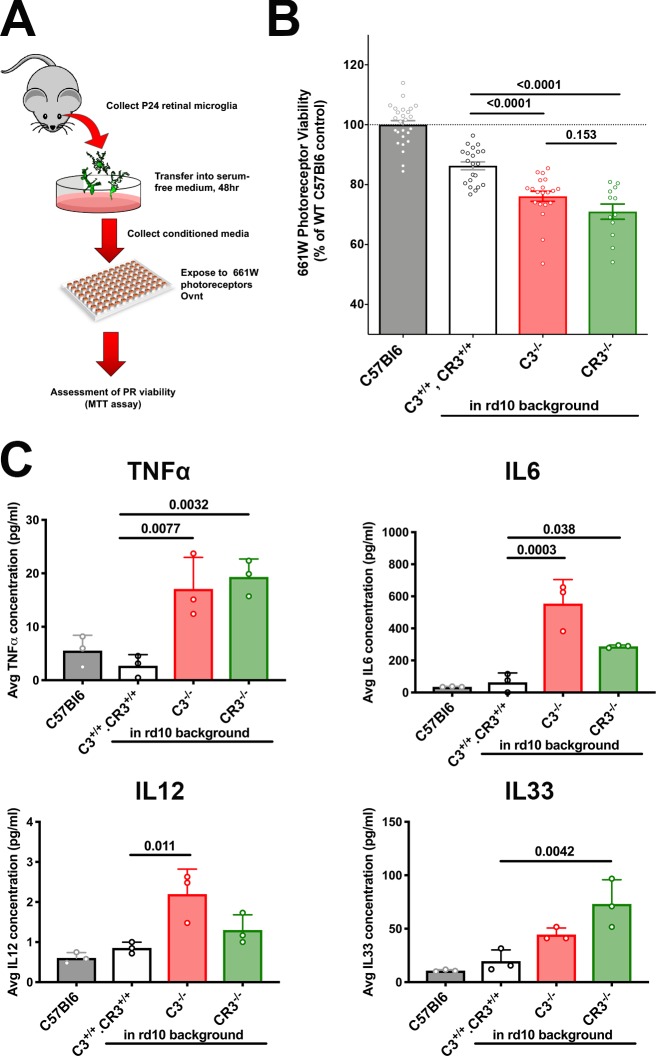
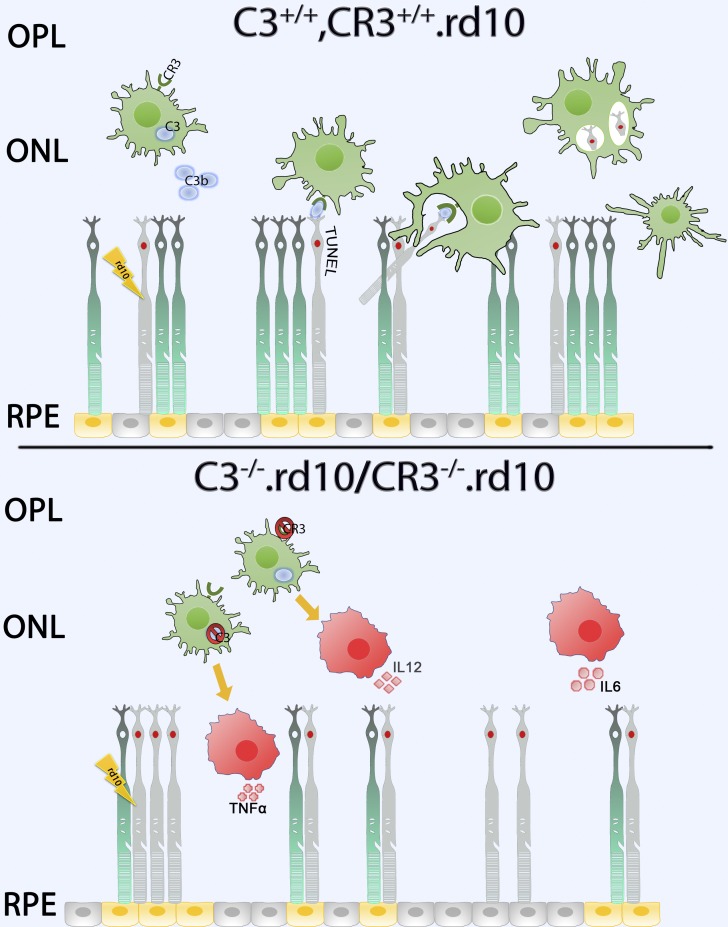
Complement activation has been implicated as contributing to neurodegeneration in retinal and brain pathologies, but its role in retinitis pigmentosa (RP), an inherited and largely incurable photoreceptor degenerative disease, is unclear. We found that multiple complement components were markedly up-regulated in retinas with human RP and the rd10 mouse model, coinciding spatiotemporally with photoreceptor degeneration, with increased C3 expression and activation localizing to activated retinal microglia. Genetic ablation of C3 accelerated structural and functional photoreceptor degeneration and altered retinal inflammatory gene expression. These phenotypes were recapitulated by genetic deletion of CR3, a microglia-expressed receptor for the C3 activation product iC3b, implicating C3-CR3 signaling as a regulator of microglia-photoreceptor interactions. Deficiency of C3 or CR3 decreased microglial phagocytosis of apoptotic photoreceptors and increased microglial neurotoxicity to photoreceptors, demonstrating a novel adaptive role for complement-mediated microglial clearance of apoptotic photoreceptors in RP. These homeostatic neuroinflammatory mechanisms are relevant to the design and interpretation of immunomodulatory therapeutic approaches to retinal degenerative disease.


Figures

Figure 1.
Figure 1.
mRNA expression of complement components, regulatory factors, and receptors demonstrate prominent up-regulation during photoreceptor degeneration in the rd10 mouse retina. (A) In vivo OCT of the central retina of rd10 mice demonstrated progressive atrophy of the ONL from P16 to P30. Inset (yellow box) shows the retinal locus of longitudinal comparison. Scale bar, 100 µm. (B) mRNA expression levels of C3 in the rd10 retina from P16 to P60 were analyzed. (C) Analysis of mRNA expression of complement regulatory factors showed early and marked up-regulation for Cfb and Cfi, but not for Cfh or Cfd. (D and E) mRNA levels for receptors of complement components, including Cd11b, C3ar, and C5ar (D), as well as for components of the classic complement pathway, C1qa and C2 (E), were also significantly increased during photoreceptor degeneration. mRNA expression levels at different time points were normalized to levels at P16. P values for comparisons relative to levels at P16: *, P < 0.05; **, P < 0.01; ***, P < 0.001; one-way ANOVA with Dunnett’s multiple comparison test; n = 4 animals per time point; data collected from two independent experiments for each gene. All data shown as mean ± SEM.
Figure 2.
Figure 2.
Increased complement expression and activation during photoreceptor loss are spatially localized to the degenerating ONL. (A) Analysis of C3 mRNA expression by in situ hybridization in retinal sections from rd10 animals aged P16–P30 demonstrated increased labeling located specifically within the ONL (highlighted by boundary lines) in sections from P21 to P30. (B) High-magnification analysis at P21 demonstrated that labeling for C3 (green) colocalized spatially with regions of Cx3cr1 (red) detected with in situ hybridization, and IBA1 immunopositivity (white), indicating prominent C3 up-regulation within microglia translocating into the degenerating ONL, as indicated by arrows. Orthogonal views demonstrate localization of C3 and Cx3cr1 mRNA within the IBA1+ microglial cytoplasm. Scale bar, 10 µm. (C) Immunohistochemical analysis for iC3b (green) demonstrated minimal immunopositivity at P16, but localized within the ONL beginning at P21. High-magnification analysis (inset) showed iC3b deposition on somata of ONL cells near IBA1+ (red) microglia. (D) Immunohistochemical analysis for CFB (green), a positive regulator of C3 activation, similarly demonstrates increased labeling beginning at P21, localizing in and around IBA1+ (red) microglia in the ONL (inset). n = 3 mice per time point; data collected from two independent experiments. (E) Localization of C3 mRNA expression by in situ hybridization (red) in histopathologic retinal sections from patients with RP (n = 2) demonstrates labeling in IBA1+ microglia (green) that have translocated into the ONL; insets show high-magnification views of ONL microglia with labeling for C3 mRNA within DAPI-labeled nuclei. (F) Similar evaluations of retinal sections from healthy middle-aged control patients without a diagnosis of retinal disease (n = 4) demonstrated an absence of microglia in the ONL or detectable C3 expression. Scale bars, 50 µm. Data collected from two independent experiments each for mouse and human samples.
Figure 3.
Figure 3.
In vivo structural and functional evidence of accelerated photoreceptor degeneration in C3-deficient rd10 mice. (A) OCT imaging was performed in rd10 mice that had been genetically ablated for C3 before (P16) and during (P24, P30) rod degeneration; littermates of the three genotypes were analyzed and compared. Insets (yellow boxes) show magnified and juxtaposed images comparing corresponding retinal areas. (B) Quantification of outer (from OPL to RPE) and total (from vitreal surface to the RPE) retinal thicknesses demonstrated statistical similarity between the three genotypes at P16 but accelerated thinning in C3+/−.rd10 and C3−/−.rd10 animals (number of eyes analyzed per group provided at the bottom of each column). (C) Analysis of retinal detachments observed (white arrows in A); the relative prevalence of such detachments at P30 was highest in C3−/−.rd10 and lowest in C3+/+.rd10 animals. (D) ERG evaluation at P24 demonstrated decreased dark-adapted, rod-dominant a- and b-wave amplitudes in C3+/−.rd10 and C3−/−.rd10 relative to C3+/+.rd10 animals. (E) Light-adapted, cone-mediated responses were similar in a-wave amplitudes, but slightly decreased in b-wave amplitudes for C3−/−.rd10 relative to C3+/+.rd10 animals (number of eyes analyzed: C3+/+.rd10 = 12; C3+/−.rd10 = 11, and C3−/−.rd10 = 9). P values derived from a two-way ANOVA with Tukey’s multiple comparisons test; data collected from five and three independent experiments for OCT and ERG, respectively. All data shown as mean ± SEM.
Figure 4.
Figure 4.
CR3 deficiency in the rd10 mouse demonstrates an accelerated phenotypic degeneration similar to that observed in C3 deficiency. (A) OCT imaging was performed in mice on the rd10 background (CR3+/+.rd10) and compared with animals in which one (CR3+/−.rd10) or both (CR3−/−.rd10) copies of the Cd11b (CR3) gene was genetically ablated. At P16, total retinal thickness was similar between all three genotypes. At P24 and P30, accelerated degeneration was found in CR3+/−.rd10 and CR3−/−.rd10 animals, relative to CR3+/+.rd10 animals. Number of eyes analyzed in each group is provided at the bottom of each column. (B) ERG evaluation of retinal function at P24 demonstrated significantly and markedly lower dark-adapted, rod-dominant a- and b-wave amplitudes in CR3+/−.rd10 and CR3−/−.rd10 relative to CR3+/+.rd10 animals. Comparison of light-adapted, cone-mediated responses did not show significant differences in a-wave amplitudes, but b-wave amplitudes were decreased in CR3+/−.rd10 and CR3−/−.rd10 animals. Number of eyes analyzed: 14, 16, and 10, for CR3+/+.rd10, CR3+/−.rd10, and CR3−/−.rd10 animals, respectively. P values were derived from a two-way ANOVA with Tukey’s multiple comparisons test; data collected from four independent OCT and ERG experiments. All data shown as mean ± SEM.
Figure 5.
Figure 5.
mRNA profiling of inflammatory-related genes using Nanostring reveals common differentially regulated genes between C3- and CR3-deficient rd10 retinas. Nanostring multiplex analysis was used to profile mRNA expression levels of 757 neuroinflammatory-related genes in retinas from the three genotypic groups at P24 and P30: (1) C3+/+, CR3+/+.rd10, (2) C3−/−.rd10, and (3) CR3−/−.rd10 retinas (n = 3–4 animals in each group at each age). (A) Unsupervised clustering of all genes expressed above background levels demonstrated similar patterns of gene expression between C3−/−.rd10, and CR3−/−.rd10 retinas at both P24 and P30. (B) DE genes (fold-change ≥2.0; P < 0.05) between C3+/+, CR3+/+.rd10 and C3−/−.rd10 retinas (red circles) and between C3+/+, CR3+/+.rd10 and CR3−/−.rd10 retinas (green circles) were identified at P24 and P30, and the number of DE genes in common between the two groups (yellow segments) was counted and expressed as fractional compositions in each group. Data from P24 and P30 collected in separate independent experiments. (C) Volcano plots highlighting the distributions of DE genes at P24 for both cross-group comparisons; annotations highlight DE genes common to both comparisons. (D) Listing of canonical pathways represented by common DE genes at P24 (n = 3). (E) Network analysis of functions attributed to common DE genes at P24.
Figure 6.
Figure 6.
Microglial phagocytosis of apoptotic photoreceptors is decreased with C3 and CR3 deficiency in the rd10 retina. (A–E) Immunohistochemical analysis of microglia translocating into the ONL was performed in flat-mounted retina isolated at P24 from: C3+/+, CR3+/+.rd10, C3−/−.rd10, and CR3−/−.rd10 mice. (A) IBA1+ microglia (green) in the ONL demonstrating a deramified and amoeboid morphology were found in close contact with rhodopsin-expressing rods (red). Many microglia also demonstrated one or more CD68-immunopositive intracellular phagosomes (arrows) that also colocalized with rhodopsin immunopositivity (depicted by white pixels). Scale bars, 10 µm. Densities of ONL microglia were similar between genotypes (B), but microglia from animals with genetic ablation of C3 or CR3 showed significantly smaller mean soma sizes (C) that corresponded to lower mean numbers of intracellular phagosomes per microglia (D) and decreased extents of rhodopsin colocalization within microglia (E), which reflected decreased microglial phagocytosis of rod photoreceptors. (F–H) Comparative analysis of phagocytosis of viable (TUNEL) and apoptotic (TUNEL+) photoreceptors by ONL microglia was performed for the three genotypes at P24. (F) Phagosomes within IBA1+ microglia were observed to contain both TUNEL+ and TUNEL nuclei (insets). Scale bar, 50 µm. (G) Decreased phagosomes in C3−/−.rd10 and CR3−/−.rd10 microglia relative to C3+/+, CR3+/+.rd10 microglia was reflected in decreased total phagocytic capacity; these differences were found for the subsets of microglia phagocytosing TUNEL+ photoreceptor nuclei and phagocytosing TUNEL photoreceptor nuclei. (H) The proportions of TUNEL+ nuclei remaining in the ONL were increased in C3 and in CR3 deficiency, indicating a greater accumulation of uncleared apoptotic photoreceptors in these genotypes. P values indicate comparisons to the C3+/+, CR3+/+.rd10 genotype using a one-way ANOVA with Dunnett’s multiple comparison test; n = 3–4 animals per genotypic group; all data collected from two independent experiments each. All data shown as mean ± SEM.
Figure 7.
Figure 7.
Decreased microglial phagocytic capacity from C3-CR3 deficiency is correlated with increased microglial neurotoxicity to 661W photoreceptors. (A) Schematic of in vitro neurotoxicity assay. (B) Microglia from degenerating rd10 retinas of all three genotypes was associated with a greater neurotoxic effect than microglia from C57BL6 retinas. Phagocytosis-deficient microglia from C3−/−.rd10 and CR3−/−.rd10 retinas in addition were associated with significantly greater neurotoxicity than C3+/+, CR3+/+.rd10 retinas. (C) Increased neurotoxicity in C3−/−.rd10, and CR3−/−.rd10 microglia was associated with increased secretion of proinflammatory cytokines TNFα, IL6, IL12, and IL33 in their conditioned media, compared with C57Bl6 WT and C3+/+, CR3+/+.rd10 microglia. P values were derived from a one-way ANOVA with Tukey’s multiple comparisons test; n = 14 and 3 replicates per condition for the neurotoxicity assay (A) and cytokine level assay, respectively. Data collected from three independent experiments in B and two independent experiments in C. All data shown as mean ± SEM.
Figure 8.
Figure 8.
Schematic depicting a C3-CR3–dependent mechanism of microglial phagocytic clearance of apoptotic photoreceptors in the degenerating rd10 retina. Upper panel: In the complement-sufficient rd10 (C3+/+, CR3+/+.rd10) mouse retina, microglia, sensing the degeneration of mutation-bearing rod photoreceptors, translocate into the ONL, up-regulating their expression and secretion of C3. Extracellular activation of C3b results in the opsonization of TUNEL+ apoptotic photoreceptors. CR3-expressing microglia recognize the opsonized targets via iC3b-CR3 binding and clear them via phagocytosis, after which ONL microglia are decreased in their activation status. Lower panel: In rd10 retinas for which either C3 (C3−/−.rd10) or CR3 (CR3−/−.rd10) is genetically deficient, the opsonization of apoptotic photoreceptors or the recognition of opsonized targets is impaired, respectively. Failure of microglial phagocytic clearance results in the accumulation of apoptotic TUNEL+ rods that induce a more rapid, non–cell-autonomous degeneration of nearby rod photoreceptors. Activated microglia potentiate degeneration through increased secretion of proinflammatory cytokines (TNFα, IL6, IL12), augmenting neurotoxicity to photoreceptors, and accelerating the course of structural and functional degeneration in the rd10 retina.

References

    1. Bajic G., Yatime L., Sim R.B., Vorup-Jensen T., and Andersen G.R.. 2013. Structural insight on the recognition of surface-bound opsonins by the integrin I domain of complement receptor 3. Proc. Natl. Acad. Sci. USA. 110:16426–16431. 10.1073/pnas.1311261110 - DOI - PMC - PubMed
    1. Berg A., Zelano J., Stephan A., Thams S., Barres B.A., Pekny M., Pekna M., and Cullheim S.. 2012. Reduced removal of synaptic terminals from axotomized spinal motoneurons in the absence of complement C3. Exp. Neurol. 237:8–17. 10.1016/j.expneurol.2012.06.008 - DOI - PubMed
    1. Bosco A., Anderson S.R., Breen K.T., Romero C.O., Steele M.R., Chiodo V.A., Boye S.L., Hauswirth W.W., Tomlinson S., and Vetter M.L.. 2018. Complement C3-Targeted Gene Therapy Restricts Onset and Progression of Neurodegeneration in Chronic Mouse Glaucoma. Mol. Ther. 26:2379–2396. 10.1016/j.ymthe.2018.08.017 - DOI - PMC - PubMed
    1. Boyer D.S., Schmidt-Erfurth U., van Lookeren Campagne M., Henry E.C., and Brittain C.. 2017. The Pathophysiology of Geographic Atrophy Secondary to Age-Related Macular Degeneration and the Complement Pathway as a Therapeutic Target. Retina. 37:819–835. 10.1097/IAE.0000000000001392 - DOI - PMC - PubMed
    1. Brown G.C., and Neher J.J.. 2014. Microglial phagocytosis of live neurons. Nat. Rev. Neurosci. 15:209–216. 10.1038/nrn3710 - DOI - PubMed

Publication types

MeSH terms